22institutetext: Spitzer Science Center, California Institute of Technology, 1200 East California Boulevard, MC 220-6, Pasadena, CA 91125
Spitzer/IRAC and ISOCAM/CVF insights on the origin of the Near to Mid-IR Galactic diffuse emission
Spitzer/IRAC images of extended emission provide a new insight on the nature of small dust particles in the Galactic diffuse interstellar medium. We measure IRAC colors of extended emission in several fields covering a range of Galactic latitudes and longitudes outside of star forming regions. We determine the nature of the Galactic diffuse emission in Spitzer/IRAC images by combining them with spectroscopic data. We show that PAH features make the emission in the IRAC 5.8 and 8.0 m channels, whereas the 3.3 m feature represents only 20 to 50% of the IRAC 3.6 m channel. A NIR continuum is necessary to account for IRAC 4.5 m emission and the remaining fraction of the IRAC 3.6 m emission. This continuum cannot be accounted by scattered light. It represents 9% of the total power absorbed by PAHs and 120% of the interstellar UV photon flux. The 3.3 m feature is observed to vary from field-to-field with respect to the IRAC 8.0 m channel. The continuum and 3.3 m feature intensities are not correlated.
We present model calculations which relate our measurements of the PAHs spectral energy distribution to the particles size and ionization state. Cation and neutral PAHs emission properties are inferred empirically from NGC7023 observations. PAHs caracteristics are best constrained in a line of sight towards the inner Galaxy, dominated by the Cold Neutral Medium phase : we find that the PAH cation fraction is about 50% and that their mean size is about 60 carbon atoms. A significant field-to-field dispersion in the PAH mean size, from 40 to 80 carbon atoms, is necessary to account for the observed variations in the 3.3 m feature intensity relative to the IRAC 8.0 m flux. However, one cannot be secure about the feature interpretation as long as the continuum origin remains unclear. The continuum and 3.3 m feature emission process could be the same even if they do not share carriers.
N. Flagey,
1 Introduction
Interstellar emission in the near infrared (NIR) traces the properties of the smallest dust particles known as polycyclic aromatic hydrocarbons (PAHs). Their presence in the diffuse interstellar medium (ISM) was inferred from photometric measurements with the Infra Red Astronomical Satellite (IRAS) (Boulanger et al. 1985), AROME (Giard et al. 1994) and the Diffuse Infra Red Background Experiment (DIRBE) (Dwek et al. 1997). First spectroscopic evidence was provided by the Infra Red Telescope in Space (IRTS) (Tanaka et al. 1996) and the Infrared Space Observatory (ISO) (Mattila et al. 1996) for the Galactic plane. ISO succeeded to detect the PAHs bands in spectra of high latitude cirrus clouds for m (Boulanger et al. 2000). Measurements of the shorter wavelength emission were still limited to bright objects such as visual reflection nebulae (Verstraete et al. 2001; van Diedenhoven et al. 2004). For the first time, with the Infra Red Array Camera (IRAC) on board Spitzer Space Telescope (SST), the sensitivity and angular resolution are available to measure the NIR interstellar emission independently of stellar emission modeling, unlike with DIRBE. First determination of IRAC colors in Galactic fields was reported in the first round of Spitzer publications by Lu (2004) from total power sky brightnesses. We undertake a more thorough study to quantify what can be learned on PAHs and the smallest dust particles with IRAC images of the diffuse Galactic emission.
Within PAH emission models, measurement of the 3.3 m feature is critical to constrain the PAH ionization state and size (Li & Draine 2001). The existence of PAHs with a few tens of atoms was proposed to account for the 3.3 m emission (Leger & Puget 1984). Moreover, a continuum underlying the 3.3 m feature has been detected in visual reflection nebulae (Sellgren et al. 1983), and more recently in galaxies (Lu et al. 2003). This continuum is not accounted for in PAH models and its origin is still open : is it fluorescence emission from PAHs or photoluminescence from larger grains ?
In section 2, we present the IRAC data taken from the Galactic First Look Survey (GFLS) and Galactic Legacy Infrared Mid-Plane Survey Extraordinaire (GLIMPSE) as well as complementary ISOCAM/CVF spectra. We measure IRAC colors of the Galactic diffuse emission (section 3) and combine them with spectroscopic data in section 4 to separate the contributions of the 3.3 m feature and the continuum to IRAC 3.6 m channel. In section 5, we use an updated version of the model of Desert et al. (1990) – detailed in the appendix – to bring constraints on the PAH mean size and ionization state (section 6). We discuss the origin of the NIR continuum in section 7.
2 Observations
2.1 Selected fields
For this study, we use images from the GFLS and one field from GLIMPSE that span a range of Galactic longitudes and latitudes. These fields point towards the diffuse Galactic medium, away from bright star forming regions over path lengths which increase with decreasing Galactic longitudes and latitudes. The GLIMPSE field is centered on Galactic plane at a longitude = 27.5 and extends over an area of 3 by 20. It is a mosaic of 71x4 fields of 5 by 5 with an individual exposure time of 2 seconds. The GFLS fields are centered on Galactic coordinates () = (254.4,+0), (105.6,+0.3), (105.6,+4), (105.6,+8), (105.6,+16) and (105.6,+32) and cover an area of 1 by 15. They are mosaics of 3x12 fields of 5 by 5 with an individual exposure time of 12 seconds.
We complement IRAC fields with ISOCAM/CVF spectroscopic data covering the 5 to 16 m wavelength range at the positions listed in Table 4 over a 3 by 3 area. These observations also point towards the diffuse Galactic medium, away from bright star forming regions. There is only one position common to IRAC and ISOCAM/CVF, centered on Galactic coordinates (26.8,+0.8). We estimate the gas column density along this line of sight from the Leiden/Dwingeloo survey (Burton & Hartmann 1994) and the Columbia survey (Cohen et al. 1986). The total column density is including . For we assume that the emission is optically thin, and for we use the conversion factor per unit emission expressed in .
2.2 ISOCAM/CVF spectroscopy
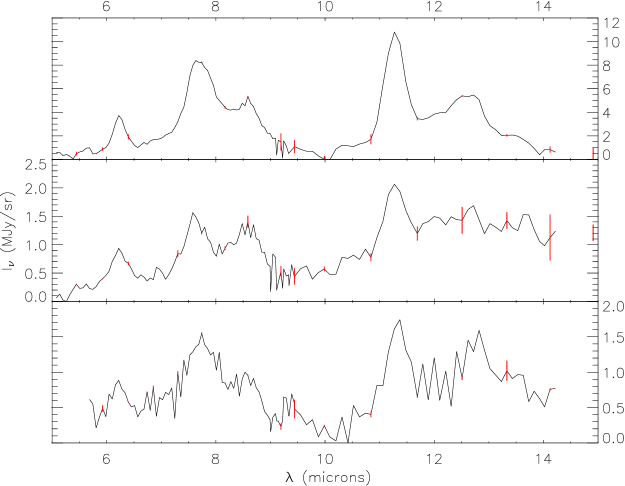
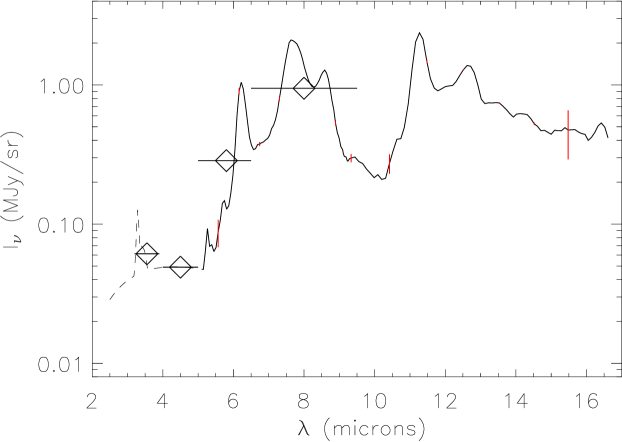
The ISOCAM/CVF spectra are taken from the ISO Archive. We use the Highly Processed Data Products (HPDP) as described by Boulanger et al. (2005). The spectral resolution is between 35 and 45 for between 5 and 16.5 m. We produce a mean spectrum by averaging all spectra over the 3 by 3 field of view. In each spectrum the PAH features are visible. The highest S/N spectrum, that centered on Galactic coordinates (26.8,+0.8), is shown on Fig. 1. The three others are plotted on Fig. 2. Error bars on the spectra, represented by vertical lines, were obtained by comparing spectra computed over distinct sub-areas. They are conservative estimates of the error bars as they may include true variations in the sky emission. The uncertainties are dominated by systematic effects (detector transients, zodiacal light subtraction) and are correlated over wavelengths (Boulanger et al. 2005).
2.3 IRAC images and processing
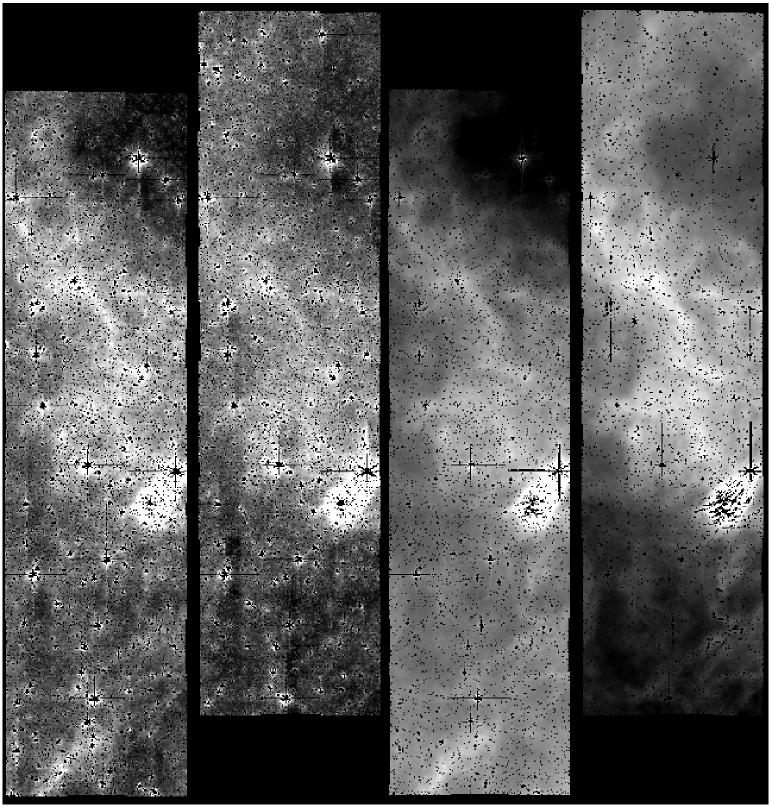
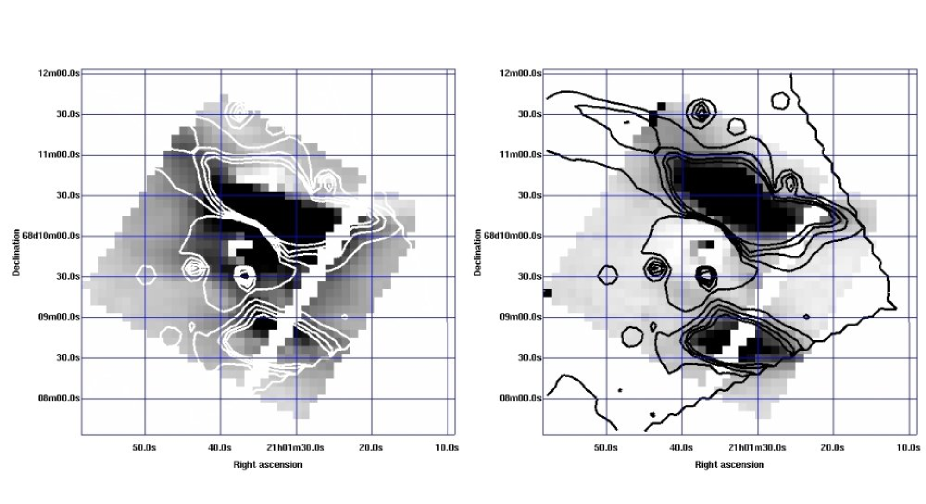
All the IRAC images come from the Spitzer Archive 111See http://ssc.spitzer.caltech.edu/archanaly/status/ (pipeline software version S11.0.2). We use the mosaiced images (post-bcd). The diffuse emission is clearly visible in almost all IRAC data at a Galactic latitude below 16 (see Fig. 3) but not at (105.6,+32) which is located in a low column density region and that we use as an estimator of the noise. The surface brightness sensitivities are 0.0397, 0.0451, 0.154 and 0.165 MJy/sr for IRAC 3.6, 4.5, 5.8 and 8.0 m channels, as given by the Spitzer Sensitivity Performance Estimation Tool for a low background level 222See http://ssc.spitzer.caltech.edu/tools/senspet/. For the GLIMPSE field, the integration time is shorter and the surface brightness sensitivities are 0.409, 0.385, 1.03 and 0.886 MJy/sr for IRAC 3.6, 4.5, 5.8 and 8.0 m channels, for a high background level.
We remove most of point sources by masking the pixels that are more than 3 away from the image processed by a median filtering window of 21x21 pixels (1 pixel = 1.2). Since we study the extended emission, we choose to apply a median filter (5x5 pixels) to the four IRAC channels data and keep 1 pixel of every 3. This reduces the image size and increase their signal-to-noise ratio. The effective resolution of the images is then about 6 . All images of a given field are projected on a common grid. We finally apply the photometric corrections given in Table 5.7 of the IRAC Data Handbook 333See http://ssc.spitzer.caltech.edu/irac/dh/ for “infinite aperture” to all IRAC photometric results, since we focus on the diffuse emission extended over a significant fraction of the fields. After these corrections, the absolute calibration accuracy is about 5%.
3 IRAC colors of the diffuse emission
We measure the diffuse emission colors on the GLIMPSE and GFLS fields by correlating the intensity in two IRAC channels. We discuss extinction correction and compute the ionized gas contribution to the colors.
3.1 Correlations
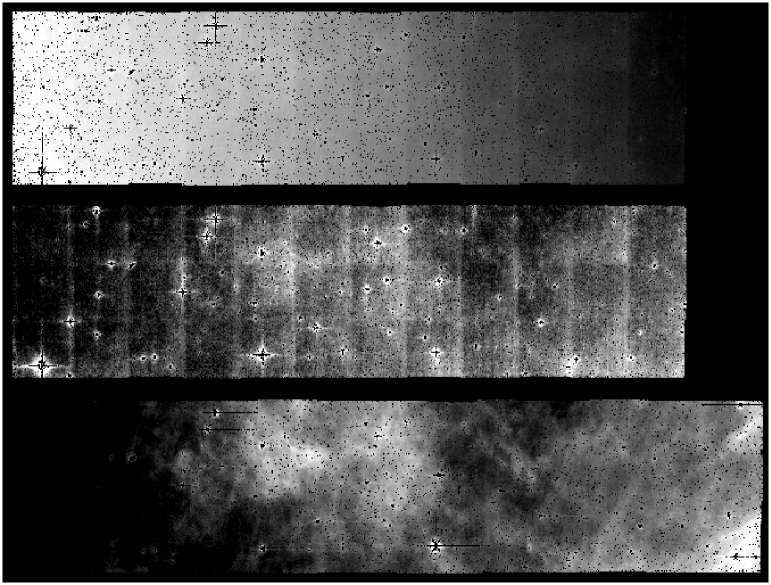
We measure the IRAC colors of the diffuse Galactic emission by correlating the brightness structure in each IRAC channel with the IRAC 8.0 m channel (see Fig. 5). Some IRAC images present a strong intensity gradient along the long axis, that is obviously an artifact (see Fig. 4), which appears during the mosaicing process and is due to bad dark-current correction. This gradient appears with different strengths on IRAC channels. It generally seems to be weak on IRAC 8.0 m channel, relative to the Galactic diffuse emission. On the other IRAC channels, especially at 5.8 m, the emission structure is sometimes dominated by a smooth gradient, that we take into account in the data correlation. We thus decompose each IRAC 3.6, 4.5 and 5.8 m images into a gradient, represented by a low order polynomial function of the long axis position, plus the emission structure of the IRAC 8.0 m channel. The uncertainties on the IRAC colors, associated with the gradient fitting, are estimated by looking at the variations of the color ratios with the order of the gradient.
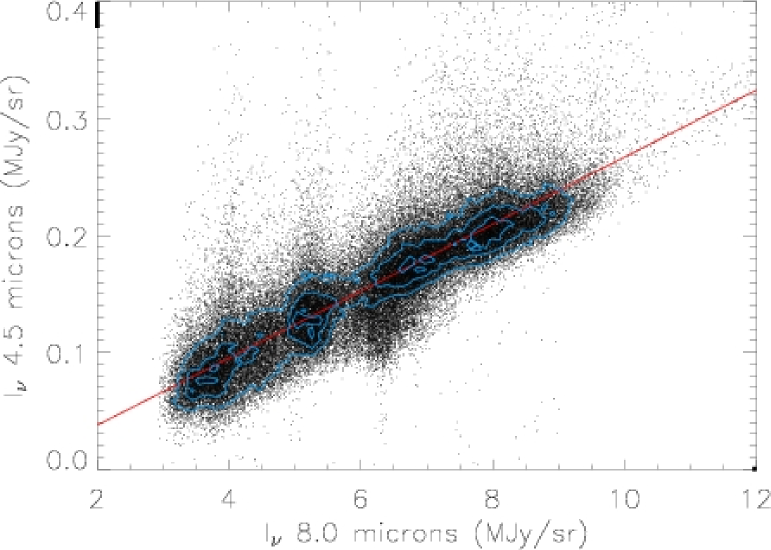
For each color, we iterate a linear regression, taking into account the statistical noise per pixel as measured in the high latitude field (0.0268, 0.0222, 0.581 and 0.0639 MJy/sr for IRAC 3.6, 4.5, 5.8 and 8.0 m channel), and at each iteration, the pixels that are more than 3 away from the linear fit are masked for the next fit, where is the standard deviation of the distance between the points and the straight line. Such pixels correspond to bright sources which are not removed by the median filter because they extend over an area comparable to the filter window. Five iterations are sufficient to converge.
3.2 Extinction correction
Total hydrogen column densities are estimated from HI and CO observations (see section 2). These column densities are converted into extinction in the IRAC channels combining from Savage & Mathis (1979), (Rieke & Lebofsky 1985) and the wavelength dependence of the extinction in IRAC channels determined from stellar measurements with GLIMPSE data (Indebetouw et al. 2005). We use their “Average” IRAC extinctions normalized to . The extinction corrections on the IRAC colors are not negligible for the GLIMPSE field, where the gas column density is the highest. For the other fields, the correction is small compared to uncertainties.
For the GLIMPSE field, our is closer than 10% to that given by the maps of Schlegel et al. (1998) with . We assume that the emitting dust is mixed with the grains responsible for the extinction. The following relation gives the intrinsic color , ratio between in IRAC channel and in IRAC channel, given the extinction at both wavelengths and the observed color , measured in section 3.1 :
| (1) |
is the only color to which we apply this correction. Differences in the extinction at 4.5, 5.8 and 8.0 m are within error bars (). The 3.6 m opacity is significant ( at ) but the color correction is relatively small (1.24) because the opacities at both wavelength are close to each other. The extinction depends on the Galactic latitude. The opacity gives the relevant extinction correction since the GLIMPSE colors are dominated by low-latitude emission. In the data analysis we combine IRAC colors with AROME 3.3 m feature observations and CVF spectroscopy. The extinction correction applied to the AROME measurements is consistent with ours (Giard et al. 1994). The extinction correction for the CVF field, located at , is negligible for m.
3.3 Ionized gas emission
Free-free as well as gas lines emission might contribute to IRAC 3.6 and 4.5 m channels, whatever the Galactic longitude. In order to obtain the contribution of the free-free emission at 3.6 and 4.5 m, we first measure this emission at 5 GHz. For the GLIMPSE field, we obtain the variation of the free-free emission from to at 5 GHz from Altenhoff et al. (1979). For the GFLS fields, we deduce the free-free emission at radio frequencies from the emission (Reynolds 1992). We measure the emission on the Full Sky Map corrected by extinction by Dickinson et al. (2003). Then, we extrapolate the electrons emission (free-free and free-bound) from 5 GHz to NIR according to Beckert et al. (2000).
We finally add the contribution of gas lines. The fluxes from the main H recombination lines within the IRAC channels (Pfδ at 3.296m, Pfγ at 3.739 m, Brα at 4.051 m, Pfβ at 4.652m, and Pfα at 7.46m ) per unit Brγ emission are taken from the Hummer & Storey (1987) Table for an electron temperature and density of and , and case B recombination (nebula optically thick to H ionizing photons). At 3.6 m, they represents 20% of the free-free emission, whereas at 4.5 m, they double its contribution. The total contribution of the free-free and gas lines emission is thus about 1% at 3.6 m and 3% at 4.5 m for most of GFLS fields, except the (105.6,+8) field, for which the contributions reach 3% and 11%. For the GLIMPSE field, the figures deduced from Altenhoff et al. (1979) are about 7% and 12%.
3.4 IRAC colors
| Spitzer GFLS (105.6,+0.3) | 0. | 076 | 0. | 065 | 0. | 37 | 0. | 014 | a | 0. | 062 | a | ||||
| Spitzer GFLS (105.6,+4) | 0. | 059 | 0. | 037 | 0. | 32 | 0. | 024 | a | 0. | 035 | a | ||||
| Spitzer GFLS (105.6,+8) | 0. | 094 | 0. | 050 | 0. | 26 | 0. | 047 | a | 0. | 047 | a | ||||
| Spitzer GFLS (105.6,+16) | 0. | 072 | 0. | 046 | 0. | 34 | 0. | 028 | a | 0. | 044 | a | ||||
| Spitzer GFLS (254.4,+0) | 0. | 068 | 0. | 043 | 0. | 37 | 0. | 027 | a | 0. | 041 | a | ||||
| Spitzer GLIMPSE (27.5) | 0. | 065 | 0. | 052 | 0. | 32 | 0. | 016 | b | 0. | 049 | a | ||||
| Giard et al. (1994) | - | - | - | 0. | 016 | - | ||||||||||
| Tanaka et al. (1996) | - | - | - | 0. | 016 | - | ||||||||||
| Dwek et al. (1997) | 0.0306 | 0.0339 | - | - | - | |||||||||||
| Arendt et al. (1998) | 0.0334 | 0.0394 | - | - | - | |||||||||||
| Li & Draine (2001) | 0.0477 | 0.0224 | 0.278 | 0.0264 a | 0.0213 a | |||||||||||
Resulting IRAC colors are given in the first three columns of Table 1. For the GLIMPSE field, they are plotted, together with the CVF spectrum on Fig. 1. The ratios, given by the CVF spectrum (0.30) on the one hand, and by the GLIMPSE field (0.32) on the other hand, are in a good agreement.
The measurements uncertainties come from the linear fitting process, including gradient correction, and do not exceed 3% on most of the IRAC colors. Extinction correction increase these uncertainties up to 10% whereas ionized gas corrections induce a negligible uncertainty. Taking into account the photometric accuracy (see section 3), the final uncertainty is about 13% on most of , and , and reaches 16% for the GFLS (105.6,+8) field.
Our colors are averaged over large areas and do not give an account of the small scale dispersion across the IRAC fields. However, they already show strong variations from one field to another, especially and , whereas does not vary that much around .
4 3.3 m feature and continuum
For the GLIMPSE field, AROME observations are combined with the IRAC colors to provide a spectrum of the diffuse emission from 3 to 5 m. We generalize this derivation to the other fields.
4.1 Inner Galaxy spectrum
Based on reflection nebulae observations, we interpret the GLIMPSE and colors with a PAH feature at 3.3 m and an underlying continuum. Spectroscopic observations of NGC7023 suggest that the feature and the continuum both contribute to the flux in IRAC 3.6 m channel, whereas the flux in IRAC 4.5 m channel is dominated by the continuum (Sellgren et al. 1983). The 3.3 m feature has been spectroscopically detected by IRTS in the inner Galaxy (Tanaka et al. 1996). It has been measured photometrically by the AROME experiment (Giard et al. 1994) and Bernard et al. (1994) show that the feature alone cannot account for the ISM emission in the DIRBE NIR channels.
In reflection nebulae, the continuum is well described by a gray-body with a color temperature . This temperature is constrained thanks to photometric measurements on both sides of the 3.3 m feature. To interpret the GLIMPSE colors, we construct a NIR diffuse emission spectrum with the spectral shape of the feature from the ISO/SWS spectrum of NGC7023 and a gray-body continuum. The feature intensity is taken from the AROME measurement, taking into account the spectral response of their filters. We then fit the color temperature and intensity of the continuum to match the IRAC and colors. The resulting spectrum is shown in Fig. 1. The data does not constrain the spectral shape of the continuum. The combination of IRAC colors and the AROME feature only determine the ratio between the continuum emission in the 3.6 and 4.5 m IRAC channels. The color temperature of the gray body is , as computed from IRAC colors and AROME measurement. This value is in the range given by Sellgren et al. (1983) for reflection nebulae, where the physical conditions are much different from the diffuse medium. The uncertainty on the color temperature is large because we only have two measurements to determine it.
We can thus separate, for the inner Galaxy spectrum, the contributions of the 3.3 m feature and the continuum to the IRAC 3.6 m channel, which can be expressed as linear combinations of the and colors (see Eq. 2 and 3). We define the contribution of the feature as the ratio between the flux of the 3.3 m feature through the IRAC 3.6 m channel and the flux of the PAH emission through the IRAC 8.0 m channel, hereafter .
| (2) |
The contribution of the continuum to the IRAC 3.6 m channel, is given by :
| (3) | |||||
The corresponding values are listed in Table 1.
4.2 Additional fields
For the GFLS fields, we cannot determine the value of the color temperature due to the lack of 3.3 m feature measurements. Since the ratio between the continuum flux in IRAC 3.6 and 4.5 m channels does not depend much on the color temperature, we assume that it does not vary among IRAC fields. Within this assumption, we use Eq. 2 and 3, and give the corresponding values of and for the IRAC fields in the two last columns of Table 1. It appears that the field to field variations of the 3.3 m feature intensity are important. There is a factor of between the smallest values, at () = (105.6,+0.3) and (27.5,+0), and the highest value found for () = (105.6,+8). On the contrary, the field to field variations of the continuum contribution are very weak. The mean value is about and there is less than a factor of between the extrema values. In all fields, the continuum has a strong contribution to the IRAC 3.6 m channel. It accounts for one half of the flux in IRAC 3.6 m channel at () = (105.6,+8) and for more than 75% at () = (27.5,+0) and (105.6,+0.3). There is no correlation between 3.3 m feature and continuum colors.
4.3 Comparison with DIRBE
With the inner Galaxy spectrum (Fig. 1), we can compare our IRAC colors to those obtained with DIRBE (Dwek et al. 1997; Arendt et al. 1998). We obtain these numbers, given in Table 1, by convolving the Galactic spectrum with the transmission curves of the instrument. For further studies, we give the conversion factors in Table 2. Our colors are significantly but slightly different from the DIRBE colors, especially for . However, this comparison does not lead to a unique conclusion. DIRBE colors corresponds to high-latitude emission which may well differ from those measured on IRAC fields. The difference may also reflect systematic uncertainties in the DIRBE analysis associated with stellar subtraction. Last, but not least, our spectroscopic model may also contribute to a significant part of the difference.
| Instrument and channel | Conversion factor |
|---|---|
| 0.917 | |
| 1.03 | |
| 0.749 | |
| 0.863 |
5 Spectral diagnostics of PAH size and ionization state
The PAH emission spectrum depends on both their charge state and size distribution. Li & Draine (2001) computed the diffuse ISM PAH spectrum with a model based on laboratory data. In Table 1 we compare our colors to those expected from their model. Their model values are reasonably close to the colors which do not include significant continuum contribution. We have developed our own model, for several reasons. (1) The values listed by Li & Draine (2001) corresponds to a mixture between the Cold Neutral Medium (CNM), the Warm Neutral Medium (WNM) and the Warm Ionized Medium (WIM) in proportions 43%, 43% and 14% in mass, which are characteristic of high-latitude line of sight but do not apply to the low latitudes IRAC fields for which a significant fraction of the gas is molecular and thus are mostly sampling the CNM. The ionization state of PAHs along these lines of sight might thus differ from that in Li & Draine (2001) model. (2) As pointed out in previous sections, the 3.3 m intensity measured through the color varies by a factor of 3 from field to field. We need to run a model over a grid of parameters to translate these variations in terms of PAH mean size and ionization state (see appendix A for details). (3) In a recent study, Rapacioli et al. (2005) proposed a spectral decomposition of NGC7023 ISOCAM/CVF spectro-imaging data leading to distinct emission spectra for cation and neutral PAHs. This opens the possibility to define the PAH properties from observations rather than laboratory measurements. Our model, an update of Desert et al. (1990), is based on this spectral decomposition, from which we derive the PAH cations and neutrals cross-sections, extending the work of Rapacioli et al. (2005).
We run the model, coupled with a module that computes the PAH ionization fraction as a function of the PAH size. We apply this for various PAH size distributions and values of the ionization parameter , where is the integrated far ultraviolet (6-13.6 eV) radiation field expressed in units of the Habing radiation field, is the gas temperature and is the electronic density. The PAH size distribution of Desert et al. (1990) has a mean size of 6 Å or 45 carbon atoms, according to the relation between the PAH size in angstroms and the number of carbon atoms . We vary the PAH mean size by changing the exponent of the PAH power law size distribution (standard value is ) keeping fixed the values of the minimum and maximum PAH sizes ( or Å).
We use two spectroscopic diagnostics to constrain the PAH properties : the ratio between the flux in the band at 7.7 and the band at 11.3 m (hereafter ) as well as .
5.1 as a tracer of PAH ionization state

Using a Lorentzian decomposition that fits the PAH features between 6.2 and 12.7 m, we calculate the ratio between the fluxes in the band at 7.7 and the band at 11.3 m (hereafter ) for each PAH model spectrum. The central wavelengths of the Lorentzian features are given as fixed inputs of the fitting process at 6.2, 7.6, 8.6, 11.3 and 12.7 m, whereas the widths and amplitudes are set free. Fig. 6 shows as a function of and the PAH mean size. In the model and within the range of values we consider, this ratio depends much more on the PAH ionization than on the average size : neutral PAHs present a lower ratio than ionized PAHs (Draine & Li 2001; Bakes et al. 2001). For a mean size of carbon atoms, grows from at to at , whereas it goes from to for a mean size of carbon atoms, between the same values of . This ratio traces the PAH ionization state.
5.2 as a tracer of PAH mean size
Since the model does not include the continuum underlying the 3.3 m feature, we immediately obtain by dividing the flux of the PAH model spectrum in the IRAC 3.6 m channel by its equivalent in the IRAC 8.0 m channel. Fig. 6 shows as a function of the PAH mean size and . Unlike , depends on the PAH size as well as their ionization, and it is much more dependent on the PAH mean size when the PAHs are small. The 3.3 m feature becomes fainter when the PAHs are big or ionized (Draine & Li 2001; Bakes et al. 2001). For a mean size of carbon atoms, goes from when to when , and from to for between the same values of . This ratio, when coupled with the previous one, constrains the PAH mean size.
6 PAH size and ionization state across the diffuse ISM

Combining and (see Fig. 6), we can now constrain the PAH mean size and ionization state for our inner Galactic spectrum, for which we have both these measurements. Adding the other IRAC colors , and , we simultaneously constrain the shape and strength of the continuum. We also discuss the variations of the PAH properties across the Galaxy.
6.1 Inner Galactic diffuse medium
For our inner Galactic spectrum, and . We compute a best-fit process over four parameters (, , and the continuum intensity and color temperature) taking into account five constraints (the two ratios previously detailes, as well as the three IRAC colors , and given in Table 1). The resulting is plotted on Fig. 7 and 8. The 3- error bars on the parameters correspond to . Fig. 9 shows the best-fit spectrum and corresponding physical parameters are listed in Table 3.
A PAH mean size of carbon atoms is larger by a factor of 1.3 than the mean size of Desert et al. (1990). Along the inner Galaxy line of sight, half of the gas is molecular (see section 2). A consistency check on the model is provided by the derived value of which should be close to that of the CNM. According to Li & Draine (2001) and Weingartner & Draine (2001), in a radiation field , for the CNM, for the WNM and for the WIM. Considering that the radiation field increases from the inner Galaxy to the solar neighborhood by a factor of (Sodroski et al. 1997), the ionization parameter for the CNM, near the molecular ring, is about , whereas the WIM and WNM are about and . Our Galactic spectrum is then in a good agreement with a CNM dominated medium, assuming that the mean CNM electron density and gas temperature are constant across the Galaxy. From the ionization parameter, we derive that the PAHs are half-neutral and half-cation. The contribution of the continuum in IRAC 3.6 m channel, (see Fig. 8), which corresponds to , is in agreement with the one empirically determined in section 4.


| Model output | Value | |
|---|---|---|
| 60 | 9 | |
| 1350 | 450 | |
| 42% | 7% | |
| Continuum contribution to IRAC 3.6 | 70% | 12% |
6.2 Field-to-field variations
Sakon et al. (2004) have measured 6.2, 7.7, 8.6 and 11.3 m features at different Galactic longitudes along the Galactic plane with IRTS spectroscopic data. They found that the 8.6 and 11.3 m features were systematically stronger relative to the 6.2 and 7.7 m features in the outer Galaxy than in the inner Galaxy. They suggest that PAH dehydrogenation or compactness may explain such band to band variations rather than ionization, even if they do not derive definite conclusions. Our CVF data allow us to address this question.
In Table 4, we list values for the different CVF lines of sight presented in section 2. The Lorentzian decomposition is made difficult on the CVF spectra by the weak S/N of some spectra and by the short range of covered wavelengths below 6.2 and above 12.7 m. In order to estimate the uncertainties of this measure, we try different methods, that differ by the lorentzians parameters we fix or set free (position, amplitude or width). We give the ratios in Table 4 where we also list the Sakon et al. (2004) values. Our two values for the inner galaxy (G26.8 and G30) are lower than those of Sakon et al. (2004) and there are no signs of a systematic Galactic gradient in the CVF data nor in color (see Table 1).
| Line of sight | Galactic coordinates | ||||
|---|---|---|---|---|---|
| (l,b) | |||||
| G26.8 | (26.8,0.8) | 1. | 5 | 0. | 1 |
| G34.1 | (34.1,13.4) | 1. | 6 | 0. | 2 |
| G30 | (30.0,3.0) | 1. | 3 | 0. | 1 |
| G299.7 | (299.7,-16.3) | 1. | 2 | 0. | 3 |
| Sakon et al. (2004) l=-8 | (-8,0) | 2. | 85 | 0. | 17 |
| Sakon et al. (2004) l=48 | (48,0) | 1. | 99 | 0. | 05 |
| Sakon et al. (2004) l=-132 | (-132,0) | 1. | 42 | 0. | 40 |
| Sakon et al. (2004) l=172 | (172,0) | 1. | 65 | 0. | 37 |
Within our model, the observed variations in the color of the Spitzer fields must trace variations in the PAH mean size. We refer to the solid lines plotted on Fig. 6. Since the stellar radiation field decreases from the inner to the outer galaxy, we consider that is lower for the GFLS fields than for the GLIMPSE field (we assume that and are almost constant from field to field). Besides, we use the CNM value of Li & Draine (2001) and Weingartner & Draine (2001) as a lower limit because some of the gas must be in the WNM and WIM phases, where this ionization parameter is higher. This range of ionization factors allows us to constrain the mean size for each field, using the value of color. The derived PAH mean sizes are given in Table 1. To estimate the error bars, we use (resulting from the fit) in Eq. 2 and 3. There is a factor of between the two extreme values, at (105.6,+8) with carbon atoms and at (105.6,+0.3) with carbon atoms. The other PAH mean sizes are about carbon atoms. What clearly appears is that we observe significant variations in the PAH mean size : the field at (105.6,+8) has much smaller PAHs than the field at (105.6,+0.3) and the GLIMPSE field.
7 The origin of the NIR continuum
The NIR dust continuum, first detected in visual reflection nebulae (Sellgren et al. 1983) and observed in galaxies (Lu et al. 2003), is found to also exist in the diffuse ISM, where the radiation field is thousand times lower than in a reflection nebula like NGC7023. This continuum accounts for 50% to 80% of the IRAC 3.6 m channel intensity in the diffuse medium and its field-to-field variations are weak, relative to the IRAC 8.0 m flux (see Table 1 and Fig. 8). We compare our values to the one found for galaxies by Lu et al. (2003); Lu (2004). We estimate the contribution of free-free and gas lines emission to their IRAC 3.6 and 4.5 m colors, using the to PAH emission ratio found by Roussel et al. (2001). The Lu (2004) corrected colors and are thus in agreement with those we measure, even if they seem to be slightly smaller.
The continuum observations raise two questions : what are the carriers ? what is the emission process ?
It is not scattered light. With the scattering properties for dust in the diffuse ISM given by Li & Draine (2001) and the NIR interstellar radiation field derived from DIRBE NIR sky maps, we estimate the intensity of the scattered light per H nucleon. The scattered light accounts for 4% and 1% of the measured continuum in IRAC 3.6 and 4.5 m channels in the inner Galactic spectrum.
PAH fluorescence has been proposed to account for the continuum. We estimate the necessary photon conversion efficiency by dividing the number of photons emitted in the continuum between 2.5 and 5 m by the number of photons absorbed in UV by PAHs. We assume that all of the UV energy absorbed by PAHs is re-emitted in the infrared and the mean energy of a UV photon absorbed by a PAH is (Li & Draine 2001). We thus find that the necessary photon conversion efficiency is about 120%. Gordon et al. (1998) performed a similar calculation for the extended red emission (ERE) and obtained an efficiency lower-limit of 10% assuming that all the photons absorbed by the dust are absorbed by the ERE producing material. Taking into account that PAHs are responsible for one quarter of the dust UV energy absorption, we find a NIR efficiency a factor of 3 higher than the ERE efficiency. If we consider a solid photoluminescence process – due to VSGs – instead of the molecular fluorescence, it leads to an equivalent photon conversion efficiency, because VSGs absorb almost the same energy as PAHs. In terms of energy, the molecular fluorescence or solid photoluminescence have an efficiency of about 8.5%.
Sellgren (1984) have suggested that tri-dimensional grains of 45 to 100 carbon atoms that undergo stochastic heating like PAHs may be the carriers of the continuum in reflection nebulae. As mentioned in section 6.2, the PAH mean size varies from carbon atoms to carbon atoms in the different IRAC fields we analyze. However, in our analysis, the continuum is not correlated with the PAH mean size. An & Sellgren (2003) found a systematic increase of the feature to continuum ratio with increasing distance to the exciting star of NGC7023. This could only reflect the dependence of the feature emission on the ionization state and not tell us anything about the continuum.
The continuum emission questions the 3.3 m feature interpretation. If there is an efficient fluorescence mechanism for the continuum, it could also account for the feature. Even if the carriers of the continuum and feature are distinct, we cannot discard the possibility that the emission process is the same. One cannot be secure about the feature interpretation as long as the continuum origin remains unclear.
8 Conclusion
We combine IRAC (GFLS and GLIMPSE fields) and ISOCAM/CVF data to characterize the Near to Mid-IR Galactic diffuse ISM emission. Our results are as follows :
-
•
Extended diffuse emission is visible in most fields at the four IRAC wavelengths. We obtain IRAC colors by correlating the spatial distribution of the extended emission from one channel to another. CVF spectroscopic data available on our main field, pointing towards the inner Galaxy, directly demonstrates that the emission in the 5.8 and 8.0 m channels comes from PAHs (mainly 6.2 and 7.7 m features). On the same field, comparison with 3.3 m feature photometric measurements show that PAHs accounts for only 25% of the IRAC 3.6 m channel flux. A NIR continuum, previously seen in reflection nebulae, must be present to account for the remaining fraction of the IRAC 3.6 m channel flux and the totality of the IRAC 4.5 m channel flux. This decomposition is generalized to the other fields to obtain the 3.3 m feature and continuum contributions to the IRAC 3.6 m channel flux.
-
•
Among the fields we analyze, the PAH colors exhibit significant variations. On the contrary, the continuum remains almost constant, relative to the PAH flux in the IRAC 8.0 m channel and is in agreement with the values found for galaxies.
-
•
We interpret observed colors and their variations in terms of PAH mean size and ionization state. For this, we update the model of Desert et al. (1990) introducing different IR cross-sections for cation and neutral PAHs, determined from NGC7023 IRAC and ISOCAM/CVF observations. We use two spectroscopic diagnostics within the model and fit our main field observations with a set of 5 colors. The ratio between the 7.7 and the 11.3 m features leads to a constraint on which governs the equilibrium between cationic and neutral PAHs. For the GLIMPSE field, we find in agreement with theoretical expectations for a CNM dominated line of sight and the molecular ring radiation field. The cation fraction is about 50%. We also use the ratio between the 3.3 m feature seen by IRAC 3.6 m channel and the PAH emission in IRAC 8.0 m channel to derive constraints on the PAH mean size. Combining both ratios, we show that there is a significant dispersion in the PAH mean size, which varies among the IRAC fields, from 38 to 80 carbon atoms.
-
•
The continuum intensity is not correlated with the 3.3 m feature, which implies that the continuum carriers might not be PAHs. It is not scattered light. A photon conversion efficiency of about 120% (energy conversion of 8.5%) is necessary to account for it by PAH fluorescence or VSG photoluminescence.
The IRAC colors we have measured should be useful for further analysis of the diffuse emission in IRAC images. An interesting development of this work should be the analysis of the IRAC colors and their variations on small spatial scales towards nearby clouds at high Galactic latitude to probe the evolution of PAH size distribution in interstellar clouds. If variations of PAH size distribution is confirmed, it could be correlated with variations in the extinction curve and diffuse infrared bands (DIBs) in order to trace the contribution of small PAHs to these signatures.
Appendix A Determination of neutral and cation PAH cross-sections
In order to interpret IRAC colors and their variations in terms of PAH mean size and ionization state, we update the model of Desert et al. (1990) to take into account the size depending ionization state of the PAHs. We thus introduce distinct emission properties for neutral and cationic PAHs. Immediately note that this model only gives an account of the PAH features emission but not of the continuum emission. The 3 to 13 m absorption cross sections of these two PAH forms are deduced from spectro-imaging CVF and IRAC observations of NGC7023.
First, emission spectra and of pure PAH cations or neutrals are obtained through the following procedure. We start from the Rapacioli et al. (2005) spectra for m based on their linear decomposition of the NGC7023 ISOCAM/CVF observations. With these spectra, we make a linear decomposition of CVF map which gives us weight-maps and of the PAH neutrals and cations spectra contributions (see Eq. 4 and Fig. 10). accounts for emission of larger dust particles (VSGs).
| (4) | |||||
With these two weight-maps, we decompose the difference map between IRAC 3.6 m and IRAC 4.5 m channel, according to Eq. 2, to obtain and at . We also perform this decomposition on the IRAC 8.0 m channel.

The second step is to invert the emission spectra into absorption cross sections of PAH neutrals and cations. We assume that the PAH size distribution is the one of Desert et al. (1990) model and we approximate the spectral distribution of NGC7023 radiation field by a black body of (the effective temperature of the illuminating star). The inversion does not depend on field intensity. We iterate on the cross sections values until the model reproduces the emission spectra, and the intensity in IRAC 8.0 m channel and 3.3 m feature to an accuracy better than 10%.
| 3. | 3 | 1. | 0 | 20 | 1. | 0 | 20 |
| 5. | 25 | 0. | 013 | 43 | 0. | 82 | 43 |
| 5. | 7 | 0. | 026 | 43 | 0. | 69 | 43 |
| 6. | 2 | 0. | 401 | 25 | 24. | 0 | 32 |
| 6. | 85 | 0. | 064 | 65 | 3. | 65 | 85 |
| 7. | 5 | 0. | 129 | 26 | 9. | 60 | 36 |
| 7. | 6 | 0. | 450 | 31 | 17. | 3 | 26 |
| 7. | 83 | 0. | 206 | 31 | 14. | 4 | 45 |
| 8. | 6 | 1. | 29 | 20 | 54. | 7 | 25 |
| 11. | 3 | 3. | 34 | 10 | 28. | 8 | 20 |
| 12. | 0 | 0. | 154 | 12 | 5. | 28 | 15 |
| 12. | 7 | 0. | 900 | 13 | 21. | 1 | 10 |
The final amplitudes and widths for both PAH cations and neutrals are given in Table 5. The integrated cross-sections are given by the products of these two quantities. The cross-sections ratios for a given ionization state differ from those of Li & Draine (2001) by up to a factor of a few. The good correlation between PAH neutrals and the feature clearly appears on Fig. 10, where contours are the 3.3 m feature intensity, whereas PAH cations are closer to the star. The cross-sections of pure PAH cations and neutrals, for the Mathis radiation field and for the standard size distribution are shown in Fig. 11.
The model is coupled with a module that computes the cation, neutral and anion fractions for each PAH size from the local balance between the photo-ionization, the electron recombination, the electronic attachment and the photo-detachment processes as quantified by (Le Page et al. (2001)). The cation to neutral fraction depends on , where is the integrated far ultraviolet (6-13.6 eV) radiation field expressed in units of the Habing radiation field, is the gas temperature and is the electronic density. The fraction of PAH anions is computed to be small for diffuse ISM physical conditions (). The small fraction of anions is assumed to have the same emission properties than neutrals.
References
- Altenhoff et al. (1979) Altenhoff, W. J., Downes, D., Pauls, T., & Schraml, J. 1979, A&AS, 35, 23
- An & Sellgren (2003) An, J. H. & Sellgren, K. 2003, ApJ, 599, 312
- Arendt et al. (1998) Arendt, R. G., Odegard, N., Weiland, J. L., et al. 1998, ApJ, 508, 74
- Bakes et al. (2001) Bakes, E. L. O., Tielens, A. G. G. M., & Bauschlicher, C. W. 2001, ApJ, 556, 501
- Beckert et al. (2000) Beckert, T., Duschl, W. J., & Mezger, P. G. 2000, A&A, 356, 1149
- Bernard et al. (1994) Bernard, J. P., Boulanger, F., Desert, F. X., et al. 1994, A&A, 291, L5
- Boulanger et al. (2000) Boulanger, F., Abergel, A., Cesarsky, D., et al. 2000, in ESA SP-455: ISO Beyond Point Sources: Studies of Extended Infrared Emission, 91–+
- Boulanger et al. (1985) Boulanger, F., Baud, B., & van Albada, G. D. 1985, A&A, 144, L9
- Boulanger et al. (2005) Boulanger, F., Lorente, R., Miville Deschênes, M. A., et al. 2005, A&A, 436, 1151
- Burton & Hartmann (1994) Burton, W. B. & Hartmann, D. 1994, Ap&SS, 217, 189
- Cohen et al. (1986) Cohen, R. S., Dame, T. M., & Thaddeus, P. 1986, ApJS, 60, 695
- Desert et al. (1990) Desert, F.-X., Boulanger, F., & Puget, J. L. 1990, A&A, 237, 215
- Dickinson et al. (2003) Dickinson, C., Davies, R. D., & Davis, R. J. 2003, MNRAS, 341, 369
- Draine & Li (2001) Draine, B. T. & Li, A. 2001, ApJ, 551, 807
- Dwek et al. (1997) Dwek, E., Arendt, R. G., Fixsen, D. J., et al. 1997, ApJ, 475, 565
- Giard et al. (1994) Giard, M., Lamarre, J. M., Pajot, F., & Serra, G. 1994, A&A, 286, 203
- Gordon et al. (1998) Gordon, K. D., Witt, A. N., & Friedmann, B. C. 1998, ApJ, 498, 522
- Hummer & Storey (1987) Hummer, D. G. & Storey, P. J. 1987, MNRAS, 224, 801
- Indebetouw et al. (2005) Indebetouw, R., Mathis, J. S., Babler, B. L., et al. 2005, ApJ, 619, 931
- Le Page et al. (2001) Le Page, V., Snow, T. P., & Bierbaum, V. M. 2001, ApJS, 132, 233
- Leger & Puget (1984) Leger, A. & Puget, J. L. 1984, A&A, 137, L5
- Li & Draine (2001) Li, A. & Draine, B. T. 2001, ApJ, 554, 778
- Lu (2004) Lu, N. 2004, ApJS, 154, 286
- Lu et al. (2003) Lu, N., Helou, G., Werner, M. W., et al. 2003, ApJ, 588, 199
- Mattila et al. (1996) Mattila, K., Lemke, D., Haikala, L. K., et al. 1996, A&A, 315, L353
- Rapacioli et al. (2005) Rapacioli, M., Joblin, C., & Boissel, P. 2005, A&A, 429, 193
- Reynolds (1992) Reynolds, R. J. 1992, ApJ, 392, L35
- Rieke & Lebofsky (1985) Rieke, G. H. & Lebofsky, M. J. 1985, ApJ, 288, 618
- Roussel et al. (2001) Roussel, H., Sauvage, M., Vigroux, L., & Bosma, A. 2001, A&A, 372, 427
- Sakon et al. (2004) Sakon, I., Onaka, T., Ishihara, D., et al. 2004, ApJ, 609, 203
- Savage & Mathis (1979) Savage, B. D. & Mathis, J. S. 1979, ARA&A, 17, 73
- Schlegel et al. (1998) Schlegel, D. J., Finkbeiner, D. P., & Davis, M. 1998, ApJ, 500, 525
- Sellgren (1984) Sellgren, K. 1984, ApJ, 277, 623
- Sellgren et al. (1983) Sellgren, K., Werner, M. W., & Dinerstein, H. L. 1983, ApJ, 271, L13
- Sodroski et al. (1997) Sodroski, T. J., Odegard, N., Arendt, R. G., et al. 1997, ApJ, 480, 173
- Tanaka et al. (1996) Tanaka, M., Matsumoto, T., Murakami, H., et al. 1996, PASJ, 48, L53
- van Diedenhoven et al. (2004) van Diedenhoven, B., Peeters, E., Van Kerckhoven, C., et al. 2004, ApJ, 611, 928
- Verstraete et al. (2001) Verstraete, L., Pech, C., Moutou, C., et al. 2001, A&A, 372, 981
- Weingartner & Draine (2001) Weingartner, J. C. & Draine, B. T. 2001, ApJS, 134, 263