A Massive Spiral Galaxy in the Zone of Avoidance††thanks: The observations were obtained with the Australia Telescope which is funded by the Commonwealth of Australia for operations as a National Facility managed by CSIRO.
Abstract
We report the discovery of a very H i-massive disk galaxy, HIZOA J0836–43, at a velocity of = 10689 km s-1, corresponding to a distance of 148 Mpc (assuming km s-1 Mpc-1). It was found during the course of a systematic H i survey of the southern Zone of Avoidance () with the multibeam system at the 64 m Parkes radio telescope. Follow-up observations with the Australia Telescope Compact Array (ATCA) reveal an extended H i disk. We derive an H i mass of . Using the H i radius, we estimate a total dynamical mass of , similar to the most massive known disk galaxies such as Malin 1. HIZOA J0836–43 lies deep in the Zone of Avoidance () where the optical extinction is very high, . However, in the near-infrared wavebands, where the extinction is considerably lower, HIZOA J0836–43 is clearly detected by both DENIS and 2MASS. Deep AAT near-infrared ( and -band) images show that HIZOA J0836–43 is an inclined disk galaxy with a prominent bulge (scale length 2.5″ or 1.7 kpc), and an extended disk (scale length 7″ or 4.7 kpc) which can be traced along the major axis out to a radius of 20″ or 13.4 kpc (at 20 mag arcsec-2 in ). The H i disk is much more extended, having a radius of 66 kpc at 1 pc-2. Detections in the radio continuum at 1.4 GHz and at 60 µm (IRAS) are consistent with HIZOA J0836–43 forming stars at a rate of 35 yr-1. We compare the properties of HIZOA J0836–43 with those of the most H i-massive galaxies currently known, UGC 4288, UGC 1752 and Malin 1, all of which are classified as giant low surface brightness galaxies.
keywords:
galaxies: individual (HIZOA J0836–43) — galaxies: formation1 Introduction
 |
Hierarchical models of structure formation in the early Universe predict that massive galaxies begin to form from the merging of low-mass systems at early times and that the mass and luminosity functions for galaxies evolve in a self-similar manner (Press & Schechter 1974; Cole et al. 2000). Such models (Kauffmann, White & Guiderdoni 1993; Klypin et al. 1997) predict large numbers of old low-mass systems and relatively small numbers of young high-mass systems. However, the detailed match between observations and predictions of the mass function is poor. Two well-documented discrepancies are (1) the small number of low-mass systems observed in the local Universe (Davies, Sabatini & Roberts 2004) and (2) the large number of massive, distant red galaxies, implying a significant density of massive galaxies at early times (Foerster Schreiber et al. 2004).
These discrepancies most probably arise because of the fundamental role of gas physics (supernova and AGN feedback, etc.) in determining the star-formation efficiency in halos of different mass (Kay et al. 2002). Indeed, a recent attempt to incorporate gas physics by the application of a suite of semi-analytic models to the Millennium run (Croton et al. 2006, Springel et al. 2005) has been remarkably successful in reproducing the exponentially decreasing volume density of objects more luminous than a characteristic value , as well as the observation that massive galaxies tend to contain older stars than low-mass systems.
Due to the sharp decline in the number of galaxies with (or ), large samples are needed to constrain the high-luminosity and high-mass ends of the galaxy luminosity and mass functions. In the optical, such a sample is provided by the 2dF Galaxy Redshift Survey, from which Norberg et al. (2002) find ( km s-1 Mpc-1) and a slight tendency for an overabundance of massive galaxies relative to a Schechter fit (although they comment that magnitude errors are mostly able to account for this deviation). Similar results are obtained from the Sloan Digital Sky Survey (Blanton et al. 2003).
To sample the high-mass end of the H i mass function, blind H i surveys such as the H i Parkes All-Sky Survey (HIPASS) are required. HIPASS is a systematic H i survey of the southern sky within the radial velocity range of km s-1 (Meyer et al. 2004). Zwaan et al. (2005) find a characteristic mass in neutral hydrogen gas of ( km s-1 Mpc-1), using a catalogue of 4315 H i galaxies from HIPASS. The mass function remains ill-constrained at the high-mass end, however, due to the increasing sparsity of high H i-massive galaxies.
We report here on the discovery and detailed properties of the most massive galaxy in the H i Zone of Avoidance Survey (HIZOA), a deep Parkes H i multibeam survey in the obscured region along the Galactic Plane (§2) (see Donley et al. 2005, Kraan-Korteweg et al. 2005, and Henning, Kraan-Korteweg, & Staveley-Smith 2005 for preliminary results). This galaxy, HIZOA J0836–43, is also the most H i-massive galaxy in the southern and northern-extension HIPASS catalogues, which consist of 4315 and 1003 H i sources, respectively (Meyer et al. 2004, Wong et al. 2005). At the mass of HIZOA J0836–43, , the volume density is Mpc-3 dex-1, a factor of times smaller than the corresponding value at .
A study of massive gaseous (and stellar) systems is of considerable interest in assessing whether the details of various galaxy formation scenarios, particularly the processes of merging and star-formation, remain viable under the most extreme conditions. The H i-massive galaxy to have received most attention is Malin 1, whose H i mass is reported to be somewhere in the range (Bothun et al. 1987; Pickering et al. 1997; Matthews et al. 2001)111Calibration uncertainties at the redshift of Malin 1 seem to be responsible for the large uncertainties in published mass estimates.. Malin 1’s high H i mass but low optical surface brightness is of interest in that it raises the possibility of a cosmologically significant amount of gas being locked up in such systems. However, such a population is not known to exist at the sensitivities of existing H i surveys (Rosenberg & Schneider 2002; Zwaan et al. 2003).
The radio and infrared properties of the newly-discovered galaxy are detailed in §3. In §4, we look at the H i and dynamical mass of HIZOA J0836–43, its star-formation rate, morphology, location on the Tully-Fisher relation, and environment. A comparison with other H i-massive galaxies is given in §5, followed by our conclusions in §6.
2 Discovery of HIZOA J0836–43 with the Parkes telescope
 |
 |
 |
 |
The galaxy HIZOA J0836–43 was first detected in the deep H i Zone of Avoidance (ZOA) survey made with the Parkes 64-m telescope between March 1997 and June 2002 (see Kraan-Korteweg et al. 2005). This blind survey utilised the Parkes 21-cm multibeam receiver, an array of 13 beams each with two orthogonal linear polarisations (for a detailed description see Staveley-Smith et al. 1996). The data were calibrated and gridded using the aips++ programs livedata and gridzilla, respectively; after gridding the beam width is 155. The data reduction is nearly identical to that of HIPASS (see Barnes et al. 2001, Henning et al. in preparation). The H i Zone of Avoidance survey covers the Galactic longitude range , comprising the southern Milky Way (Henning et al. in preparation) plus a northern extension (Donley et al. 2005), for the most opaque part of the ZOA, i.e. the latitude range . With a correlator bandwidth of 64 MHz divided into 1024 channels and an instantaneous velocity coverage of km s-1, the velocity spacing per channel is 13.2 km s-1, or 26 km s-1 after Hanning smoothing. The approximate total integration time is 2100 sec beam-1, resulting in an rms of 6 mJy beam-1 in large parts of the survey. Results of a shallow subset with an rms of 15 mJy beam-1, the ZOA H i-shallow survey (HIZSS), are given in Henning et al. (2000).
While visually inspecting the data cube centred on , an exceptionally strong signal ( = 47 mJy beam-1; see Fig. 1) for its very high velocity ( km s-1) was initially identified at (J2000) = , –43° 38′ (3′) or . The detected H i source, named HIZOA J0836–43, remains unresolved in the Parkes data.
As seen in Fig. 1, the H i signal of HIZOA J0836–43 is exceptionally broad with a velocity width of km s-1. Using the Parkes data we measure an H i flux density of 13.2 Jy km s-1 corresponding to an H i mass of = (assuming = 148 Mpc, see Section 3.1.1). This same signal was later independently identified in the recently released H i catalogue (HICAT, Meyer et al. 2004) obtained from HIPASS. It is listed there as HIPASS J0836–43. The H i parameters extracted from the respective surveys are given in Table 1.
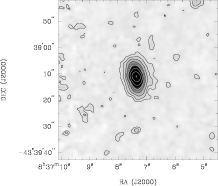
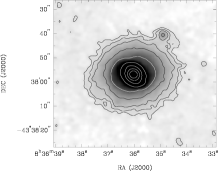
Detailed investigation of HIZOA J0836–43 is extremely difficult due to its location behind the Milky Way. According to the DIRBE/IRAS dust extinction maps of Schlegel et al. (1998) the -band extinction at the position of HIZOA J0836–43 is , although we caution that the data in the Galactic plane are not yet well calibrated. Not unexpectedly, this galaxy has no known optical counterpart, and inspection of the DSS images reveal only a very faint R-band counterpart. The corresponding extinction in the near-infrared (NIR) , , , and bands is much lower: , , , and , respectively. DENIS (; Epchtein 1997) and 2MASS (; Jarrett et al. 2000) reveal two and three possible counterparts, respectively, in all the wavebands, 2MASX J08365157–4337407, 2MASX J08370723–4339137 and 2MASX J08363600–4337556. As discussed in §3.1.1 and §3.2, the counterpart to HIZOA J0836–43 is 2MASX J08365157–4337407, a galaxy with an inclination of °.
3 Radio and infrared results
 |
 |
3.1 ATCA radio observations
H i line and 20-cm radio continuum observations of the galaxy HIZOA J0836–43 were obtained with the Australia Telescope Compact Array (ATCA) in the 750D and the 1.5D configurations. The observations took place on 2003 February 10 and November 28, respectively, with a total integration time of hours. For the H i line observations, we used a centre frequency of 1371 MHz and a bandwidth of 8 MHz, divided into 512 channels. This resulted in a channel width of 3.4 km s-1 and a velocity resolution of 4.1 km s-1. The wide-band 20-cm radio continuum observations were centred on 1384 MHz with a bandwidth of 128 MHz, divided into 32 channels. We used PKS B1934–638 as primary calibrator and PKS B0823–500 as secondary calibrator. Their flux densities are 15.0 Jy and 5.5 Jy at 1378 MHz, respectively. Data reduction was carried out with the miriad software package using standard procedures.
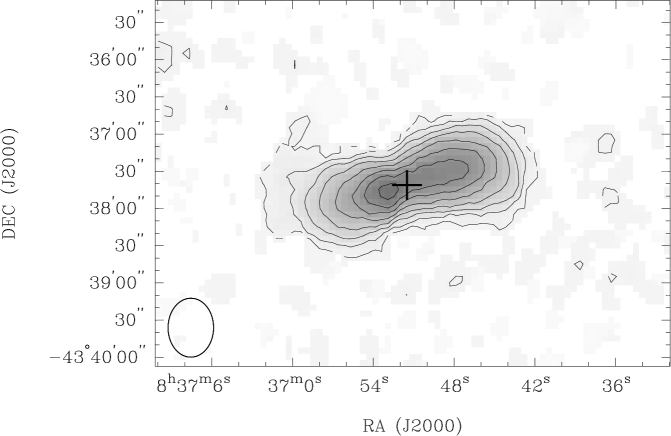
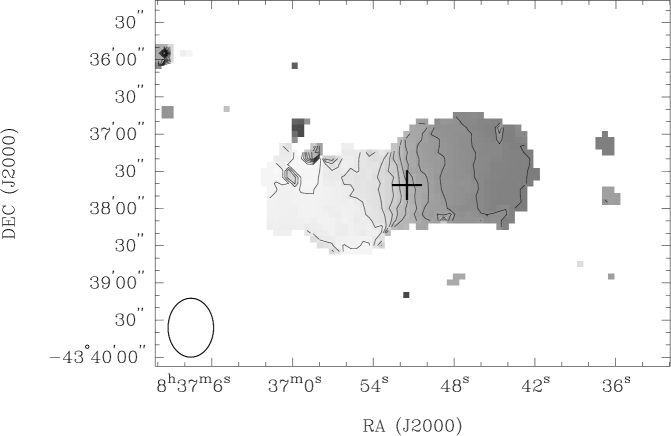
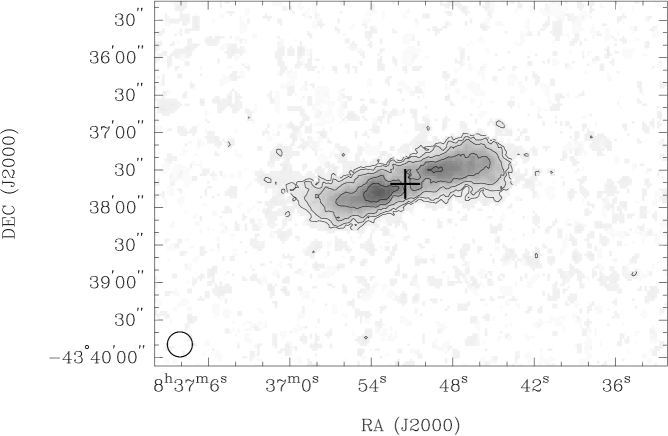
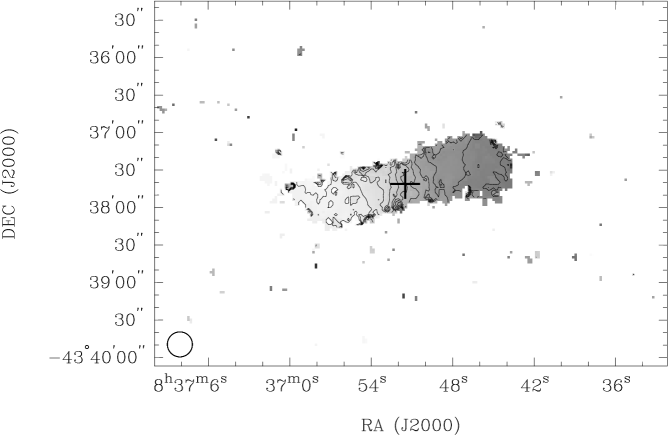
Various H i line data cubes were made to investigate the neutral hydrogen distribution and kinematics of the galaxy HIZOA J0836–43. The best results were obtained by using ‘natural’ weighting of the combined uv-data sets. Including all baselines resulted in an angular resolution of ; we used a restoring beam of 20″ and a channel width of 10 km s-1. By excluding the longest baselines (i.e. all baselines to antenna 6) we obtain an angular resolution of . We measure an rms per channel of 1.2 mJy beam-1 and 1.4 mJy beam-1, respectively. The resulting H i distribution and mean H i velocity field of HIZOA J0836–43 for both angular resolutions are shown in Fig. 2.
Radio continuum images were made using ‘robust’ (r = 0) and ‘uniform’ weighting of the combined uv-data, resulting in angular resolutions of and , respectively. The measured rms is 0.1 mJy beam-1. We find a continuum source at the position of HIZOA J0836–43 that is slightly extended along a position angle of = 125° and that has an integrated 20-cm flux density of 24 mJy.

3.1.1 Global HI properties
The global H i spectra of HIZOA J0836–43 (see Fig. 1) were analysed using the miriad program mbspect. Because the galaxy was unresolved in the Parkes H i data, its spectral profile was formed by weighting the flux according to the beam parameters. In the ATCA H i data, HIZOA J0836–43 is clearly resolved and consequently the spectral profile was taken to be the sum of the flux in a conservative box of , centred on the galaxy. For both the Parkes and ATCA H i data, first-order baselines were fit to the spectra and the total H i flux density was then determined by integrating over the galaxy profile.
The systemic velocity was taken to be the midpoint of the spectral profile at the 50% H i peak flux level. From a heliocentric velocity of = 10689 km s-1 ( = 0.036), we calculate a velocity in the Cosmic Microwave Background (CMB) frame of = 10928 km s-1, where the CMB vector was taken from Fixsen et al. (1996). Adopting a Hubble constant of = 75 km s-1 Mpc-1 and a cosmology with = 0.3 and = 0.7, we derive a cosmological luminosity distance of = 148 Mpc (see Table 2). At this distance, 1′ corresponds to 40.1 kpc.
The 20% and 50% velocity widths were measured using a width-maximizing technique. The measured H i properties for both observations are given in Table 1, where they are compared with equivalent measurements from HICAT (Meyer et al. 2004). For the remainder of the paper, we adopt the ATCA velocity widths of km s-1 and km s-1. Uncertainties in the integrated flux density and velocity measurements were derived using the formulas given in Koribalski et al. (2004).
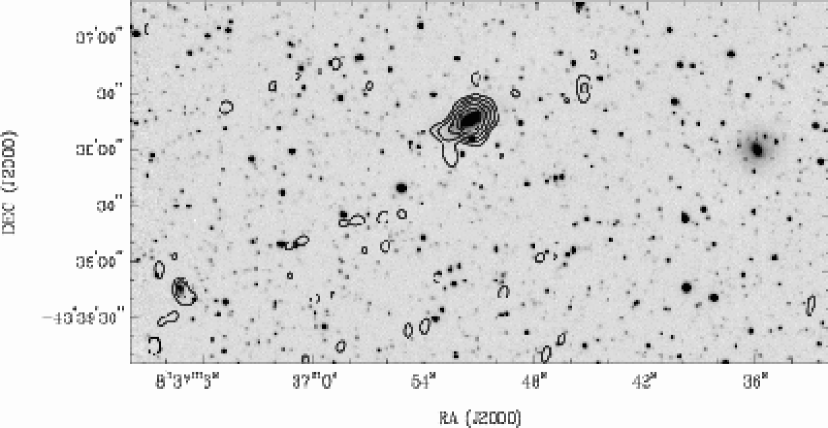
Fig. 3 shows the -band image obtained with the AAT (see §3.2 for further details) overlaid onto the H i distribution (upper panel) and continuum distribution (lower panel) as obtained from the high-resolution ATCA H i data cube. Both the H i and the 20 cm continuum measurements identify the galaxy 2MASX J08365157–4337407 as the counterpart to HIZOA J0836–43. The other two galaxies, 2MASX J08363600–4337556 and 2MASX J08370723–4339137, lie at distances of 28 and 32 from HIZOA J0836–43, respectively.
3.1.2 HI radial density profile
 |
 |
We measure the H i radial density profile from the H i total intensity map of HIZOA J0836–43, using the iterative method of Lucy (1974) as applied by Warmels (1988) and implemented in the program radial in the software package gipsy (van der Hulst et al. 1992). Because this method assumes that the H i has a planar and axisymmetric distribution, it is limited in its detection of structures such as spiral arms and warps. However, for highly-inclined galaxies observed with low angular resolution, such as HIZOA J0836–43, this method provides the most accurate means of measuring the surface density distribution. Another advantage of the Lucy method is that the surface density is measured directly; we need not assume a given model to which the data are fit. In addition, the density profile can be measured independently for the two sides of the galaxy.
The H i radial density profile for HIZOA J0836–43 as derived from the low resolution H i distribution (Fig. 2, left) is given in Fig. 4. The density profiles of both the approaching and receding sides of the galaxy are shown, as is the average distribution. The centre of the galaxy was taken to be the position of the radio continuum source (see Table 2). The radial density profile shows a central depression, and peaks at a surface density of 8.6 pc-2 and 9.1 pc-2 at radii of 25 kpc and 45 kpc, on the approaching and receding sides of the galaxy, respectively. The H i radius, measured at the position where the average radial density of the H i profile drops to 1 pc-2, is 66 kpc.
3.1.3 HI rotation curve

The H i rotation curve was measured using the envelope-tracing method (Sofue 1996, 1997), a method known to provide reliable rotation curves for highly inclined galaxies (Olling 1996). The rotation velocity is given by:
| (1) |
where is the velocity resolution and is the velocity dispersion of the interstellar gas. We adopt a velocity dispersion of 7 km s-1 (Stark & Brand 1989; Malhotra 1994). The terminal velocity, , is the velocity at which the intensity becomes:
| (2) |
where and are the maximum intensity and intensity levels, respectively.
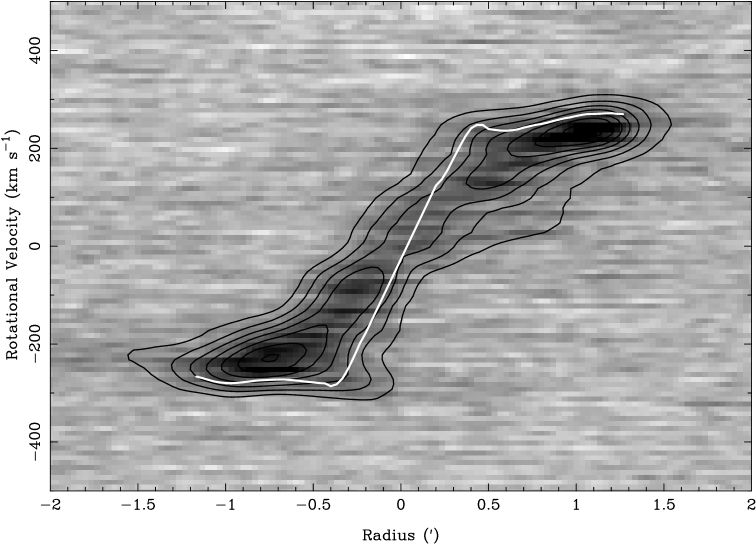
To measure , we first used the karma package kpvslice to create a position-velocity () diagram along the major axis of the galaxy (using = 285°), shown in Fig. 5. We then plotted as a function of velocity the intensity at a given radius along the major axis. Because of the relatively low S/N, we smoothed the profiles using a Savitzky-Golay smoothing filter with a width of 10 pixels (Press et al. 1992) before measuring and the velocity at which = . Fig. 6 illustrates the effect of this smoothing on two of the velocity profiles, as well as the resulting rotation velocity measured for each slice. After measuring the rotation velocity at each offset, we smoothed the rotation curve by the beam size. Because the image resolution limits the reliability of the central rotation curve derived using the envelope-tracing method (Sofue 1996), we excluded from our rotation curve measurement a central region equal to the beam diameter. We then connected the two sides of the curve with a line, although we caution that this shape is not necessarily representative of the true central rotation curve.
The inclination-corrected rotation curve is shown in Fig. 7; it is also overlaid onto the -diagram shown in Fig. 5. The rotation velocity reaches a local maximum at a radius of 15 kpc, drops slightly, and then rises to the inclination-corrected value of 304 km s-1, remaining relatively flat and symmetric out to a radius of 50 kpc. The rotation velocity is in close agreement with that implied by the inclination-corrected 50% velocity width (310 km s-1).
3.2 Infrared observations and photometry
The 4-m Anglo-Australian Telescope (AAT) was used to obtain - and -band images of HIZOA J0836–43 on 2003 April 9, with exposure times of 660 s and 420 s, respectively, and seeing. The final images were made by random dithering of 11 -band images and 7 -band images in a 30″ box. The positions were calibrated using the koords tool in Karma (Gooch 1996), with a DENIS (Epchtein 1997) image of the same field serving as the reference. The DENIS positions are accurate to better than 1″.
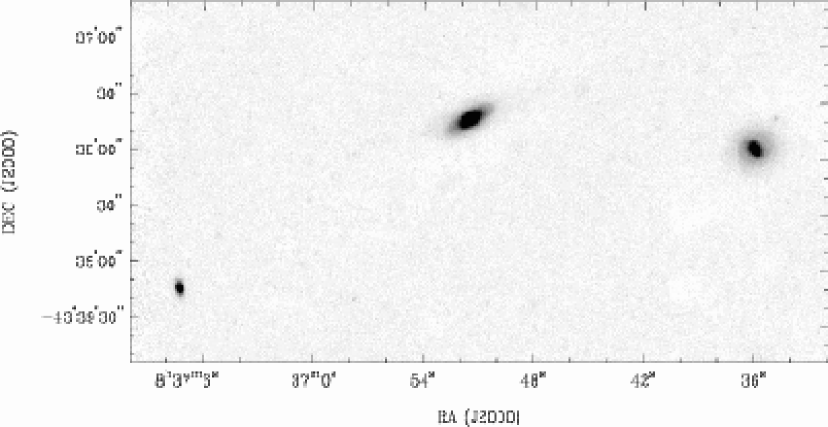
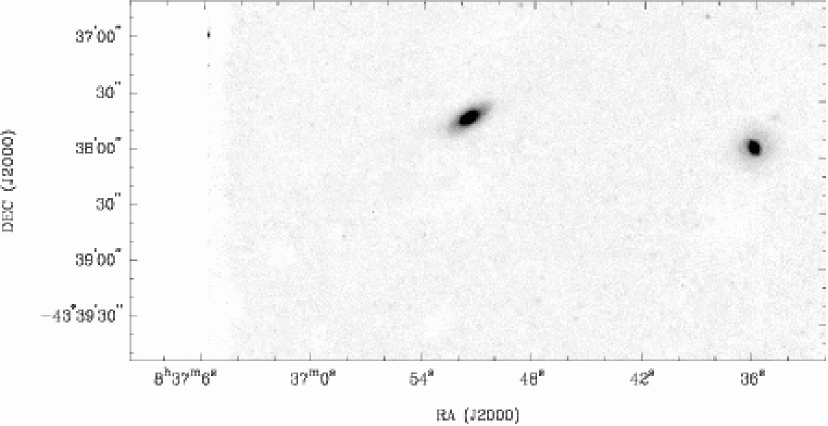
To obtain accurate photometry of the three galaxies in the crowded fields, we first measured and subtracted all of the stars in the field using the IRAF222IRAF is distributed by the National Optical Astronomy Observatories, which are operated by the Association of Universities for Research in Astronomy, Inc., under cooperative agreement with the National Science Foundation. package killall (see Woudt et al. 2005 for a detailed description). The resulting star-subtracted images are shown in Fig. 8 and Fig. 9. We then used the IRAF task ellipse to derive the integrated magnitudes for all three galaxies; they are shown in Fig. 10 and listed in Table 4 together with data from 2MASS and DENIS. We calibrated the AAT images by comparing the AAT point sources, measured as described above, with sources from the 2MASS Point Source Catalog333This publication makes use of data products from the Two Micron All Sky Survey, which is a joint project of the University of Massachusetts and the Infrared Processing and Analysis Center/California Institute of Technology, funded by the National Aeronautics and Space Administration and the National Science Foundation..
 |
 |
 |
 |
 |

The radial surface brightness profiles are shown in Fig. 11. As in Beijersbergen et al. (1999) and Galaz et al. (2002), we simultaneously fit the surface brightness data by two exponential profiles, taken to be the bulge and disk components of the galaxy:
| (3) |
The surface brightness profile parameters are given in Table 3. We used a geometric (multiplicative) step when measuring the surface brightness profile because such a step does not oversample the outer regions, where little flux is detected. Changing to a linear step gives more weight to the disk component and tends to brighten the disk central surface brightness by an average of 0.7 mag and decrease the disk scale height by 1″; the change in the bulge parameters is less significant. A linear step also changes the central extinction-corrected (-) colours of the bulge and the disk, from 0.41 and 0.50, to 0.44 and 0.34, respectively. When corrected for the inclination of the galaxy assuming no optical depth, the face-on central surface brightness of the disk and bulge components, log(cos), becomes fainter by 1 mag. This correction is almost exactly cancelled by the -band extinction correction.
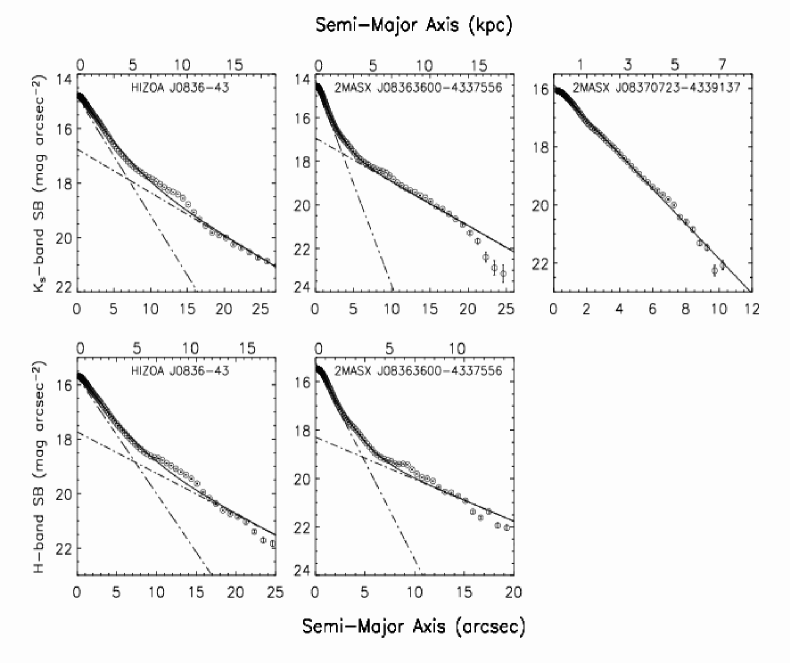
The bulge of HIZOA J0836–43 has a central observed surface brightness of = 14.81 (15.70) mag arcsec-2 in the - ( -) band images and a scale length of or 1.7 kpc. The disk of HIZOA J0836–43 has a central observed surface brightness of = 16.75 (17.74) mag arcsec-2 and a scale length of or 4.7 kpc. The bulge-to-disk ratio, , calculated from the surface brightness profile fits, is 0.80 (0.83) in the - ( -) band.
The integrated infrared magnitudes are given in Table 4, together with the infrared properties measured in 2MASS, and DENIS. The formal statistical error on all AAT magnitudes listed in Table 4 is 0.01 mag; this error does not include potential systematic errors introduced during image processing. The inclination of HIZOA J0836–43, measured from the surface brightness fits to the star-subtracted images, °, was calculated assuming an intermediate value of (see Haynes & Giovanelli 1984).
4 The Galaxy HIZOA J0836–43
The overall properties of the galaxy HIZOA J0836–43, derived from our H i and infrared data, are summarised in Table 2. Below, we discuss the H i and dynamical mass of HIZOA J0836–43, along with its star formation rate, morphology, NIR colours, location on the Tully-Fisher relation, and environment.
4.1 The H i and dynamical mass
The H i flux density of HIZOA J0836–43 as obtained from the Parkes HIZOA data is = Jy km s-1, similar to the value of Jy km s-1 measured with the ATCA in 750D array (see Table 1), suggesting that little (if any) H i emission was resolved out by the interferometer in this configuration. We adopt the ATCA value to estimate an H i mass of = 7.5 (0.3) . Assuming the other two galaxies in the field (see Figs. 3 and 8) lie at the same distance as HIZOA J0836–43, we estimate an upper limit to their individual H i masses of .
The H i diameter of HIZOA J0836–43 is at least 3′, corresponding to 120 kpc. Our analysis of the H i radial density profile indicates a face-on radius of 66 kpc, at a surface density of 1 pc-2. Using the H i radius and the inclination-corrected rotational velocity of = 304 km s-1, we derive a total enclosed dynamical mass of = . The ratio of H i mass to dynamical mass is 0.053.
4.2 Star formation rate
The 20-cm radio continuum data reveal a slightly extended source coincident with HIZOA J0836–43 (see Fig. 3). The source has a total flux density of 24 mJy, a deconvolved size of , and a major axis position angle of 120°. The centre position of the radio continuum source is (J2000) = 08:36:51.54, –34:37:41.5 (0.1″). Using the relation calibrated by Bell (2003), we calculate a star formation rate (SFR) of 35 yr-1. Assuming that , the gas consumption time, /SFR, for HIZOA J0836–43 is 3 Gyr and is therefore quite typical for spiral galaxies (Kennicutt et al. 1994).
The far-infrared (FIR) 60 µm flux density of HIZOA J0836–43 from the High Resolution Infrared Astronomical Satellite (IRAS) Atlas (Cao et al. 1997) confirms that star formation, and not AGN activity, is responsible for the radio continuum emission. Although HIZOA J0836–43 is clearly detected at 60 µm (and marginally detected at 100 µm), source confusion prevents measurement of an accurate flux. We instead place conservative upper and lower limits on the 60 µm flux density by summing the galaxy emission inside an elliptical aperture and subtracting both the low and high extremes of the local sky; we measure a 60 µm flux density of Jy.
From the FIR 60 µm flux density limits, the radio/infrared correlation for star-forming galaxies and radio-quiet AGN (Yun, Reddy, and Condon 2001) predicts radio luminosities that are a factor of 0.5 – 1.6 times that observed. The observed radio luminosity therefore exceeds the expected luminosity by at most a factor of 2, falling far below the factor of 5 required for ’radio-excess’ AGN (Yun et al. 2001, Drake et al. 2003), and confirming that the radio continuum emission is dominated by star formation.
While there is no sign of any radio continuum emission at the position of the galaxy 2MASX J08363600–4337556, west of HIZOA J0836–43, the smaller galaxy to the south-east of HIZOA J0836–43, 2MASX J08370723–4339137, is detected with a 20-cm flux density of 1 mJy (see bottom panel of Fig 3). The rms in the continuum image is 0.1 mJy beam-1.
4.3 Morphology and colours
The morphology of HIZOA J0836–43 remains a puzzle. The H i observations show a rapidly rotating, very gas-rich galaxy with — as seen in the previous section — a high star formation rate, indicative of an Sb or Sc galaxy (Roberts & Haynes 1994, Kennicutt 1992). In addition, the / ratio of HIZOA J0836–43 appears typical for Sb–Sc galaxies, but would be within the observed range of values for any galaxy type (Roberts & Haynes 1994). Visual examination of the AAT -band image of HIZOA J0836–43 (Fig. 3), however, and the analysis of its surface brightness profile (Fig. 11 and Table 3), reveal a distinct bright bulge (2 kpc) and an extended smooth disk (5 kpc) that can be traced along the major axis out to a radius of 13.4 kpc (at 20 mag arcsec-2). Comparison with the NIR Galaxy Morphology Atlas of Jarrett (2000) leads to the conclusion that HIZOA J0836–43, with its dominant bulge and smooth bulge-to-disk transition, is more likely to be a bright S0 to Sa galaxy than an Sb or Sc. NIR extinction from the Galactic Plane, however, is likely to obscure the disk, causing HIZOA J0836–43 to appear anomalously early in type. Using the NIR positions of HIZOA J0836–43 and its companions, we identify highly obscured optical counterparts in the DSS2 -band images, but the image resolution is insufficient to provide any details about their morphologies.
The extinction-corrected NIR colours of HIZOA J0836–43, presented in Table 5, are consistent with expectations for normal bright galaxies ( = 10, = 027, and = 073), but provide little morphological information as only late-type spirals (Sd – Sm) deviate from the overall mean (Huchra et al. 2000; Jarrett et al. 2003). The AAT values of and for HIZOA J0836–43 and its larger companion, 2MASX J08363600–4337556, lie on the high side of the range for normal 2MASS galaxies; the same colours determined from the 2MASS magnitudes lie on the low side ( and ). We use the 5″ colours instead of the total colours because the former are less likely to be affected by extinction and star-subtraction. The colour of the small galaxy, 2MASX J08370723–4339137, lies well above the mean, which might be indicative of a late type spiral. In addition, comparison of DENIS central and mean colours suggests that the total stellar populations of HIZOA J0836–43 and 2MASX J08363600–4337556 are bluer than that of the bulges that dominate the light within .
As shown by Jarrett et al. (2003), NIR effective surface brightnesses brighten with decreasing morphological type, . After extinction correction, the mean effective surface brightnesses listed in Table 2 suggest that HIZOA J0836–43 is of early type, in the range E (elliptical) to Sa, although the H and Ks surface brightnesses lie within the rms uncertainties for types as high as Sb. The face-on companion 2MASX J08363600–4337556 also seems of early type, in the range E to Sa, and the third small companion 2MASX J08370723–4339137 seems to be a spiral between Sab and Sc, in agreement with its S-shaped structure and the indication of star formation (see the bottom panel of Fig. 3).
As a final test of morphology, we compare the central surface brightness in the - and -band with the total magnitude. According to Jarrett (2000), SA0/S0 galaxies follow a linear relation of the form , and . Spiral galaxies of later type () follow the same slope but with an increasing offset towards fainter magnitudes with increasing , while ellipticals generally lie below this regression. The and the relations again suggests that the massive spiral galaxy HIZOA J0836–43 is an S0 (lenticular) or Sa galaxy. The larger companion, 2MASX J08363600–4337556, also seems of early type. For the small spiral-like galaxy, 2MASX J08370723–4339137, the test however, also indicates an early type which it clearly is not. This may be due to the fact that this galaxy is very small and hardly resolved; the above relation is valid only for well resolved galaxies.
The NIR morphology, colours, and magnitudes therefore indicate that HIZOA J0836–43 may be an S0 or Sa galaxy, although we caution that extinction is likely to obscure the disk, causing the bulge to dominate the photometry and therefore bias our results towards early morphological types. Given its enormous H i content, it may at first seem contradictory that HIZOA J0836–43 could be a lenticular galaxy. However, some lenticulars are known to contain a large amount of neutral gas. Such galaxies include low surface brightness lenticulars, of which the edge-on S0 galaxy NGC 5084 (Gottesman & Hawarden 1986) is a typical example (see also O’Neil et al. 2004), as well as high surface brightness lenticulars (Eder et al. 1991). For many S0 galaxies — in particular polar ring galaxies — the gas seems to be due to recent accretion events. Other H i-rich lenticulars (e.g., NGC 5084), however, have H i disks that are aligned with their optical counterparts as well as similar gas and stellar kinematics, suggesting that the H i is intrinsic in origin.
4.4 NIR Tully-Fisher relation
In order to test whether HIZOA J0836–43 lies on the Tully-Fisher relation, we compare our data to the NIR () Tully–Fisher relations as calibrated by Macri (2001). These relations, calibrated for both total and isophotal magnitudes (20 mag/arcsec2), exhibit slopes with small dispersions ().
We list in Table 6 the absolute magnitudes estimated from Macri’s Tully-Fisher relations (using the inclination-corrected 20% velocity width, ) and the extinction-corrected, absolute magnitudes obtained from AAT, 2MASS and DENIS photometry444The internal extinction was corrected according to Masters et al. (2003) using , with for , respectively, where is the major-to-minor axis ratio.. The offsets between the predicted and measured magnitudes, as well as the slopes and intercepts of the regressions , are also listed. For all bands, HIZOA J0836–43 lies on the NIR TF relation, never deviating by more than , suggestive of a normal galaxy at the extreme high-mass end of the NIR TF relation.
4.5 The environment
Does HIZOA J0836–43 form part of a cluster or a group that allowed it to grow to its current dimensions through the accretion of or merging with satellite galaxies, or does it reside in a low-density environment where it remained undisturbed by galaxy interactions? Unfortunately, the study of the environment of HIZOA J0836–43 is made difficult by its location behind the plane of the Milky Way and behind the Vela SNR. With optical extinctions of 10 magnitudes, the detection of even the intrinsically most luminous galaxies at the distance of HIZOA J0836–43 is nearly impossible. Although NIR surveys are less affected by extinction than optical surveys, they are hindered by confusion. Galaxy recognition fails completely in regions where the density of stars with surpasses , and HIZOA J0836–43 (with ) lies extremely close to this so-called “NIR Zone of Avoidance”(see Kraan-Korteweg 2005).
Nevertheless, we attempt to explore the environment of HIZOA J0836–43 by studying all extended sources in the 2MASX catalogue that lie within (1) a square degree around HIZOA J0836–43 and (2) within a circle of radius , the equivalent of an Abell radius at the distance of HIZOA J0836–43. With the exception of two small pockets of extreme dust, the extinction in this area ranges from to . Subtracting the latter from the nominal 2MASS completeness limit of (Jarrett 2000), we expect our extended source search to be complete to in extinction-corrected magnitude, ignoring confusion. To exclude Galactic sources from this sample, we visually inspect all 2MASX objects brighter than .
In the central square degree, there are 14 2MASX extended sources with . Of these, one was rejected, leaving 10 certain galaxies and 3 possible galaxies. The galaxy density of the studied region is therefore at least a factor of 5 higher than the mean density of 2MASS galaxies with and , 1.8 gal/ (Jarrett 2004; Jarrett 2005, priv. comm.), although the redshift of the overdensity remains undetermined. Within the Abell radius, 29 extended sources have ; of these, six were rejected, leaving 18 certain galaxies plus 5 possible galaxies. The resulting galaxy density in the Abell radius therefore also exceeds the mean, by a minimum factor of 2–3.
To investigate the effect of confusion on the overdensity, we repeated the study for completeness limits of and . The mean 2MASX densities (away from the Galactic Plane) are 0.85 and 0.43 gal/, respectively. Although the statistics are poorer, we find galaxy densities in the square degree around HIZOA J0836–43 of and gal/, respectively, indicating even higher overdensities than for the completeness limit. The overdensity within the Abell radius remains approximately the same. It therefore appears that HIZOA J0836–43 lies in an overdense region — at least projected on the sky — with the galaxy density increasing in the central square degree and becoming more prominent for the brightest objects.
Although we do not have redshifts for the individual 2MASS galaxies, we estimate the redshift of the deduced galaxy overdensity, and its relation to the redshift of HIZOA J0836–43, , by considering the large-scale structure of 2MASS galaxies in several photometric redshift intervals, as determined by Jarrett (2004). Prominent in the slice , but also visible in the slice, is a filamentary supercluster-like feature that crosses the Galactic Plane at the position of HIZOA J0836–43 and that points towards the Shapley concentration. This feature could explain the projected overdensity of galaxies around HIZOA J0836–43. In addition, a large fraction of the 2MASS galaxies seem to be of similar size and appearance as HIZOA J0836–43 (taking absorption effects into account), and are therefore likely to lie at similar redshifts.
Finally, we checked for H i-rich neighbours to HIZOA J0836–43 by observing a area around it with the Parkes multibeam system in 2004 November. The integration time was longer than for the deep Parkes H i ZOA survey, and longer than for HIPASS. The central velocity was set to 10 000 km s-1; the 64 MHz bandwidth give velocity coverage from 3300 km s-1 to 16 700 km s-1. A careful inspection of the deep H i data cube did not reveal any additional galaxies. Given an rms of 3 mJy, the 5 H i-mass limit for a detection at = 148 Mpc is (assuming a top-hat with a velocity width of 200 km s-1). Areas with strong continuum emission are adversely affected by a baseline ripple which increases the noise by a factor 2–3.
5 Comparison with other H i-massive galaxies
The four most H i-massive galaxies known are HIZOA J0836–43, UGC 4288 (O’Neil et al. 2004), UGC 1752 (Matthews et al. 2001), and, of course, Malin 1 (Bothun et al. 1987). The latter three are low-surface brightness (LSB) galaxies at luminosity distances of 433, 249 and 351 Mpc, respectively. Their H i properties are summarised in Table 7.
The galaxy UGC 4288 was classified as Sdm by Schombert & Bothun (1988) and as S0 by O’Neil et al. (2004). Optical images show a bright bulge and faint spiral structure, suggesting that UGC 4288 is likely to be of late type. The galaxy UGC 1752, which was classified as SAcd by de Vaucouleurs et al. (1991), looks remarkably similar to UGC 4288, suggesting the latter is also of late type. Malin 1 has a prominent bulge, with the properties of a bright elliptical galaxy, and a low-surface brightness disk that is barely detectable. The galaxy HIZOA J0836–43 is highly obscured in the optical and its morphological type is unknown. While our analysis of its NIR colours slightly favour an early-type morphology, extinction is likely to obscure the disk, causing the measurements to be dominated by the prominent bulge. The surface brightness analysis gives , a value slightly higher than that seen in LSBs (; Sprayberry et al. 1995), but roughly consistent with that of spiral galaxies (; Kent 1985). The extinction- and inclination-corrected central -band surface brightness of the disk (=16.9 mag arcsec-2) falls well short of the typical LSB cut, 18.0 mag arcsec-2, indicating that unlike the other H i-massive galaxies listed above, HIZOA J0836–43 is not an LSB galaxy.
The H i diameters of all four galaxies are huge: Malin 1 (25 or 220 kpc), UGC 1752 (2′ or 130 kpc), and HIZOA J0836–43 (3′ or 120 kpc). No H i diameter has been measured for UGC 4288 (yet) but its optical extent of 1′ (or 100 kpc) is likely to be a lower limit. All four galaxies also have high rotational velocities; while their inclination angles are rather uncertain (Malin 1: °, UGC 1752: °; UGC 4288 °; HIZOA J0836–43: °), we deduce rotational velocities of 200–300 km s-1 from the velocity width of their H i profiles (see Table 7). We note that UGC 4288, UGC 1752, and Malin 1 appear to lie in very low density environments. Their lack of tidal interactions may have played a role in preserving such large H i masses and diameters.
It therefore appears that the four H i-massive galaxies discussed above are similar in their extreme H i masses, large disks, and high rotational velocities. It is possible, however, that HIZOA J0836–43 differs from the others in its high SFR, high surface brightness disk, potentially overdense environment, and morphology. A more detailed comparison of these galaxies will follow in Koribalski et al. (in preparation).
6 Conclusions
HIZOA J0836–43 is a remarkable galaxy. Its enormous H i mass ( = 7.5 (0.3) ), large H i velocity width ( km s-1), and paucity of optical information due to its location in the Zone of Avoidance raises numerous questions about its environment, morphology and overall kinematics. ATCA H i observations reveal a very extended, highly-inclined H i disk (see Fig. 2) and a surprisingly regular velocity field. We measure an H i diameter of at least 3′ which corresponds to a physical size of 120 kpc. For comparison, the H i diameter of Malin 1, the largest disk galaxy known so far, is 220 kpc (Pickering et al. 1997, Matthews et al. 2001).
The H i distribution of HIZOA J0836–43 is slightly asymmetric (with more H i gas on the eastern side of the galaxy) and reveals a central depression. It also shows a gradually changing major axis position angle which decreases from in the inner region to nearly 270° in the outermost region. This change, which is most pronounced on the eastern side of the galaxy, is indicative of a gentle warp.
The H i velocities observed in HIZOA J0836–43 range from to 11000 km s-1, indicating an inclination-corrected rotation velocity of 304 km s-1 and consequently, a large dynamical mass and dark matter content. HIZOA J0836–43 falls on the NIR Tully-Fisher relationship, indicating that it is a normal rotating galaxy. We note that the equal velocity contours are nearly straight and do not resemble a typical spider diagram. A detailed analysis of the galaxy kinematics is limited by the relatively low angular resolution.
NIR data from the AAT indicate that HIZOA J0836–43 has a both a prominent bulge and an extended disk, and NIR colours point to an early type (S0-Sa) morphology, although colours from AAT, 2MASS, and DENIS may be dominated by the bulge component due to obscuration of the disk. The high star formation rate measured from the radio continuum and IRAS data, yr-1, suggests a later morphological type of Sb or Sc. A study of the local environment of HIZOA J0836–43, using sources from the 2MASX extended source catalogue, indicate that HIZOA J0836–43 may lie in an overdense region, possibly part of a supercluster-like filament.
There are currently very few galaxies known with H i masses of ; these are HIZOA J0836–43, UGC 1752, Malin 1, and UGC 4288 (in order of increasing distance; see Table 7). Accurate H i mass estimates can be difficult for such distant galaxies because of flux calibration uncertainties and low signal to noise. In addition, single-dish H i spectra are often fitted with multiple-order baselines which result in large flux uncertainties due to the very wide H i velocity profiles of these supermassive galaxies. We have obtained deep H i spectra of the LSB galaxies Malin 1 and UGC 4288 with the Parkes 64-m telescope and will report the results in Koribalski et al. (in preparation) together with a comprehensive comparison of the most H i-massive galaxies known from the literature. Constraining the number of massive galaxies in the Universe is necessary if we are to better understand the high-mass end of the galaxy mass and luminosity functions, and studying the properties of such galaxies provides a test of current galaxy formation scenarios in their most extreme limits.
Acknowledgments
We are grateful to Patrick Woudt for his help with the star-subtraction in the AAT - and -band images. We thank Stacy Mader for obtaining the sensitive Parkes H i data of the area around HIZOA J0836–43, and the referee, Greg Bothun, for helpful comments. This research has made use of the NASA/IPAC Infrared Science Archive (2MASS) and the NASA/IPAC Extragalactic Database (NED), which are operated by the Jet Propulsion Laboratory, California Institute of Technology, under contract with the National Aeronautics and Space Administration. RCKK thanks UCT, the SA National Research Foundation and CONACyT (research grant 40094F) for their support, and the Australian Telescope National Facility (ATNF, CSIRO) for their hospitality during her sabbatical. JLD performed most of this research while a Fulbright scholar at the ATNF.
References
- [] Barnes, D.G. et al., 2001, MNRAS, 322, 486
- [] Beijersbergen, M., de Blok, W.J.G., van der Hulst, J.M., 1999, A&A, 351, 903
- [] Bell, E.F., 2003, ApJ, 586, 794
- [] Blanton, M.R. et al., 2003, ApJ, 592, 819
- [] Bothun, G.D., Impey, C.D., Malin, D.F., Mould, J.R., 1987, AJ, 94, 23
- [] Cao, Y., Terebey, S., Prince, T.A., Beichman, C.A., 1997, ApJS, 111, 387
- [] Cole, S., Lacey, C.G., Baugh, C.M., Frenk, C.S., 2000, MNRAS, 319, 168
- [] Colina, L., Bohlin, R., 1997, AJ, 113, 1138
- [] Croton, D.J. et al., 2006, MNRAS, 365, 11
- [] Davies, J.I., Sabatini, S., Roberts, S., 2004, PASA, 21, 360
- [] Donley, J.L. et al., 2005, AJ, 129, 220
- [] Drake, C.L., McGregor, P.J., Dopita, M.A., van Breugel, W.J.M., 2003, AJ, 126, 2237
- [] Eder, J., Giovanelli, R., Haynes, M.P., 1991, AJ, 102, 572
- [] Epchtein, N., 1997, in Garzon, F. et al., eds, 2nd DENIS Euroconference, The impact of large scale near-infrared surveys. Dordrecht, Kluwer, 15
- [] Fixsen, D.J., Cheng, E.S., Gales, J.M., Mather, J.C., Shafer, R.A., Wright, E.L., 1996, ApJ, 473, 576
- [] Foerster Schreiber, N.M. et al., 2004, ApJ, 616, 40
- [] Galaz, G., Dalcanton, J.J., Infante, L., Treister, E., 2002, AJ, 124, 1360
- [] Gooch, R., 1996, in Jacoby, G.H., Barnes,J., eds, ASP Conf. Ser. Vol. 101, Astronomical Data Analysis Software and Systems V. Astron. Soc. Pac., San Francisco, p. 80
- [] Gottesman, S.T., Hawarden, T.G., 1986, MNRAS, 219, 759
- [] Haynes, M.P, Giovanelli, R., 1984, AJ, 89, 758
- [] Henning, P.A. et al., 2000, AJ, 119, 2686
- [] Henning, P.A., Kraan-Korteweg, R.C., Staveley-Smith, L., 2005, in Fairall, A.P., Woudt, P.A., eds, ASP Conf. Ser. Vol. 329, Nearby Large-Scale Structures and the Zone of Avoidance. Astron. Soc. Pac., San Francisco, p. 199
- [] Huchra, J.P., Mader, J., Schneider, S.E., Skrutskie, M.F., Jarrett, T.H., Chester, T., Cutri, R., 2000, in Kraan-Korteweg, R.C., Henning, P.A., Andernach, H., eds, ASP Conf. Ser. Vol. 218, Mapping the Hidden Universe. Astron. Soc. Pac., San Francisco, p. 101
- [] Impey, C.D., Bothun, G., 1989, ApJ, 341, 89
- [] Jarrett, T.H., 2000, PASP, 112, 1008
- [] Jarrett, T.H., 2004, PASA, 21, 396
- [] Jarrett, T.H., Chester, T., Cutri, R., Schneider, S., Skrutskie, M., Huchra, J.P., 2000, AJ, 119, 2498
- [] Jarrett, T.H., Chester, T., Cutri, R., Schneider, S.E., Huchra, J.P., 2003, AJ, 125, 525
- [] Kauffmann, G., White, S.D.M., Guiderdoni, B., 1993, MNRAS, 264, 201
- [] Kay, S.T., Pearce, F.R, Frenk, C.S., Jenkins, A., 2002, MNRAS, 330, 113
- [] Kennicutt, R.C., 1992, ApJ, 388, 310
- [] Kennicutt, R.C., Tamblyn, P., Congdon, C.E., 1994, ApJ, 435, 22
- [] Kent, S. M. 1985, ApJS, 59, 115
- [] Klypin, A., Nolthenius, R., Primack, J., 1997, ApJ, 474, 533
- [] Koribalski, B.S. et al., 2004, AJ, 128, 16
- [] Kraan-Korteweg, R.C., 2005, in Roeser, S., ed, Rev. in Modern Astrophysics Vol. 18, From Cosmological Structures to the Milky Way. p. 48
- [] Kraan-Korteweg, R.C., Staveley-Smith, L., Donley, J.L., Koribalski, B.S., Henning, P.A., 2004, in Colless, M., Staveley-Smith, L., Stathakis, R. eds, IAU Symp. 216, Maps of the Cosmos, Astron. Soc. Pac. San Franciso, p. 203
- [] Lucy, L.B., 1974, AJ, 79, 745
- [] Macri, L.M., 2001, PhD Thesis, Harvard University
- [] Malhotra, S. 1994, ApJ, 433, 687
- [] Masters, K.L., Giovanelli, R., Haynes, M.P., 2003, AJ, 126, 158
- [] Matthews, L.D., van Driel, W., Monnier-Ragaigne, D., 2001, A&A, 365, 1
- [] Meyer, M.J. et al., 2004, MNRAS, 350, 1195
- [] Norberg, P. et al., 2002, MNRAS, 336, 907
- [] Olling, R.P., 1996, AJ, 112, 457
- [] O’Neil, K., Bothun, G., van Driel, W., Monnier Ragaigne, D., 2004, A&A, 428, 823
- [] Pickering, T.E., Impey, C.D., van Gorkom, J.H., Bothun, G.D., 1997, AJ, 114, 1858
- [] Press, W.H., Schechter, P., 1974, ApJ, 187, 425
- [] Press, W.H., Teukolsky, S.A., Vetterling, W.T., Flannery, B.P., 1992, Numerical recipes in C : the art of scientific computing, 2nd edition. Cambridge University Press, Cambridge
- [] Roberts, M.S., Haynes, M.P., 1994, ARA&A, 32, 115
- [] Rosenberg, J.L., Schneider, S.E., 2002, ApJ, 567, 247
- [] Schechter, P., 1976, ApJ, 203, 297
- [] Schlegel, D.J., Finkbeiner, D.P., Davis, M., 1998, ApJ, 500, 525
- [] Schombert, J.M., Bothun, G.D., 1988, AJ, 95, 1389
- [] Sofue, Y., 1996, ApJ, 458, 120
- [] Sofue, Y., 1997, PASJ, 49, 17
- [] Sprayberry, D., Impey, C. D., Bothun, G. D., Irwin, M. J., 1995, AJ, 109, 558
- [] Springel, V. et al., 2005, Nature, 435, 629
- [] Stark, A.A., Brand, J., 1989, ApJ, 339, 763
- [] Staveley-Smith, L. et al., 1996, PASA, 13, 243
- [] van der Hulst, J.M., Terlouw, J.P., Begeman, K.G., Zwitser, W., Roelfsema, P.R., 1992, in Worall, D.M., Biemesderfer, C., Barnes, J., eds, ASP Conf. Ser. Vol. 25, Astronomical Data Analysis Software and Systems I. Astron. Soc. Pac., San Francisco, p. 131
- [] de Vaucouleurs, G., de Vaucouleurs, A., Corwin Jr., H.G., Buta, R.J., Paturel, G., Fouqué, P., 1991, Third Reference Catalogue of Bright Galaxies. Springer Verlag, New York
- [] Warmels, R.H., 1988, A&AS, 72, 427
- [] Wong, I., et al., 2005, MNRAS, submitted
- [] Woudt, P.A., Fairall, A.P., Kraan-Korteweg, R.C., Lucey, J., Schröder, A., Burstein, D., McCall, M.L., 2005, in Fairall, A.P., Woudt, P.A., eds, ASP Conf. Ser. Vol. 329, Nearby Large-Scale Structures and the Zone of Avoidance. Astron. Soc. Pac., San Francisco, p. 147
- [] Yun, M.S., Reddy, N.A., Condon, J.J., 2001, ApJ, 554, 803
- [] Zwaan, M.A. et al., 2003, AJ, 125, 2842
- [] Zwaan, M.A., Meyer, M.J., Staveley-Smith, L., Webster, R.L., 2005, MNRAS, 359, L30
| Observation | rms | H i flux density | Heliocentric | Velocity width | Reference | |
| velocity, | ||||||
| [mJy beam-1] | [Jy km s-1] | [ km s-1] | [ km s-1] | [ km s-1] | ||
| Parkes ZOA survey | 6 | here | ||||
| ATCA | 1.2 | here | ||||
| HIPASS | 13 | HICAT (Meyer et al. 2004) | ||||
| Property | Value | Notes |
|---|---|---|
| centre position, (J2000) | , –43°37′415 | (a) |
| heliocentric velocity, | km s-1 | (b) |
| CMB velocity, | km s-1 | |
| luminosity distance | 148 Mpc | (c) |
| H i flux density, | Jy km s-1 | (b) |
| H i mass, | (b) | |
| position angle, | (d) | |
| inclination angle, | (d) | |
| intrinsic rotation velocity, | 304 km s-1 | |
| H i radius (at 1 pc-2) | 66 kpc | (e) |
| total dynamical mass, | ||
| absolute magnitude, | –25.03 mag | (d,f,g) |
| infrared colour, | 0.43 | (d,f,g) |
| H i mass to light ratio, / | 0.35 / | (f,g) |
| H i mass to total mass ratio, / | 0.05 | |
| infrared radius, ( = 20 mag arcsec-2) | 13.4 kpc | (d,f) |
| bulge scale length | 1.7 kpc | (d) |
| disk scale length | 4.7 kpc | (d) |
| star formation rate (SFR) | 35 yr-1 | (a) |
| Bulge Parameters | Disk Parameters | |||||
|---|---|---|---|---|---|---|
| Source | Band | h | h | |||
| [mag arcsec-2] | [mag arcsec-2] | [′′] | [mag arcsec-2] | [′′] | ||
| HIZOA J0836–43 | 15.55 | 15.70 | 2.53 | 17.74 | 7.15 | |
| 14.65 | 14.81 | 2.48 | 16.75 | 6.79 | ||
| 2MASX J08363600–4337556 | 15.20 | 15.27 | 1.34 | 18.29 | 6.25 | |
| 14.27 | 14.37 | 1.16 | 16.93 | 5.40 | ||
| 2MASX J08370723–4339137 | 15.87 | 15.87 | 1.81 | |||
| Source | Band | Aλ | Telescope | r20 | reff | mtot | m20 | m(r5″) | SB(reff) |
| [mag] | [′′] | [′′] | [mag arcsec-2] | ||||||
| HIZOA J0836–43 | 4.40 | DENIS | 16.59 0.10 | ||||||
| 2.05 | 2MASS | 11.2 | 7.7 | 13.16 0.13 | 13.25 0.08 | 13.99 0.05 | 18.75 | ||
| DENIS | 13.17 0.04 | ||||||||
| 1.31 | AAT | 16.1 | 6.0 | 11.73 0.01 | 11.84 0.01 | 12.39 0.01 | 17.77 | ||
| 2MASS | 20.3 | 10.8 | 11.44 0.06 | 11.81 0.06 | 12.55 0.03 | 17.71 | |||
| 0.83 | AAT | 20.2 | 6.3 | 10.82 0.01 | 10.90 0.01 | 11.52 0.01 | 17.02 | ||
| 2MASS | 17.8 | 9.6 | 10.84 0.06 | 11.18 0.06 | 11.84 0.02 | 16.86 | |||
| DENIS | 11.02 0.10 | ||||||||
| 2MASX J08363600–4337556 | 4.27 | DENIS | 17.04 0.08 | ||||||
| 1.99 | 2MASS | 6.7 | 5.1 | 13.37 0.14 | 13.43 0.10 | 14.10 0.05 | 18.81 | ||
| DENIS | 13.63 0.03 | ||||||||
| 1.27 | AAT | 11.2 | 4.5 | 12.00 0.01 | 12.22 0.01 | 12.62 0.01 | 18.22 | ||
| 2MASS | 11.6 | 6.6 | 11.84 0.08 | 12.08 0.08 | 12.76 0.04 | 17.84 | |||
| Ks | 0.81 | AAT | 15.6 | 5.4 | 11.08 0.01 | 11.18 0.01 | 11.82 0.01 | 17.76 | |
| 2MASS | 13.9 | 6.0 | 11.31 0.08 | 11.45 0.08 | 12.15 0.03 | 17.06 | |||
| DENIS | 11.41 0.06 | ||||||||
| 2MASX J08370723–4339137 | 1.95 | 2MASS | 2.5 | 15.92 0.37 | 16.33 0.40 | 19.91 | |||
| 1.24 | 2MASS | 2.2 | 14.55 0.25 | 14.62 0.19 | 18.24 | ||||
| 0.79 | AAT | 7.3 | 2.7 | 13.13 0.01 | 13.24 0.01 | 13.29 0.01 | 17.50 | ||
| 2MASS | 5.4 | 3.0 | 13.51 0.22 | 13.71 0.14 | 13.77 0.14 | 17.89 |
| 2MASX | 2MASX | ||||||
| Colour | HIZOA J0836–43 | J08363600–4337556 | J08370723–4339137 | ||||
| AAT | 2MASS | DENIS | AAT | 2MASS | DENIS | 2MASS | |
| 1.07 | 1.13 | ||||||
| 0.64 | 0.76 | ||||||
| 2.00 | 2.17 | ||||||
| 1.50 | 1.49 | ||||||
| 1.10 | 0.93 | 0.88 | 1.04 | 1.25 | |||
| 0.93 | 0.87∗ | 0.77 | 0.72∗ | 1.40 | |||
| 0.43 | 0.12 | 0.46 | 0.07 | 0.59 | |||
| 0.39 | 0.23 | 0.34 | 0.15 | 0.40 | |||
| 0.98 | 0.81 | 0.66 | |||||
| 0.70 | 0.62 | 1.00 | |||||
| Mag | Intercepta | Slopea | Mλ(TF) | Mλ(phot) | (TF-phot) |
|---|---|---|---|---|---|
| 21.10 | 8.7 | 23.88 | 23.92 (DE) | +0.04 (DE) | |
| 22.40 | 10.0 | 25.60 | 25.52 (AAT) | 0.08 (AAT) | |
| 25.81 (2M) | +0.21 (2M) | ||||
| 22.66 | 9.9 | 25.82 | 26.04 (AAT) | +0.22 (AAT) | |
| 25.90 (2M) | +0.08 (2M) | ||||
| 25.72 (DE) | 0.10 (DE) | ||||
| 22.01 | 10.5 | 25.37 | 25.41 (AAT) | +0.04 (AAT) | |
| 25.44 (2M) | +0.07 (2M) | ||||
| 22.34 | 10.4 | 25.67 | 25.84 (AAT) | +0.17 (AAT) | |
| 25.56 (2M) | 0.11 (2M) |
| H i source | log | Ref., comments | |||||
| [ km s-1] | [Mpc] | Jy km s-1 | [] | ||||
| UGC 4288 | 30223 | 433 | 2.54 | 11.05 | 520 | 558 | 1, Arecibo |
| UGC 1752 | 17861 | 249 | 5.13 | 10.87 | 388 | 429 | 2, Nancay |
| HIZOA J0836–43 | 10689 | 148 | 14.5 | 10.87 | 566 | 610 | 3, ATCA image |
| Malin 1 | 24784 | 351 | 1.8 | 10.72 | 293 | 341 | 2, Nancay |
| ” | 24755 | ” | 2.5 | 10.86 | 322 | 4, VLA image | |
| ” | 24705 | ” | 2.7 | 10.89 | 295 | 355 | 5, Arecibo |
| ” | 24745 | ” | 4.6 | 11.13 | 315 | 340 | 6, NRAO 43-m |