Simulations of Cosmic Chemical Enrichment
Abstract
Using a new numerical model for cosmic chemical evolution, we study the influence of hypernova feedback on the star formation and metal enrichment history of the universe. For assumptions which produce plausible results in idealized collapse models of individual galaxies, our cosmological simulations of the standard CDM cosmology show a peak of the cosmic star formation rate at , with of the baryons turning into stars. We find that the majority of stars in present-day massive galaxies formed in much smaller galaxies at high redshifts, giving them a mean stellar age as old as Gyr, despite their late assembly times. The hypernova feedback drives galactic outflows efficiently in low mass galaxies, and these winds eject heavy elements into the intergalactic medium. The ejected baryon fraction is larger for less massive galaxies, correlates well with stellar metallicity, and amounts to of all baryons in total. The resulting enrichment history is broadly consistent with the observed abundances of Lyman break galaxies, of damped Lyman systems, and of the intergalactic medium. The metallicity of the cold gas in galaxies increases with galaxy mass, which is comparable to observations with a significant scatter. The stellar mass-metallicity relation of the observed galaxy population is well reproduced by the simulation model as a result of the mass-dependent galactic winds. However, star formation does not terminate in massive galaxies at late times in our model, and too few dwarf galaxies are still forming stars. These problems may be due to a lack of resolution, to inappropriate modelling of supernova feedback, or to a neglect of other feedback processes such as active galactic nuclei.
keywords:
methods: N-body simulations — galaxies: abundances — galaxies: evolution — galaxies: formation1 INTRODUCTION
While the evolution of the dark matter in the standard CDM cosmology is reasonably well understood, the evolution of the baryonic component is much less certain because of the complexity of the relevant physical processes, such as star formation and feedback. One approach to study the dynamics of baryons in galaxy formation is to use semi-analytic techniques (e.g., Kauffmann, White & Guiderdoni (1993); Cole et al. (1994)) that combine the growth of dark matter halos with simplified parameterizations of the baryonic physics. While this allows the construction of theoretical models for galaxy formation and chemical enrichment with a large dynamic range, the validity of the assumptions must be ultimately justified by observations and by more detailed theoretical work. We here adopt the other common approach to study galaxy formation, which is to use direct hydrodynamical simulations. Complementary to the semi-analytic models, they treat the dynamics of baryons in a much more detailed fashion.
Many simulation codes have been developed for studying galaxy formation and evolution, not only of isolated systems (e.g., Katz (1992), Mihos & Hernquist (1989), Steinmetz & Müller (1994), Nakasato & Nomoto (2003), Kawata & Gibson (2003), Kobayashi (2004)) but also for cosmological simulations of individual galaxies (e.g., Navarro & White (1994)) or of the galaxy population as a whole (Cen & Ostriker (1999), Springel & Hernquist (2003)). A robust result has been that with the commonly employed, schematic star formation criteria alone, i.e., converging gas flow, local Jeans instability, and short cooling times, the predicted star formation rates (SFRs) are higher than what is compatible with the observed luminosity density. Thus feedback mechanisms are in general invoked to reheat gas and suppress star formation. We include both supernova and hypernova feedback in our hydrodynamical model in this paper. Supernovae inject both thermal energy and heavy elements into the interstellar medium, and by means of supernovae-driven galactic winds, some of these metals can escape from galaxies into the intergalactic medium.
There is observational evidence for galactic winds in star forming galaxies both locally and at high redshifts (Heckman et al. (2000); Pettini et al. (2001); Martin, Kobulnicky & Heckman (2002); Mazzotta et al. (2002); Ohyama et al. (2002)). The existence of heavy elements in the intracluster medium (ICM) and intergalactic medium (IGM) also requires such an ejection mechanism. The mass-metallicity relation and also the color-magnitude relation of early-type galaxies have been explained as the the result of loss of heavy elements in galactic winds (e.g., Larson (1974), Arimoto & Yoshii (1987)). The relation between the iron mass in the ICM and the luminosity of early-type galaxies (Arnaud et al. (1992)) may also suggest metal ejection from early-type galaxies.
Since the presence of heavy elements can increase gas cooling substantially (Sutherland & Dopita (1993)), consistent simulations of galaxy formation must include a treatment of chemical enrichment as well as energy feedback. However, especially with respect to chemical enrichment, most existing hydrodynamical models are too simplistic to be compared in detail with the real Universe. There are only a few studies that simulate the detailed chemical enrichment by both Type II and Ia supernovae (SNe II and SNe Ia) (Raiteri, Villata & Navarro (1996), Carraro, Lia & Chiosi (1998), Mosconi et al. (2001), Nakasato & Nomoto (2003), Kawata & Gibson (2003), Tornatore et al. (2004), Kobayashi (2004)). Different types of supernovae produce different heavy elements on different timescales. Although the most abundant heavy element is oxygen which accounts for half of the solar metallicity, this element is hardly detected in observations of stars. Iron, which is another fundamental element observed in the damped Lyman (DLA) systems and the ICM, is mainly produced by SNe Ia. Recently, it has been confirmed that supernovae with ten times the standard kinetic energy exist and produce a certain amount of iron, not only by the observation of individual supernovae (e.g., Nomoto et al. (2002)) but also by the elemental abundance ratios of Milky Way stars (Kobayashi et al. (2006)). Even with the Salpeter initial mass function (IMF), three times more energy is ejected on average when such hypernovae (HNe) are included, which therefore increase the overall strength of supernova feedback substantially.
In the context of hierarchal galaxy formation, a number of important questions should be explained by simulation models, including (1) the existence of massive galaxies at high redshifts (e.g., Förster Schreiber et al. (2004)), (2) the old stellar populations of massive elliptical galaxies (e.g., Bower, Lucey & Ellis (1992)), (3) the “down-sizing” effect of star formation (e.g., Cowie et al. (1996), Kodama et al. (2004)), and (4) the number of spiral galaxies and the detailed morphological mix of galaxies. With our simulations, we can only address questions (2) and (3) because of limitations in volume and resolution. Note that while more massive halos tend to form at later times in hierarchal clustering, this does not necessarily imply that massive galaxies have younger stars than low-mass galaxies. This is because the present-day massive galaxies may have formed by the merging of smaller galaxies, i.e. the assembly time of these systems needs not to be the same as the formation time of their stars. To study this question, we will directly analyze when and where stars form in our simulations and we discuss the ages of stellar populations of massive galaxies formed in our models.
It is not clear that the IMF is universal, and simulations of the formation of Population III stars appear to suggest a flatter IMF or a lack of low-mass stars in low-metallicity environments (e.g., Bromm & Larson (2004)). This uncertainty means that the SFR and the stellar mass cannot be uniquely obtained from the observed luminosity. However, since a flatter IMF produces more heavy elements, the metal enrichment history of galaxies can put constraints on their star formation history and IMF. In fact, the observed weak chemical evolution of the IGM (Songaila (2001), Schaye et al. (2003)) and of DLA systems (Pettini et al. (1997), Prochaska et al. (2003)) may conflict with a flatter IMF. A detailed treatment of chemical enrichment is required in cosmological simulations. To this end we will analyze where and how heavy elements are produced and distributed in the gas phase and in stars, using a Salpeter IMF for definiteness.
In this paper, we simulate the evolution of gas and stellar systems from cosmological initial conditions, following chemical enrichment from SNe II, SNe Ia, and HNe. We use the GADGET-2 code by Springel (2005), in which we introduce metal-dependent cooling rates (Sutherland & Dopita (1993)) and the chemical enrichment model of Kobayashi (2004, hereafter K04). The feedback scheme is slightly modified from K04, as described in Section 2. In Section 3, as a test of our code, we simulate galactic winds from dwarf spiral galaxies and examine their parameter dependencies. Our cosmological simulations are described in Section 4, where we also discuss their predictions for the star formation history, galactic winds, and the chemical enrichment. Section 5 gives our conclusions.
2 Simulation Model
To construct a self-consistent three-dimensional chemodynamical model, we have introduced various physical processes associated with the formation and evolution of stellar systems into the parallel tree-SPH code GADGET-2 (Springel (2005), Springel, Yoshida & White (2000)), which is fully adaptive with individual smoothing lengths and timesteps and uses an entropy-conserving formulation of SPH (Springel & Hernquist (2002)). We include radiative cooling, and photo-heating by a uniform and evolving UV background radiation (Haardt & Madau (1996)). Star formation, feedback from Type II and Ia supernovae (SNe II and SNe Ia), stellar winds (SWs), and chemical enrichment are modelled as well, with an implementation that is close to the one in K04. In brief, the characteristics of this part of our code may be summarized as follows.
-
1.
Radiative cooling is computed using a metallicity-dependent cooling function. For primordial gas ([Fe/H] ), we compute the cooling rates using the two-body processes of H and He, and free-free emission, as in Katz, Weinberg & Hernquist (1996). For metal enriched gas ([Fe/H] ), we use a metallicity-dependent cooling function computed with the MAPPINGS III software (Sutherland & Dopita (1993)). In this cooling function, the elemental abundance ratios are set to be constant for given [Fe/H] according to the relations found in the solar neighbourhood. [O/Fe] for Galactic halo stars for [Fe/H] , and solar values for [Fe/H] . We interpolate between these values for [Fe/H] .
-
2.
Our star formation criteria are the same as in Katz (1992): (1) converging flow, ; (2) rapid cooling, ; and (3) Jeans unstable gas, . The star formation timescale is taken to be proportional to the dynamical timescale (), where is a star formation timescale parameter which we set to (Kobayashi (2005)). For every timestep , we draw a random number between 0 and 1, and provided it fulfils , a fractional part of the mass of the gas particle turns into a new star particle. The mass of the new star particle is given as with . Note that an individual star particle has a typical mass of , i.e. it does not represent a single star but an association of many stars. The masses of the stars associated with each star particle are distributed according to an initial mass function (IMF). We adopt a power-law IMF, (the slope gives the Salpeter IMF), which is assumed to be independent of time and metallicity. We limit the IMF to the mass range .
-
3.
We do not adopt the instantaneous recycling approximation when accounting for feedback. Instead, we treat star particles as evolving stellar populations which eject thermal energy , gas mass , and heavy elements from SWs, SNe II, and SNe Ia, as a function of time. The release of energy and heavy elements is distributed to a constant number of surrounding gas particles. We will show results for two cases: In our ‘SN feedback’ model, the SN II energy and yields are the same as adopted in K04. In the ‘HN feedback’ model, we assume instead a constant hypernova fraction for progenitor masses , and adopt the mass-energy relation; , , , erg for , , , (Kobayashi et al. (2006)). The ejected energy of each SW, SN II, and SN Ia are erg depending on metallicity, erg, and erg, respectively.
We distribute this feedback energy in purely thermal form, although a fraction of it could, in principle, be distributed in kinetic form as a velocity perturbation to the gas particles (see Navarro & White (1993)). The energy increase of a gas particle due to a star particle is calculated in each timestep as
(1) The feedback neighbour search needs to be done twice in order to ensure proper mass and energy conservation; first to compute the sum of weights for the normalization, and a second time for the actual distribution. Roughly speaking, since we assume constant , the energy increase per mass is almost constant and independent of resolution; . (Naively, the mass of gas particles are decreasing because of star formation.) The feedback radius that was assumed to be constant in the GRAPE-SPH code of K04 is now variable depending on the local gas density. With higher resolution, constant gives smaller feedback radius.
For the metals, the mass- and metallicity-dependent nucleosynthesis yields of SNe II and SNe Ia are taken from Kobayashi et al. (2006) and Nomoto et al. (1997b), respectively. The progenitor mass ranges of SWs and SNe II are and , respectively. For SNe Ia, we adopt the single degenerate scenario with the metallicity effect (Kobayashi et al. (1998), 2000), where the progenitors are Chandrasekhar white dwarfs (WDs) with an initial mass of , and the lifetimes are determined from the lifetimes of the secondary stars with and for the red-giant (RG) and main-sequence (MS) systems, respectively. The fractions of WDs that eventually produce SNe Ia are adjusted to match the chemical evolution constraints of the Milky Way Galaxy as [].
-
4.
The photometric evolution of a star particle is identical to the evolution of a simple stellar population. Spectra are taken from Kodama & Arimoto (1997) as a function of age and metallicity .
| Feedback | Z-cooling | |||||||||
| n | n | - | 0.27 | |||||||
| SN | n | 0.08 | 0.68 | 0.44 | -0.42 | -1.28 | ||||
| SN | y | 0.27 | 0.54 | 0.03 | -0.09 | -1.82 | ||||
| SN+HN | n | 0.02 | 0.58 | 0.60 | -1.52 | -1.70 | ||||
| SN+HN | y | 0.17 | 0.49 | 0.25 | -0.43 | -1.12 | ||||
| SN | y | 0.08 | 0.80 | 0.21 | -0.23 | -1.67 | ||||
| SN | y | 0.10 | 0.73 | 0.31 | -0.31 | -1.36 | ||||
| SN | y | 0.19 | 0.67 | 0.17 | -0.13 | -1.30 | ||||
| SN | y | 0.25 | 0.47 | 0.026 | -0.10 | -1.84 | ||||
| n | n | - | 0.59 | |||||||
| SN | n | 0.47 | 0.028 | 0.0003 | -0.08 | -2.22 | ||||
| SN | y | 0.52 | 0.011 | 0 | -0.02 | - |
3 ISOLATED DISKS
As a test of our code, we show the evolution of an isolated disk galaxy in a static dark matter potential. We construct an NFW-halo (Navarro, Frenk & White (1996)) with gas content in virial equilibrium for total masses of and . The initial angular momentum corresponds to a spin parameter and is distributed within the halo under the assumption that the specific angular momenta of spherical shells are all aligned (Bullock et al. (2001)). For the model, we work with a numerical resolution of , , and particles, corresponding to a gas particle mass of , , and , respectively. The adopted gravitational softening length is given in Table 1.
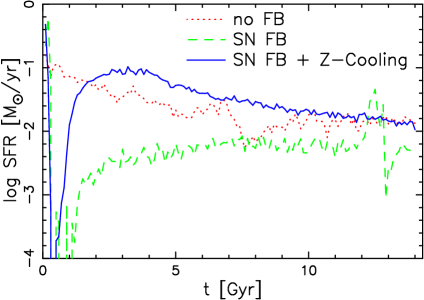
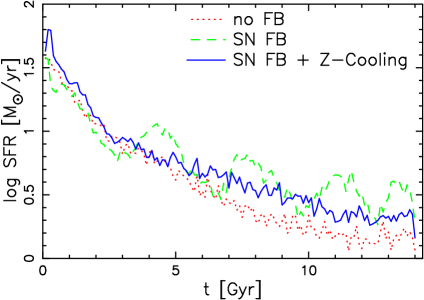
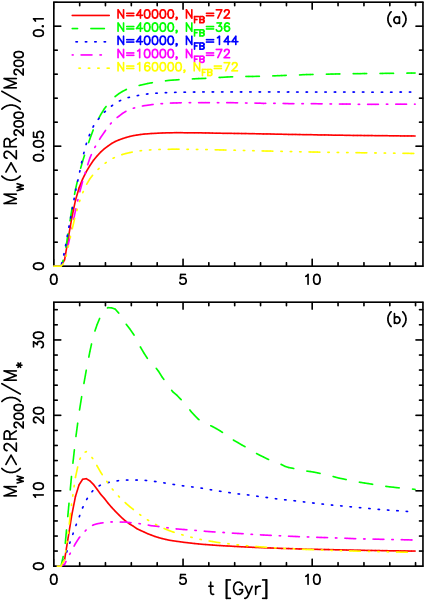
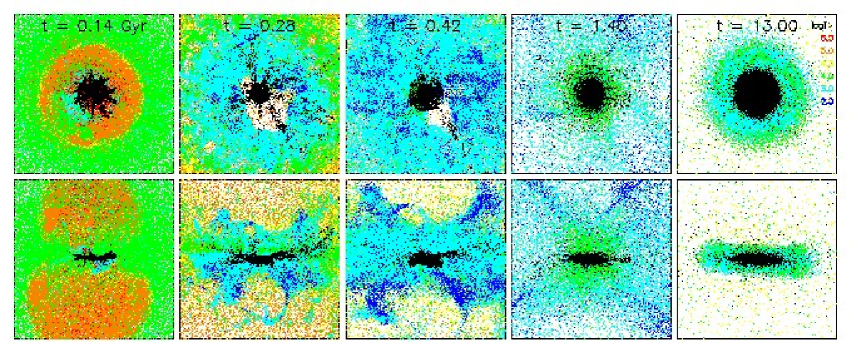
Figure 1 shows the time evolution of gas and star particles in the halo for the case with SN feedback ( resolution). After the start of the simulation, the gas is allowed to cool radiatively, making the gas in the centre of the halo quickly lose its pressure support such that it settles into a rotationally supported disk that grows from inside out. The rapid initial growth of the gas disk induces an initial starburst. Figure 2 compares the star formation rates (SFRs) for the models without feedback (dotted line), with feedback (dashed line), and with metal-dependent cooling (solid line). The SFR is peaked at Gyr with maxima of 0.25, 0.45, and 0.8 yr-1, respectively. Since the shortest lifetime of SNe II is yr, star formation is affected by the feedback during this phase. Although the adopted star formation scheme is different, our model without feedback is similar to that of Springel & Hernquist (2003). With metal-dependent cooling, star formation is more efficient with a twice larger peak SFR.
As soon as stars form in the centre, thermal energy of SNe II is injected into the inter-stellar medium. The energy from a star particle is isotropically distributed to the surrounding gas particles in our model. Because of the dense disk formed and the non-isotropic infall of gas, the low-density hot-gas region expands in a bipolar flow () as result of the energy input. In the disk plane, the hot gas region expands and forms a dense shell where stars keep on forming. The energy from these stars can quickly propagate to the surrounding low-density region. After the galactic wind forms (), the gas density becomes so low at the centre that star formation is terminated for a while. Because of radiative cooling, a part of the ejected gas however returns, again settling in the disk where it fuels new star formation. This secondary star formation is not as strong as the initial starburst, and takes place in a more continuous fashion. Although some small bubbles are forming in the galaxy in this stage, not much gas is ejected by them from the disk.
Supernovae eject not only thermal energy but also heavy elements into the interstellar medium. Since the cooling function depends strongly on metallicity, the star formation history is altered when metal-dependent cooling is accounted for. This is important especially for the secondary star formation when the gas has become enriched. Indeed, when metal-dependent cooling is included, the secondary star formation is much stronger than without it. Compared with the no feedback case, the final stellar mass decreases by a factor of if we include the feedback, but increases back to the original value if we add metal-dependent cooling as well. In Table 1, we summarize the properties of the galaxies in the different cases after a time of 13 Gyr.
For the massive halo with (the lower panel of Fig. 2), a galactic wind never occurs, and star formation takes place continuously. When we include feedback, the SFR shows repeated bursting behaviour. However, with metal-dependent cooling, star formation again takes place smoothly. This is because the enhancement of the star formation due to the existence of heavy elements is larger than the suppression by thermal feedback.
We note that these initial conditions are somewhat artificial since galaxies are not born as pure gas disks in reality. We adopt these initial conditions in order to explore the effects of feedback in a clear way, without having to deal with the complications of the hierarchical formation of galaxies. In reality, massive galaxies form through the merging of subgalaxies, and galactic winds can occur from the subgalaxies before merging. Weather the ejected materials fall onto the final galaxies or not is another issue, and should depend on the details of the merging histories. In Section 4, we will adopt more realistic initial conditions appropriate for cosmological simulations where the hierarchical formation is fully taken into account.
The strength of the galactic winds depends on i) the feedback parameter and ii) the numerical resolution. Figure 3 shows the time evolution of the wind mass normalized by the total mass (upper panel) and the stellar mass (lower panel) as a function of time. The wind particles are here defined as those gas particles that are outside . In our standard model, almost half of the gas is ejected by the wind (). In our feedback scheme, the feedback neighbour controls the ejected energy from one star particle to one gas particle. Once the gas particles are heated to K where the cooling rate becomes low, they can avoid rapid cooling. Therefore, the feedback effect becomes stronger with smaller . With , the wind mass increases to give , and the wind efficiency normalized by the stellar mass is times larger than for the case. On the other hand, with , the distributed energy is too low to generate a galactic wind. In addition, a large value of corresponds to a very large feedback radius ( kpc in these simulations), which causes unrealistically large mixing of gas.
A comparable amount of heavy elements can be ejected by the wind with the feedback. However, with the metal-dependent cooling, the ejected metal fraction relative to the total amount of metals produced is as small as a few percent for the SN feedback case. For the case with HNe, the ejected metal fraction is as large as . This is because more metals are ejected with more energy, and enriched gas can be heated enough to prevent rapid cooling. In this case, the wind metallicity is while the stellar metallicity is (see Table 1).
In principle, our feedback scheme does not depend on numerical resolution because the ejected energy per unit mass from star particles is always the same. However, the star formation criteria may introduce some resolution dependence. In our disk formation simulations, the feedback efficiency depends on the strength of the initial star burst. We find that the SFR during the initial starburst is smaller with than . This is because the Jeans instability criterion is not as easily satisfied in high resolution simulations with smaller smoothing length. is too small to simulate the galactic wind properly. As a result, the wind mass decreases with higher resolution. However, when we normalized the wind mass by the stellar mass, the present wind efficiency is the same.
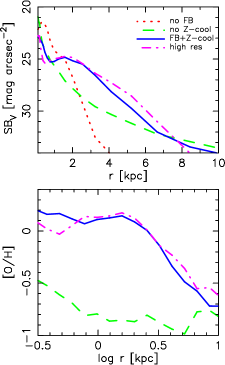
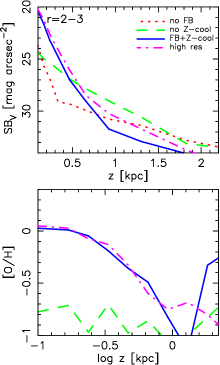
The feedback also affects the structure of the stellar disk. In Figure 4, we show the surface brightness profiles of the stars in the halo as functions of the projected radius (left panels) and the height at kpc (right panels). Without feedback (dotted line), the disk is small and thin with scale lengths of and , respectively. With feedback and metal-dependent cooling (solid line), the disk size becomes larger (), while the thickness does not change (). At late times, star formation takes place mainly in the outer regions ( kpc) in this case. Thus the surface brightness profile shows a bump around kpc. Strong metallicity gradients are seen at and . Without metal-dependent cooling (long-dashed line), the disk size is smaller and the thickness is larger. In this case, star formation takes place in the centre at later times, and no metallicity gradient is formed. Numerical resolution does not affect these results (dot-dashed line).
4 Cosmological simulations
We focus on a CDM cosmological model with parameters , , , , , and . The initial conditions are set up in a cubic box with periodic boundary conditions, employing an equal number of dark matter and gas particles. We work with two different resolutions; and . The mass of a dark matter particle is and and the mass of a gas particle is and for these two resolution, respectively. The adopted gravitational softening lengths are given in Table 2. For gas particles we adopt half the value adopted for dark matter. With several low-resolution simulations we examine dependencies on our two most important model parameters, the feedback neighbour number and the star formation timescale .
In order to identify galaxies, we apply the same method as Springel & Hernquist (2003b). A friend-of-friends (FOF) group-finding algorithm is applied to the dark matter particles, using a fixed comoving linking length equal to times the mean inter-particle spacing of the dark matter particles. Then gas and star particles are associated with the nearest dark matter particles. We discard all groups with fewer than dark matter particles. The intergalactic medium is coarsely defined as the particles that do not belong to any identified halo. We note that our results are insensitive to the detailed parameters of the FOF group finding methods.
Because of practical limitations with respect to the available computational time, the box size of our simulations is quite limited. Thus very massive galaxies and galaxy clusters forming at low redshift are not included and the large-scale structure on the scale of the box-size is affected by non-linear evolution below . As a result, the simulated cosmic SFR in Figure 8 at is probably an underestimate of the cosmic mean expected for a larger simulation volume. However, the evolution of individual galaxies is expected to be less affected by the finite box size. In particular, the mass-metallicity relation (Figs. 19 and 20) and the wind-mass relation (Fig. 16) should be quite robust for low and intermediate-mass galaxies, even though very massive galaxies are not included.
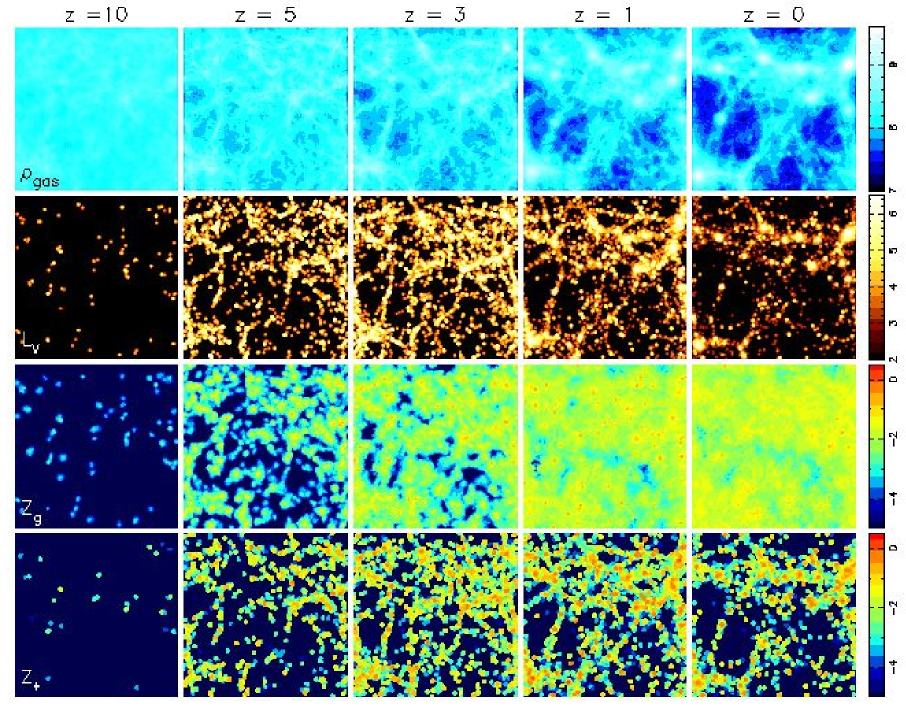
Figure 5 shows the time evolution of the densities of gas, stellar V-band luminosity, gas metallicity, and stellar metallicity for the high resolution simulation () in our box. Star formation takes place in a distributed fashion at high redshifts, and becomes most active around . The distribution of stars appears smooth at high redshifts, but concentrated at lower redshifts. Because of the feedback, massive galaxies are surrounded by hot gas, and heavy elements are also distributed in the intergalactic medium. Both in the gas phase and stars, metallicity gradients are generated in high density regions.
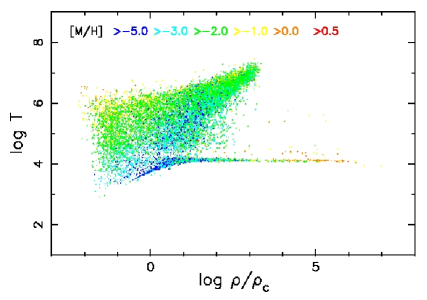
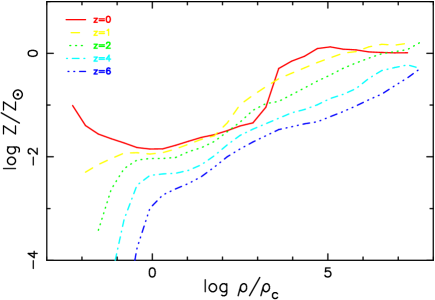
Figure 6 shows the density-temperature diagram at , representing metallicities with colours. Metal-rich gas particles populate mainly the cold dense region, with a few particles found in the hot, low-density region. We note that one-tenth of particles are randomly chosen and plotted in this diagram, and the statistics of the low-density cold gas is much better. Figure 7 shows that the relation that the gas metallicity is higher for high density is present at all redshifts. This is also responsible for generating the radial metallicity gradients in galaxies both for gas and for stars.
| Feedback | Z-cooling | Size | [Fe/H]∗ | [O/H]∗ | |||||||||
| n | n | 10 | - | 0.242 | - | - | - | - | |||||
| SN | n | 10 | 0.109 | 0.034 | 0.79 | -0.02 | 0.01 | 0.11 | 0.07 | ||||
| SN | y | 10 | 0.158 | 0.026 | 0.94 | 0.09 | 0.08 | 0.12 | 0.03 | ||||
| SN+HN | n | 10 | 0.079 | 0.019 | 0.66 | -0.14 | -0.14 | 0.12 | 0.04 | ||||
| SN+HN | y | 10 | 0.093 | 0.013 | 0.75 | -0.06 | -0.08 | 0.14 | 0.05 | ||||
| SN+HN | y | 10 | 0.100 | 0.015 | 0.75 | -0.06 | -0.08 | ||||||
| SN+HN | y | 10 | 0.152 | 0.027 | 0.74 | -0.09 | -0.09 | ||||||
| SN+HN | y | 10 | 0.138 | 0.014 | 0.79 | -0.03 | -0.06 | 0.15 | 0.03 | ||||
| SN+HN | y | 10 | 0.078 | 0.021 | 0.62 | -0.15 | -0.16 | 0.18 | 0.14 | ||||
| SN+HN | y | 10 | 0.091 | 0.029 | 0.56 | -0.20 | -0.21 | ||||||
| SN+HN | y | 20 | 0.102 | 0.012 | 0.75 | -0.07 | -0.09 |
4.1 Model Comparison
In Figure 8a, we show how feedback and metal-dependent cooling affect the cosmic star formation history. The cosmic SFRs that are directly measured from the ages of stellar particles for the low resolution simulations (). Supernova feedback (dot-dashed line) decreases the SFR from , and the SFR is smaller by factor of at than in the no feedback case (dotted line). However, metal-dependent cooling (long-dashed line) increases the SFR back to the no feedback case. For comparison, Figure 8a also shows observational estimates of the cosmic SFR density at different epochs. Note that these determinations are derived from the observed luminosity densities (e.g., Madau et al. (1996)), and this involves uncertainties from dust extinction and completeness, as well as from the IMF. Rest-frame UV observations are plotted with dust correction with a factor of for and for (Steidel et al. (1999), Reddy & Steidel (2004)), and dust corrected H measurements are taken from Schiminovich et al. (2005).
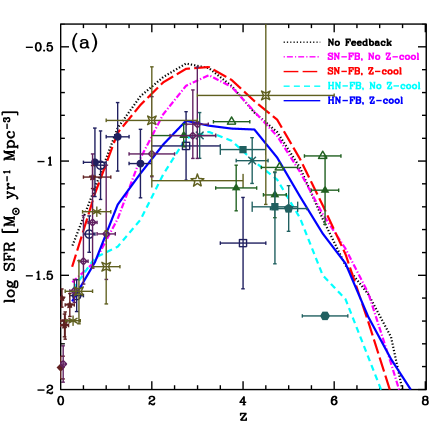
If we include hypernova feedback (dashed line), the SFR starts to be suppressed from onwards, and is overall smaller by a factor of at . The resulting SFR is in broad agreement with the observations that show a peak of at . Since a hypernova releases ten times more energy than an ordinary supernova, the distributed energy in one timestep ( yr) is as large as erg, and the temperature increase of individual gas particles reaches K. Once gas particles are heated to this temperature, the gas particles do not cool rapidly due to the comparatively low cooling rate at this temperature. This reduces not only the SFR but also the metal production rate, even though the ejected metal mass from a single HN is larger than from a SN. The redshift where the mean gas [Fe/H] reaches is for the SN feedback, but is delayed to for the HN feedback. Since the metallicity dependence of the cooling rate clearly appears for [Fe/H] , metal-dependent cooling does not play such a prominent role in the HN feedback case, and enriched gas can remain hot without forming stars.
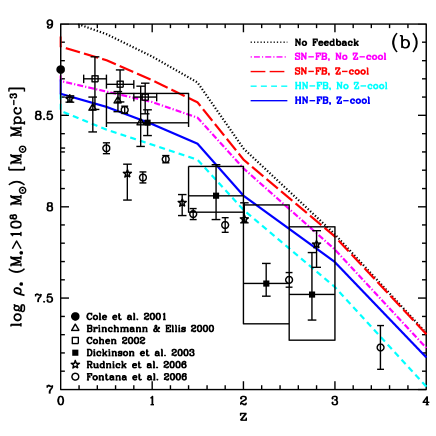
In Figure 8b, we show the time evolution of the stellar mass density. To avoid uncertainties in the completeness from the faint end, we measure the stellar mass in the galaxies with , as in Fontana et al. (2006). The HN feedback improves the agreement with these observations. The luminosity-limited observations (Rudnick et al. (2003, 2006)) are also reproduced with the luminosity-limited measurements in our simulations.
The present stellar fraction (relative to total baryon density) and mean metallicities are tabulated in Table 2. Without feedback, of baryons turn into stars, which is too large compared with observational estimates (e.g., Fukugita & Peebles (2004)). With SN feedback, the stellar fraction reduces to , which may be consistent with observation. Recently, the observational estimate has been reduced to less than (Fukugita & Peebles (2004)), which may require larger feedback. The larger energy ejection by HNe could provide a solution. The present mean gas metallicity is [Fe/H] for SN feedback, and is reduced to for HN feedback. The mean stellar metallicity is almost solar for the SN feedback, and becomes sub-solar for the HN feedback.
The feedback parameter does only weakly influence the cosmic SFRs. With , the SFR increases by a factor of , which is in the opposite sense from the isolated disk case (Section 3). With the resolution of our cosmological simulations, the ejected energy from one star particle is large, and smaller results in weaker feedback due to a smaller feedback radius. For the higher resolution, because more small dense regions are resolved, the SFRs at become much larger and the SFR at increases by a factor of . To obtain similar feedback radius, we adopt for the case, which gives a similar peak SFR and stellar fraction to the low resolution case.
We now discuss the dependence of our results on the star formation timescale parameter . In the one-zone model, the star formation timescale directly affects the star formation history, and it may be imagined that a smaller can easily suppress the SFR. However, in our chemodynamical model, the influence of is more subtle than that. With a smaller value for , say , the peak redshift of the SFR is shifted towards lower redshift () and the present SFR density is enlarged (), but the total amount of stars is not reduced in any significant way. The reason is that if we prevent the gas from forming stars at some early epoch, this will only delay the transformation of cold gas into stars, but the amount of gas that cools and becomes available for star formation is not changed. If we pick a value as large as , the initial star burst is so large that the SFR continuously decreases from . Comparing with the observed cosmic SFRs, we therefore adopt , which roughly reproduces the observed shape of the cosmic SFR history, keeping in mind however that the latter is still quite uncertain due to dust extinction, for example. If the SFR at is as low as the UV observations without a dust correction suggest, and if the SFR at is as high as the IR observations with the dust correction suggest, then a value for as small as may be allowed. We also note that the parameter changes the size of galaxies, and it can hence be constrained by comparing simulation results with the observed scaling relations of galaxies (see Kobayashi (2005) for the detail).
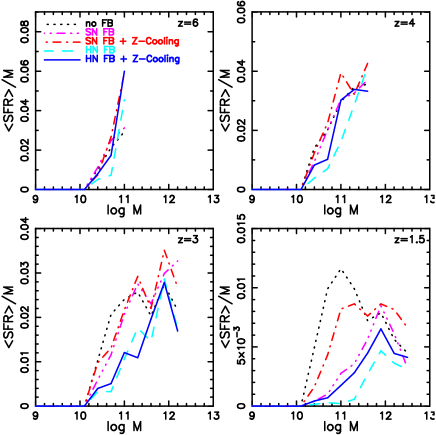
To investigate where the SFR is suppressed with HN feedback, we show the average SFRs at given total mass in Figure 8. At , the SFRs in massive galaxies are enhanced with the metal-dependent cooling (dot-dashed and solid lines). After , the SFRs in low mass galaxies are suppressed by SN feedback (dot-dashed and dashed-dot-dot-dotted lines), but are unaffected in massive galaxies. If we include HN feedback (solid and dashed lines), the SFRs are smaller for all galaxies, independent of metal-dependent cooling. The stellar mass of the most massive galaxies are not altered significantly (, , , , respectively for the models in the label). However, the number of galaxies with decreases by a factor of , and the number of dwarf galaxies with increases by a factor of .
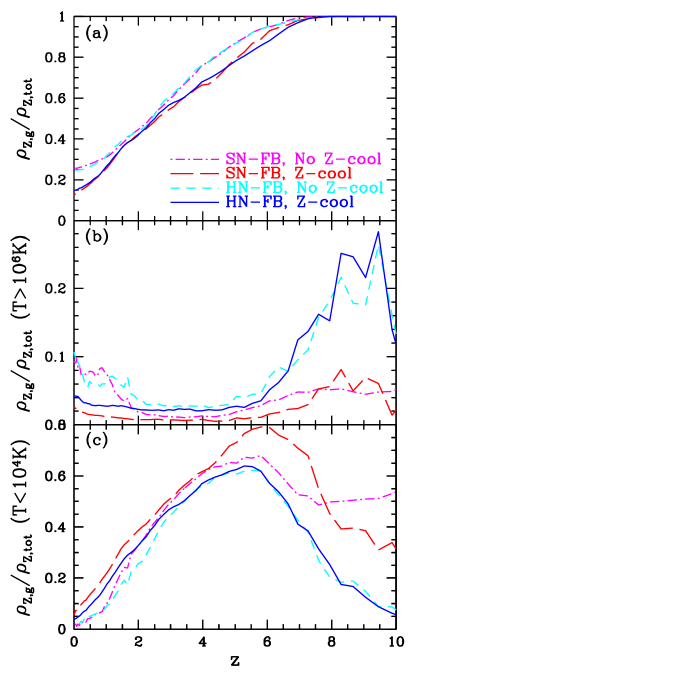
The feedback and the metal-dependent cooling affect the distributions of heavy elements. Figure 10 shows the redshift evolution of the metal fraction, normalized by the total projected metals, in all gas, in hot gas ( K), and in cold ( K) gas. Because of star formation, the metal fraction increases in stars (panel a) and decreases in gas towards lower redshifts. At the beginning, metals are ejected into hot gas (panel b), which eventually cools and increases the metal fraction in cold gas toward (panel c). From onward, the metal fraction in cold gas decreases due to star formation. At , almost half of all metals are in stars. With the metal-dependent cooling (long-dashed and solid lines), more metals are locked into stars than is the case without it (dot-dashed and short-dashed lines). With HN feedback (short-dashed and solid lines), two times more metals exist in gas, more in hot gas and less in cold gas. This metal fraction in hot gas, however, is still smaller than expected from observations of the X-ray gas in clusters (larger than two-thirds, Renzini (2002)). Davé & Oppenheimer (2006) showed the increase of the metal fraction in hot gas toward low-redshifts using a hydrodynamical model with a momentum driven wind. Such increase is not seen in our simulations with metal-dependent cooling.
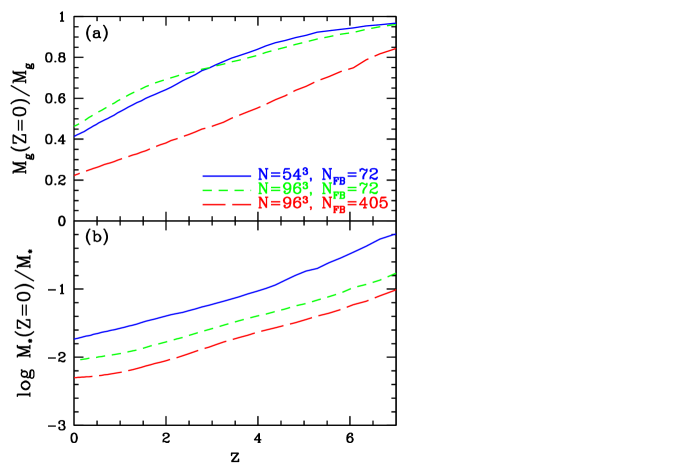
Figure 11 shows the redshift evolution of the fractions of metal-free gas and metal-free stars. In our model with HN feedback and metal-dependent cooling (solid line), half of the gas remains pristine until , and gas is still metal-free at (panel a). The fraction of metal free stars is as large as at and decreases to at (panel b). Higher resolution (short-dashed line) gives almost the same fraction of metal-free gas. However, the amount of metal-free gas strongly depends on the number of feedback neighbours in our model. A larger value for gives a smaller fraction of metal-free gas (long-dashed line). We should note that we do not include an explicit mixing of metals between neighbouring gas particles. Gas particles are enriched only when they pass near dying star particles in our model. Although an additional mixing effect could increase the enriched fraction of gas, we note that the region enriched by a supernova is already large in our simulation model.

4.2 Star Formation, galactic winds, and chemical enrichment
In the following, we discuss in more detail the results of the higher resolution simulation () with HN feedback and metal-dependent cooling. Figure 12 shows V-band images for our galaxies identified by the FOF algorithm at . The most massive galaxy shown (upper left panel) is a merging system, with the total mass and the stellar mass . The others illustrate the typical morphologies of our simulated galaxies with , and , and , and , respectively.
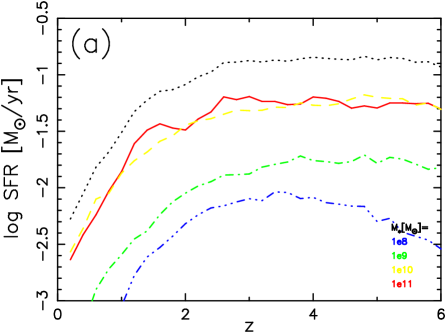
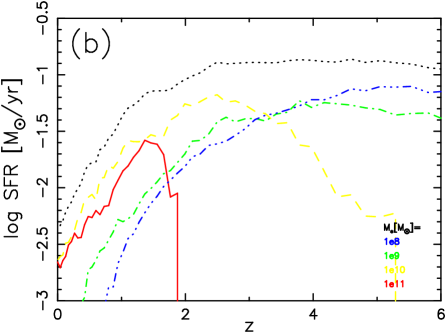
When and where do stars form? To answer this question, we break up the cosmic SFR history according to galaxy mass. In Figure 13, we show the SFR history of systems with final stellar masses of (solid line), (dashed line), (dot-dashed line), and (dot-dot-dot-dashed line). The dotted line shows the total, corresponding to the galaxies in this simulation. The galaxies have been identified by FOF at for this plot, and thus these SFRs correspond to the age distribution of stars in the galaxies. For all galaxy masses, the SFRs show a peak around , and the majority of stars are as old as Gyr. On the other hand, in Figure 14, we identify galaxies at each redshift and split up the SFRs according to the current stellar mass measured at the redshift, which are comparable to the observations of high redshift galaxies. This shows that most stars have formed in low-mass galaxies with at high redshift . galaxies exist at high redshift , but galaxies appear only after . From these two figures we conclude that most stars have formed in dwarf galaxies before they merge to massive galaxies in our simulation. As a result of the hierarchical clustering of dark matter halos, such old stars belong to massive galaxies at low redshifts.
If we consider luminosity-weighted ages, the largest galaxies need not always be the oldest if young stars keep on forming in them. At the present epoch, we find no relation between the luminosity-weighted ages and the stellar mass of the galaxies, and most galaxies are as old as . Large galaxies with tend to have young ages as Gyr in our model. In these galaxies, feedback from active galactic nuclei (AGN) may stop recent star formation. For dwarf galaxies, the ages span a wide range of Gyr, and there exist two populations, young and old dwarfs that correspond to the observed dwarf irregulars and spheroidals, respectively. However, the number of young dwarfs seems to be too small compared with observations (e.g., Kauffmann et al. (2003)), and the so-called ‘down-sizing’ effect of cosmic star formation is not clearly seen in our simulations. This is because i) star formation is not terminated in massive galaxies, presumably due to the lack of efficient feedback and ii) not enough young dwarfs are forming at . AGN feedback (e.g., Di Matteo, Springel, & Hernquist (2005), Croton et al. (2006)) may solve the former problem, but not the latter.
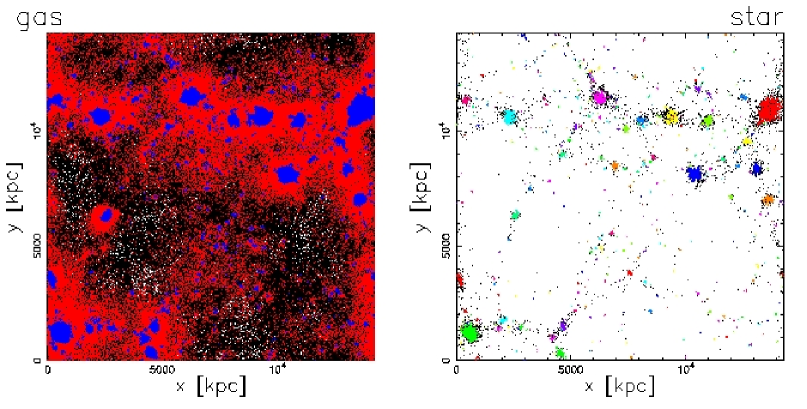

How are heavy elements ejected from galaxies to the IGM? In the simulation, we can trace the orbit of gas particles over time. Exploiting this, we define as wind particles those that are not in galaxies now, but have been in galaxies before. Figure 15 shows the spatial distributions of this ‘wind gas’. The blue and red points mark the positions of gas particles in galaxies and of gas in the wind, respectively. The corresponding distribution of star particles is shown in the right panel. The wind particles surround the stars in galaxies, but do not extend very far from them. In this simulation, of baryons turn into stars, of the gas stays in galaxies ( is hot), and is ejected as galactic winds (see Table 2 for the other models). The rest, half of the baryons, never accretes onto galaxies.
When we follow the orbits of gas particles, we can also examine from which galaxies the wind gas particles are ejected. This allows a measurement of the ejected wind mass from each galaxy. It is possible that a wind gas particle is ejected from two different galaxies (at different times), in which case we count it for both galaxies. But if a wind gas particle should be ejected twice from the same galaxy, it is only counted once. In Figure 16, we plot the wind fraction, i.e. the ratio between the total wind mass to the total accreted baryon mass, against the total mass. Here we plot only galaxies with because of the limited resolution. Massive galaxies are dominated by baryons (), but the baryon fraction is smaller for lower-mass galaxies (panel a), which implies that baryons are more efficiently ejected from them. Most of the gas in our massive galaxies is in the hot phase. Therefore, the difference in the baryon fraction does not conflict with the observed baryonic Tully-Fisher relation (McGaugh (2005); Pfenniger & Revaz (2005)), as we explicitly show in Figure 17.
A clear relation is found between the wind fraction and the total mass (panel b). Winds are efficiently ejected from small galaxies, with of accreted baryons being ejected from galaxies. A similar relation is also found for the ejected metal fraction, i.e. the ratio between the wind metal mass to the total metal mass (panel c). It is interesting that the wind fraction and the ejected metal fraction correlate well with the stellar metallicity (panel d). Based on this finding, we conclude that the origin of the mass-metallicity relation can be explained with galactic winds.
We note that the mass contribution of the winds is still larger for massive galaxies. of the total wind mass and of the total metals are ejected from massive galaxies with . The smaller contribution for the metal ejection from massive galaxies is due to the metal-dependent cooling; enriched gas tends to be locked in stellar population of galaxies.
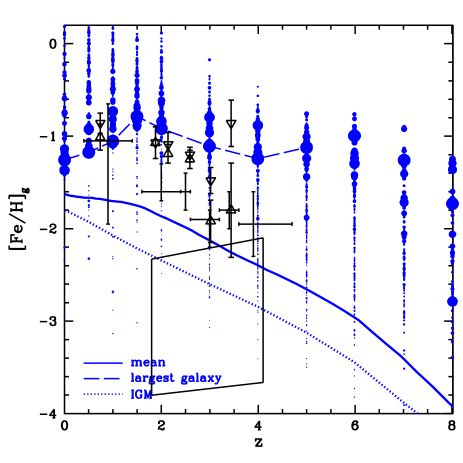
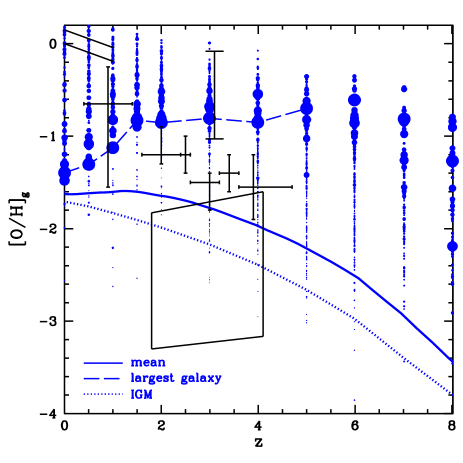
The metal enrichment timescale depends on the environment. Figure 18 shows the evolution of iron and oxygen abundances in the gas phase. The average metallicity of the universe (solid line) reaches [O/H] and [Fe/H] at ( Gyr), but reaches the same values at ( Gyr) in the IGM (dotted line). The box shows [C/H] obtained from quasar absorption line measurements, which involves some uncertainty in the UV background radiation. [C/Fe] is also uncertain, and spans a wide range of [C/Fe] in the metal-poor stars in the Milky Way. Since core-collapse supernovae cannot produce so much carbon relative to Fe ([C/Fe] , Kobayashi et al. (2006)), the C-rich stars seem to be enriched by massive and/or low-mass stellar winds, they could also be affected by internal mixing or by external enrichment from a binary companion. The metallicity of the IGM seems not to be affected significantly by stellar winds because of the lower energy and the different timescale. Assuming that the IGM is enriched only by core-collapse supernovae, we could account for this by shifting the observed region assuming [C/Fe] and [C/O], and then our result becomes comparable to the observations. We note that this assumption can explain the observed [Si/C] in the IGM (Aguirre et al. (2004)), while pair instability supernovae, which produce much more iron and less carbon, cannot resolve this conflict. A self-consistent model for the carbon abundance is required.
The metallicities of the individual galaxies with are shown as points, with larger points representing more massive galaxies. In large galaxies, the enrichment takes place so quickly that [O/H] reaches at . This is consistent with the metallicities of LBGs (large errorbar at , Pettini et al. (2001)). Smaller galaxies evolve with more variable timescales, resulting in a larger scatter of [O/H] at present. The metallicities of DLA systems (errorbars, Prochaska et al. (2003); triangles, Kulkarni et al. (2005)) are comparable with our galaxies, suggesting an identification of DLAs with dwarf galaxies or the outskirts of massive galaxies.
The metallicities measured for local emission-line galaxies (two parallel lines at , Kobulnicky & Kewley (2004)) are much larger than our simulation predictions. One reason could be an aperture effect. The metallicities of our model galaxies are measured for the whole galaxy, which may be systematically low compared to the observations since strong metallicity gradients are found in our galaxies (Fig. 5) and the observational data focuses on star-forming regions which may be biased towards galaxy centres. The other reason is that a lot of metal-poor hot/warm gas exists in our large galaxies because of their deep potential. Observing the metallicity of warm gas is also important to put constraint on the chemical enrichment history of the universe. If we measure the metallicity of the cold gas in the innermost kpc region, [O/H] reaches , weakly increasing toward , which is comparable to the observations.

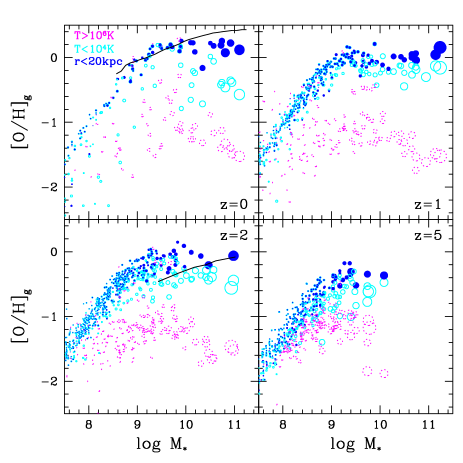
In Figure 19, the metallicities of hot (dotted-open circles) and cold (open circles) gas are shown against the stellar mass of the galaxies. There seems to be a relation that gives a larger metallicity of the cold gas in more massive galaxies, and [O/H] and in giant and dwarf galaxies, respectively. The filled circles show the cold gas metallicities within kpc, which are comparable to those found in SDSS emission-line galaxies (solid line, Tremonti et al. (2004)), but the slope is shallower. In our model, mass-metallicity relations for central cold gas are found after , although there is a significant scatter. At , the gas metallicity is consistent with the observation (solid line, Erb et al. (2006)) for massive galaxies, but seem to be larger than observed for low-mass galaxies.
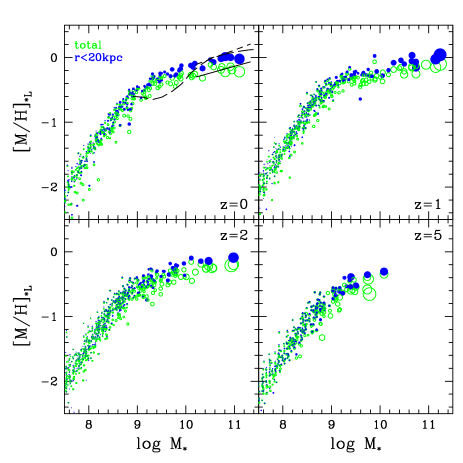
In contrast to this large scatter, tight relations are found between the stellar metallicity and stellar mass at any redshift, as shown in Figure 20, based on V-band luminosity-weighted metallicities. The mean stellar metallicity of the whole galaxy (open circles) reaches solar for massive galaxies, and half solar for intermediate-mass galaxies. This is consistent with observations of nearby ellipticals when the effect of metallicity gradients is taken into account (solid line, Kobayashi & Arimoto (1999)). The central metallicity measured within kpc (filled circles) is two times higher (short-dashed line, Pahre, Djorgovski & de Carvalho (1998)) than a global average. In our simulation, progressively more material has been blown away via galactic winds from present-day lower mass galaxies (Fig. 16), and we find a mass-metallicity relation that continues for dwarf galaxies. However, Gallazzi et al. (2005) (long-dashed line) found a change of the slope at in the SDSS, which does not appear in our simulations. The change of the slope at in our results is presumably due to resolution effects.
5 Conclusions
We have simulated cosmic chemical evolution with a tree-SPH code including star formation, supernova feedback, and a detailed chemical enrichment model that does not rely on the instantaneous recycling approximation. We have also investigated the role hypernova may play for regulating star formation and for enriching the universe. Our main findings can be summarized as follows.
-
1.
Supernova feedback can suppress star formation, but this reduction is largely compensated by an increase of similar size when metal-dependent cooling is included. In simulations of isolated disk galaxies with a total halo mass of , a bipolar galactic wind is formed as a result of the supernovae feedback and ejects up to half of the baryons. The ejected metal fraction is not as large because of metal-dependent cooling, and amounts to a few percent for supernova feedback. If hypernovae are included as well, this raises to . In this case, more metals are ejected with more energy, and the enriched gas is heated so strongly that rapid subsequent cooling in prevented. The wind efficiency does not depend strongly on numerical resolution. However, it depends strongly on halo mass; for massive halos of mass no winds occur.
-
2.
The cosmic SFR shows a peak at , with of baryons turning into stars, roughly consistent with observational estimates. We analyse the contributions to the cosmic SFR from different galaxy mass scales at present (Fig. 13), and at the observed redshift (Fig. 14). The majority of the stars in present-day massive galaxies have formed in smaller systems at high redshifts, and the stellar population of these galaxies is as old as , consistent with observations of elliptical galaxies. No relation is found between luminosity-weighted age and stellar mass. The ages of low-mass galaxies span a wide range of Gyr.
-
3.
Tracing the orbits of gas particles, we found that of all baryons are ejected at least once from galaxies into the IGM. Galactic winds blow particularly efficiently from low-mass galaxies. The wind fraction is larger for less massive galaxies, and of the accreted baryons are ejected from galaxies with mass below (Fig. 16). The wind fraction correlates well with the stellar metallicity, and the origin of the mass-metallicity relation is from galactic winds.
-
4.
The metal-enrichment history depends on environment. In large galaxies, enrichment takes place so quickly that [O/H] reaches at , which is consistent with the sub-solar metallicities of the Lyman break galaxies. The low metallicities of DLA systems are also consistent with our galaxies, provided these systems are dwarf galaxies or the outskirts of massive galaxies. The low [C/H] of the IGM can be explained if the IGM is enriched only by SNe II and HNe. The average metallicity of the universe reaches [O/H] and [Fe/H] at ( Gyr), but reaches the same values at ( Gyr) in the IGM.
-
5.
In galaxies, metallicity of the cold gas increases with galaxy mass, which is comparable to observations with a large scatter. The central cold gas shows a relation between galaxy mass and metallicity with shallower slope than observed in emission-line galaxies. For the stellar population, the observed mass-metallicity relation is well reproduced, and originates in mass-dependent galactic winds. These relations are present since .
At , however, star formation has not terminated in our massive galaxies, and not many dwarf galaxies are still forming. The latter problem may be due to lack of resolution, while the former may reflect non-supernova feedback such as accretion onto supermassive black holes. It will be interesting to include active galactic nuclei in future studies of cosmic chemical evolution, as well as to further increase the dynamic range of these calculations. This will then allow methods such as the ones explored here to fully exploit the observational abundance measurements to better constrain galaxy formation physics.
Acknowledgements
C.K. thank to the Japan Society for Promotion of Science for a financial support.
References
- Aguirre et al. (2004) Aguirre, A., Schaye, J., Kim, T.-S., Theuns, T., Rauch, M., Sargent, W. L. W. 2004, ApJ, 602, 38
- Arimoto & Yoshii (1987) Arimoto, N., & Yoshii, Y. 1987, A&A, 173, 23
- Arnaud et al. (1992) Arnaud, M., Rothenflug, R., Boulade, O., Vigroux, L., & Vangioni-Flam, E. 1992, A&A, 254, 49
- Barger, Cowie, & Richards (2000) Barger, A. J., Cowie, L. L., & Richards, E. A. 2000, AJ, 119, 2092
- Bromm & Larson (2004) Bromm, V. & Larson, R. B. 2004, ARA&A, 42, 79
- Bouwens, Broadhurst, & Illingworth (2003ab) Bouwens, R. J. Broadhurst, T. & Illingworth, G. 2003, ApJ, 593, 640
- Bouwens et al. (2003b) Bouwens, R. J. et al. 2003, ApJ, 595, 589
- Bower, Lucey & Ellis (1992) Bower, R. G., Lucey, J. R., & Ellis, R. S. 1992, MNRAS, 254, 601
- Brinchmann et al. (2004) Brinchmann, J., Charlot, S., White, S. D. M., Tremonti, C., Kauffmann, G., Kechman, T., & Brinkmann 2004, MNRAS, 351, 1151
- Brinchmann & Ellis (2000) Brinchmann, J. & Ellis, R. 2000, ApJ, 536, L77
- Bullock et al. (2001) Bullock, J. S., Dekel, A., Kolatt, T. S., Kravtsov, A. V., Klypin, A. A., Porciani, C., Primack, J. R. 2001, ApJ, 555, 240
- Bunker et al. (2004) Bunker, A, Stanway, E. R., Ellis, R. S., McMahon, R. G. 2004, MNRAS, 355, 374
- Carraro, Lia & Chiosi (1998) Carraro, G. Lia, C., & Chiosi, C. 1998, MNRAS, 297, 1021
- Cen & Ostriker (1999) Cen, R. & Ostriker, J. P. 1999, ApJ, 519, L109
- Cohen (2002) Cohen, J. G. 2002, ApJ, 567, 672
- Cole et al. (1994) Cole, S., Aragón-Salamanca, A., Frenk, C. S., Navarro, J. F., & Zepf, S. E. 1994, MNRAS, 271, 781
- Cole et al. (2001) Cole, S. et al. 2002, MNRAS, 326, 255
- Connolly et al. (1997) Connolly, A. J., Szalay, A. S., Dickinson, M., SubbaRao, M. U., & Brunner, R. J. 1997, ApJ, 486, L11
- Cowie et al. (1996) Cowie, L. L., Songaila, A., Hu, E. M., & Cohen, J. G. 1996, AJ, 112, 839
- Croton et al. (2006) Croton, D. et al. 2006, MNRAS, 365, 11
- Davé & Oppenheimer (2006) Davé, R. & Oppenheimer, B. D. 2006, astro-ph/0608268
- Dickinson et al. (2003) Dickinson, M., Papovich, C., Ferguson, H. C., & Budavári, T. 2003, ApJ, 587, 25
- Di Matteo, Springel, & Hernquist (2005) Di Matteo, T., Springel, V., & Hernquist, L. 2005, Nature, 433, 604
- Erb et al. (2006) Erb, D. K., Shapley, A. E., Pettini, M., Steidel, C. C., Reddy, N. A. & Adelberger, K. L. 2006, ApJ, 644, 813
- Fontana et al. (2006) Fontana, A. et al. A&A, 459, 745
- Förster Schreiber et al. (2004) Förster Schreiber, N. M. et al. 2004, ApJ, 616, 40
- Fukugita & Peebles (2004) Fukugita, M. & Peebles, P. J. E. 2004, ApJ, 616, 643
- Gallego et al. (1995) Gallego, J., Zamorand, J., Aragón-Salamanca, A., & Rego, M. 1995, ApJ, 455, L1
- Gallazzi et al. (2005) Gallazzi, A., Charlot, S., Brinchmann, J., White, S. D. M., & Tremonti, C. A. 2005, MNRAS, 362, 41
- Giavalisco et al. (2004) Giavalisco, M et al. 2004, ApJ, 600, L103
- Glazebrook et al. (1999) Glazebrook, K., Blake, C., Economou, F., Lilliy S., & Colles, M. 1999, MNRAS, 306, 843
- Gronwall (1999) Gronwall, C. 1999, in AIP Conf. Proc. 470, After the Dark Ages: When Galaxies Were Young, ed. S. Holt & E. Simith (New York: AIP), 335
- Haardt & Madau (1996) Haardt, F. & Madau, P. 1996, ApJ, 461, 20
- Heckman et al. (2000) Heckman, T. M., Lehnert, M. D., Strickland, D. K.,& Armus, L. 2000, ApJS, 129, 492
- Mihos & Hernquist (1989) Mihos, J. C. & Hernquist, L. 1994, ApJ, 464, 641
- Hughes et al. (1998) Hughes, D., et al. 1998, Nature, 394, 241
- Iwata et al. (2003) Iwata, I et al. 2003, PASJ, 55, 415
- Kawata & Gibson (2003) Kawata, D., & Gibson, B. K. 2003, MNRAS, 340, 908
- Katz (1992) Katz, N. 1992, ApJ, 391, 502
- Katz, Weinberg & Hernquist (1996) Katz, N., Weinberg, D. H., & Hernquist, L. 1996, ApJS, 105, 19
- Kauffmann, White & Guiderdoni (1993) Kauffmann, G., White, S. D. M., & Guiderdoni, B. 1993, MNRAS, 264, 201
- Kauffmann et al. (2003) Kauffmann, G., et al. 2003, MNRAS, 341, 54
- Kobayashi (2004) Kobayashi, C., 2004, MNRAS, 347, 740 (K04)
- Kobayashi (2005) Kobayashi, C., 2005, MNRAS, 361, 1216
- Kobayashi & Arimoto (1999) Kobayashi, C., & Arimoto, N. 1999, ApJ, 527, 573
- Kobayashi, Tsujimoto & Nomoto (2000) Kobayashi, C., Tsujimoto, T., & Nomoto, K. 2000, ApJ, 539, 26
- Kobayashi et al. (1998) Kobayashi, C., Tsujimoto, T., Nomoto, K., Hachisu, I, & Kato, M. 1998, ApJ, 503, L155
- Kobayashi et al. (2006) Kobayashi, C., Umeda, H., Nomoto, K., Tominaga, N., & Ohkubo, T. 2006, ApJ, 653, 1145
- Kobulnicky & Kewley (2004) Kobulnicky, H. A. & Kewley, L. J. 2004, ApJ, 617, 240
- Kodama & Arimoto (1997) Kodama, T., & Arimoto, N. 1997, A&A, 320, 41
- Kodama et al. (2004) Kodama, T., et al. 2004, MNRAS, 350, 1005
- Kulkarni et al. (2005) Kulkarni, V. P., Fall, S. M., Lauroesch, J. T., York, D. G., Welty, D. E., Khare, P. & Truran, J. W. 2005, ApJ, 618, 68
- Larson (1974) Larson, R. B. 1974, MNRAS, 169, 229
- Lilly et al. (1996) Lilly, S. J., Le Fèvre, O., Hammer, F., & Crampton, D. 1995, ApJ, 460, L1
- McGaugh (2005) McGaugh, S. S., 2005, ApJ, 632, 859
- Madau et al. (1996) Madau, P., Ferguson, H. C., Dickinson, M. E., Giavalisco, M., Steidel, C. C., & Fruchter, A. 1996, MNRAS, 283, 1388
- Martin, Kobulnicky & Heckman (2002) Martin, C. L., Kobulnicky, H. A., & Heckman, T. M. 2002 ApJ, 574, 663
- Mazzotta et al. (2002) Mazzotta, P., Kaastra, J. S., Paerels, F. B., Ferrigno, C., Colafrancesco, S., Mewe, R., Forman, W. R. 2002, ApJ, 567, 37
- Mosconi et al. (2001) Mosconi, M. B., Tissera, P. B., Lambas, D. G., & Cora, S. A., 2001, MNRAS, 325, 34
- Nakasato & Nomoto (2003) Nakasato, N., & Nomoto, K. 2003, ApJ, 588, 842
- Navarro, Frenk & White (1996) Navarro, J. F., Frenk, C. S., & White, S. D. M. 1996, ApJ, 462, 563
- Navarro & White (1993) Navarro, J. F., & White, S. D. M. 1993, MNRAS, 265, 271
- Navarro & White (1994) Navarro, J. F., & White, S. D. M. 1994, MNRAS, 267, 401
- Nomoto et al. (1997a) Nomoto, K., Hashimoto, M, Tsujimoto, T, Thielemann, F. -K, Kishimoto, N., Kubo, Y., & Nakasato, N. 1997a, Nuclear Physics, A616, 79c
- Nomoto et al. (1997b) Nomoto, K., Iwamoto, K., Nakasato, N., Thielemann, F. -K, Brachwitz, F., Tsujimoto, T., Kubo, Y., & Kishimoto, N. 1997b, Nuclear Physics, A621, 467c
- Nomoto et al. (2002) Nomoto, K., Maeda, K., Umeda, H., Ohkubo, T., Deng, J., & Mazzali, P. 2002, in IAU Symp. 212, in press (astro-ph/0209064)
- Norman et al. (2004) Norman, C. et al. 2004, ApJ, 607, 721
- Ohyama et al. (2002) Ohyama, Y, et al. 2002, PASJ, 54, 891
- Ouchi et al. (2004) Ouchi, M, et al. 2004, ApJ, 611, 660
- Pahre, Djorgovski & de Carvalho (1998) Pahre, M., Djorgovski, S. G., & de Carvalho, R. R. 1998, ApJ, 116, 1591
- Pérez-González et al. (2003) Pérez-González, P. G., Zamorano, J., Gallego, J., Aragón-Salamanca, A., & Gil de Paz, A. 2003, ApJ, 591, 827
- Pettini et al. (1997) Pettini, M., Smith, L. J., King, D. L., & Hunstead, R. W. 1997, ApJ, 486, 665
- Pettini et al. (2001) Pettini, M., et al. 2001, ApJ, 554, 981
- Pfenniger & Revaz (2005) Pfenniger, D. & Revaz, Y. 2005, A&A, 431, 511
- Prochaska et al. (2003) Prochaska, J., Gawiser, E., Wolfe, A. M., Castro, S., & Djorgovski, S. G. 2003, ApJ, 595, L9
- Raiteri, Villata & Navarro (1996) Raiteri, C. M., Villata, M., & Navarro, J. F., A&A, 315, 105
- Reddy & Steidel (2004) Reddy, N. A. & Steidel, C. C. 2004, ApJ, 603, L13
- Renzini (2002) Renzini, A. 2002, in ASP Conference Series, 253, Chemical Enrichment of Intracluster and Intergalactic Medium, eds., R. Fusco-Femiano & F. Matteucci, p.331
- Rudnick et al. (2003) Rudnick, G. et al. 2003, ApJ, 599, 847
- Rudnick et al. (2006) Rudnick, G. et al. 2006, ApJ, 650, 624
- Schaye et al. (2003) Schaye, J., Aguirre, A., Kim, T., Theuns, T., Rauch, M., & Sargent, W. L. W. 2003, ApJ, 596, 768
- Schiminovich et al. (2005) Schiminovich, D. et al. 2005, ApJ, 619, L47
- Songaila (2001) Songaila, A. 2001, ApJ, 561, L153
- Springel (2005) Springel, V. 2005, MNRAS, 364, 1105
- Springel & Hernquist (2002) Springel, V. & Hernquist, L. 2002, MNRAS, 333, 739
- Springel & Hernquist (2003) Springel, V. & Hernquist, L. 2003, MNRAS, 339, 289
- Springel & Hernquist (2003b) Springel, V. & Hernquist, L. 2003, MNRAS, 339, 312
- Springel, Yoshida & White (2000) Springel, V., Yoshida, N., & White, S. D. M. 2000, NewA, 6, 79
- Steidel et al. (1999) Steidel, C. C., Adelberger, K. L., Giavalisco, M., Dickinson, M., & Pettini, M. 1999, ApJ, 519, 1
- Steinmetz & Müller (1994) Steinmetz, M., & Müller, E. 1994, A&A, 281, L97
- Sutherland & Dopita (1993) Sutherland, R. S., & Dopita, M. A. 1993, ApJS, 88, 235
- Thomas & Maraston (2003) Thomas, D. & Maraston, C. 2003, A&A, 401, 429
- Tornatore et al. (2004) Tornatore, L., Borgani, S., Matteucci, F., Recchi, S., Tozzi, P. 2004, MNRAS, 349, L19
- Tresse & Maddox (1998) Tresse, L., & Maddox, S. J. 1998, ApJ, 495, 691
- Tresse et al. (2002) Tresse, L., Maddox, S. J., Le Fèvre, & Cuby, J.-G. 2002, MNRAS, 337, 369
- Tremonti et al. (2004) Tremonti, C. A. et al. 2004, ApJ, 613, 898