A Chandra ACIS Observation of the X-ray Luminous SN 1988Z
Abstract
SN 1988Z is the most luminous X-ray-emitting supernova, initially detected in 1995 using the ROSAT HRI with a luminosity of 81040 erg s-1 (Fabian & Terlevich, 1996). Its high luminosity was ascribed to expansion of the blast wave into an especially dense circumstellar medium. In this paper, we describe a recent observation of SN 1988Z using the ACIS detector on Chandra. We readily detect SN 1988Z, obtaining 30 net counts which corresponds to a 0.2-2.0 keV luminosity of 3.21039 erg s-1. The calculated quantiles for the extracted counts allow a broad range of temperatures, but require a temperature hotter than 5 keV if there is no intrinsic absorption. The long term light curve (1995-2005) declines as t-2.6±0.6. This is one of the steepest X-ray light curves. The X-ray luminosity indicates that the emitting region has a high density (105 cm-3) and that the density profile is not consistent with a constant mass loss stellar wind during the 5,000 years before the explosion. If the circumstellar medium is due to progenitor mass loss, then the mass loss rate is extremely high (10-3 M☉ yr-1(vw/10 km s-1)). The X-ray results are compared with the predictions of models of SN1988Z.
1 Introduction
The detection of X-rays from a supernova is a rare event. While several mechanisms might produce X-ray emission - a thermal flash associated with breakout of the shock from the stellar surface, Compton scattered -rays from metals synthesized in the explosion, shocked-heated circumstellar matter - only the latter has been detected more than once. Down-scattered -rays have been detected only from SN 1987A between 6 and 12 months after the explosion. Strong X-ray emission from shock-heated circumstellar matter occurs only when a relatively large amount of material is located in close proximity to the progenitor. As this material is generally the product of the pre-supernova stellar mass loss, measuring the X-ray light curve reveals the mass loss history. As the blast wave propagates outward considerably faster than the wind, the supernova light curve over the course of a few years reveals the mass loss history of the progenitor’s final several thousand years.
The total list of supernovae detected in X-rays consists of 24 objects, and is slowly growing as a result of Chandra, XMM-Newton and now Swift observations. 111A complete list of X-ray SNe and references is available at http://lheawww.gsfc.nasa.gov/users/immler/supernovae list.html Long term light curves exist for about half a dozen of these (Immler & Kuntz, 2005). These light curves show a range of behavior, from nearly flat (e.g., SN 1979C and SN 1978K since its 1991 discovery), to declining at various rates, to more complex behavior (e.g., SN 1993J - Zimmermann & Aschenbach (2003)). These light curves are decidedly incomplete, however, as data sets consisting of more than four observations exist for only four SNe (SN 1978K, SN 1993J, SN 1998S, SN 1999em) and only six supernovae have been followed beyond a few years. In this paper we add SN 1988Z to this select group.
SN 1988Z is one of a small number of extremely luminous, X-ray emitting supernovae (Schlegel, 1995; Immler & Lewin, 2003; Schlegel, 2005) and is the most distant confirmed X-ray emitter. SN 1988Z was discovered on 1988 Dec 12 by two independent observers, C. Pollas (Pollas, 1988) and G. Candeo (Cappellaro, Turatto, & Candeo, 1988), near the galaxy MCG +03-28-022 (= Zw 095-049). It was classified as a Type II by Heathcote, Cowley, & Hartwick (1988) from an optical spectrum. Filippenko (1989) confirmed the classification, noting the spectral peculiarities of very blue color and lack of P Cyg profiles. Schlegel (1990) included it as a member of a new subclass, the Type IIn supernovae. Weiler, Panagia, & Sramek (1990) reported the first radio detection of SN 1988Z using the Very Large Array; subsequent detailed early radio observations were reported in Van Dyk et al. (1993) and recent radio observations in Williams et al. (2002). Aretxaga et al. (1999) amassed the observations of SN 1988Z available as of late 1998 and constructed the first spectral energy distribution for any Type IIn supernova.
SN 1988Z’s importance arises from its extreme distance, 93 Mpc (assuming Ho=72 km s-1 Mpc-1). 222A marginal detection of SN 2002hi, at an estimated distance of 180 Mpc, is reported by Pooley & Lewin (2003) The text is available at the Astronomer’s Telegram website, www.astronomerstelegram.org/.. At a discovery luminosity of 81040 ergs s-1, it is also the most luminous. (This luminosity was revised down to (31.6)1040 ergs s-1 by Aretxaga et al. (1999)). More importantly, SN 1988Z has been proposed by Fabian & Terlevich (1996) as the prototype ”compact supernova,” an event in a high density medium emitting sufficient luminosity to power the broad-line regions of some active galactic nuclei (e. g., Terlevich et al. (1992)). While this idea has fallen out of favor, the existence of SN 1988Z suggests that extremely luminous supernovae occur via the proposed mechanism, and are interesting objects of study in their own right. A second interpretation suggests that the high luminosity arises from shocks driven into dense clumps formed by an unstable stellar wind (Chugai & Danziger (1994);Williams et al. (2002)). Either mechanism requires a substantial circumstellar envelope.
In this paper, we present the result of a Chandra ACIS observation of SN 1988Z. Chandra’s sensitivity allows us to clearly detect the object a decade after its initial X-ray detection. While limited spectral information is available from the observation, the inferred flux and the 10-year light curve lead to interesting inferences about SN 1988Z and its environment.
Throughout this paper we adopt a distance to SN 1988Z of 93 Mpc, calculated from the redshift of 6670 km s-1 (Barbon, Cappellaro, & Turatto, 1989) and using the value for H0 of 72 km s-1 Mpc-1 derived from both WMAP (Spergel et al., 2003) and the Hubble Space Telescope (Freedman et al., 2001) . Note that this is different from the distance assumed in previous papers describing X-ray and radio observations (Fabian & Terlevich (1996); Aretxaga et al. (1999); Williams et al. (2002); Table 1).
2 Observation
Chandra observed SN 1988Z on 2004 June 29 (MJD 53186) for 50 ksec with the ACIS detector (Garmire et al., 2003). The aimpoint of the detector fell on the back-illuminated S3 CCD. The observation was cut short by 2 ksec by increasing electron contamination following a solar flare and during approach to the radiation belts. We extracted a light curve of the background, masking out all bright sources detectable by eye, to search for any signatures of flaring events known to affect back-illuminated CCDs (Chandra Proposers’ Guide, 2002). The background rate increased dramatically near the end of the observation, reflecting the increasing radiation background from the solar flare. Removal of the increased background interval yielded a net exposure time of 44.62 ksec.
3 Results
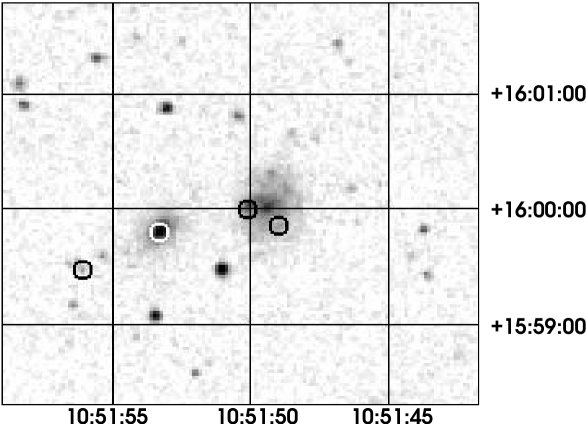
Figure 1 shows the optical field containing SN 1988Z and its host galaxy MCG +03-28-022. Circles indicate the X-ray sources detected in the 0.3-10.0 keV band. A total of four sources were detected within 2 arc minutes of the nucleus. The brightest of these is located within 0′′.5 of the radio position of SN 1988Z (Williams et al., 2002). This source is marked in Figure 1 with the white circle. It is the brightest source among the four by a factor of two. Note that the nucleus of the host galaxy is not detected as an X-ray source.
We extracted counts from SN 1988Z using an aperture of 4′′ centered on the source; this aperture encloses 98% of the point spread function of an on-axis point source (Chandra Proposers’ Guide, 2002). We also extracted counts in several bands; for example, to match the bandpass of the ROSAT HRI (Aretxaga et al., 1999), we used the 0.2-2 keV band. There is a larger uncertainty (and fewer net counts) in the 0.2-2 keV band than in the 0.3-2 keV band because of the higher background below 0.3 keV (Chandra Proposers’ Guide, 2002).
The background was extracted from a circle of radius 20′′ centered 30′′ to the southeast of the source circle to avoid any possible emission from the host galaxy. The net total-band count rate is (8.41.7)10-4 counts s-1. The rates for all extracted bands are listed in Table 2. At these low count rates, the effects due to event pileup are negligible (Davis, 2001).
3.1 Spectral Constraints
Quantiles have been demonstrated to be more robust than hardness ratios for estimating spectral properties of sources with very limited numbers of counts because they do not generate upper limits (Hong, Schlegel, & Grindlay, 2004). For the ACIS observation, we extracted the photon energy values for the events in the source and background apertures and generated the 25% and 75% quantile values.
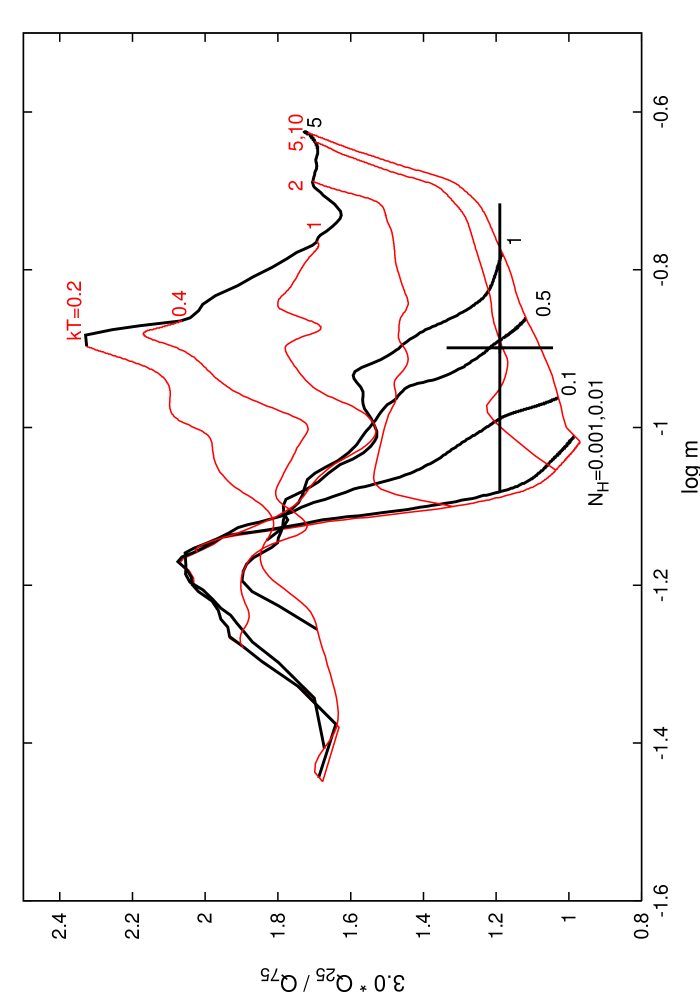
Figure 2 shows the result of quantile analysis for a coronal ionization equilibrium plasma (MeKaL) grid. The MeKal grid has the depicted shape because of the changing presence of line emission as the temperature (primarily) is varied. The quantile analysis yields a preferred temperature of 2-3 keV, but the 90% uncertainty covers a very broad range, leaving the temperature high, but essentially undefined. The preferred column density is 51021 cm-2, with a range between 11019 cm-2 and 21022 cm-2. The broad allowed temperature range can be understood from the relative instability of quantiles using the MeKaL model caused by the emergence and decline of various lines as the temperature varies. If we externally constrain the value of the column density by using the Galactic value of 1.41020 cm-2, then the temperature is constrained to be hotter than 5 keV.
3.2 Flux and Light Curve
Converting the measured count rates into physical units requires estimates of distance and column density plus an assumption about the emission mechanism. We use different values for all three from those used in previous papers (Fabian & Terlevich (1996), Aretxaga et al. (1999)), as justified below.
We estimated the column density toward SN 1988Z using the dust maps of Schlegel, Finkbeiner, & Davis (1998) and the EB-V-NH relation of Predehl & Schmitt (1995). Together these yield a value of 1.41020 cm-2, lower than the 2.51020 cm-2 from the lower angular resolution maps of Burstein & Heiles (1982) used by Aretxaga et al. (1999). Aretxaga et al. (1999) point out that the X-ray column density in the immediate vicinity of the supernova could be much higher if the pre-ionized material enshrouding the supenova is only partially ionized, as the partially ionized material will absorb a substantial fraction of the soft X-ray flux. They estimate that the column density could easily be as high as 1022 cm-2. The absence of absorption in the radio data suggest this is not the case (Williams et al., 2002). Nevertheless it should be noted that the soft X-ray luminosity would be substantially underestimated if we adopt the Galactic column density while the supernova instead has a high intrinsic column.
A supernova shock encountering dense circumstellar material or ejecta generally produces a line-rich X-ray spectrum from atomic transitions within nearly stripped ions. Given the inferred density of the shocked medium around SN 1988Z, it is expected to rapidly attain collisional ionization equilibrium (Chevalier & Fransson, 1994, 2004). We therefore use the MeKaL model for estimating flux and luminosity (Liedahl et al., 1992; Mewe et al., 1985). This is also different from previous publications, which used thermal Bremsstrahlung (Fabian & Terlevich, 1996; Aretxaga et al., 1999)(Table 1). If SN 1988Z emits copious hard X-rays, then it is possible that the entire surrounding medium has become fully ionized, in which case Bremsstrahlung emission would dominate. Given the absence of spectral information, either spectral model can be used equally well to infer relative fluxes among the available X-ray observations.
The quantile analysis indicates that if we externally constrain the value of the column density by using the Galactic value of 1.41020 cm-2, then the temperature is constrained to be hotter than 5 keV. To maintain consistency with the quantile results we assume for our flux estimates a 5 keV plasma with Galactic column density. Flux analysis of the X-ray emission from other remnants with higher flux has generally used a temperature of 0.8 keV, inferred from spectral fitting (Schlegel, 2005; Immler et al., 2005). This has been intepreted as the temperature of the reverse shock. It should be noted that the emissivity of a plasma in the 0.2-2.0 keV band varies slowly over the temperature range from 0.5 to 10 keV. The emissivity for a 0.8 keV plasma is approximately 25 percent higher than a 5 keV plasma. The acknowledged inconsistency with other analyses resulting from the use here of the higher temperature is however comparable with or smaller than other uncertainties, such as possible temperature evolution between the ROSAT and Chandra observations.
The recession velocity of MCG +03-28-022 is 6670 km s-1 (Barbon, Cappellaro, & Turatto, 1989). Adopting the value for H0 of 72 km s-1 Mpc-1 consistent with with WMAP and Hubble Space Telescope measurements (Spergel et al., 2003; Freedman et al., 2001) yields a distance to SN 1988Z of 93 Mpc. Previous papers (Fabian & Terlevich (1996), Aretxaga et al. (1999), Table 1) assumed a smaller Hubble Constant value (H0 = 50 km s-1 Mpc-1) and thus inferred a larger distance (and thus a higher luminosity).
Table 3 lists the inferred 0.2-2.0 and 0.5-2.0 keV fluxes and luminosities for the ROSAT and Chandra observations. The inferred flux for the ROSAT observations is essentially unchanged, as the reduction due to use of the lower Galactic NH is offset by the increase due to the higher kT. The luminosities for the ROSAT observations are reduced from those in Aretxaga et al. (1999) by about a factor of two as a consequence of the revised distance. From the original estimate of 20.71041 ergs s-1 (Fabian & Terlevich, 1996), and the adjusted value of 83.21040 ergs s-1 (Aretxaga et al., 1999), the peak observed 0.2-2.0 keV luminosity is now 3.41.21040 ergs s-1. Of course, estimates of luminosity in other bands also drop by a factor of two as a result of the revised distance. Despite this downward revision, SN 1988Z remains the most luminous supernova with a confirmed X-ray detection.
The 0.2-2.0 keV fluxes are displayed graphically in Figure 3, the X-ray light curve. The ACIS flux is an order of magnitude lower than the initial ROSAT HRI flux. A fit to dlog(flux)/dlog(t) for the 0.2-2.0 keV band yields a slope of -2.60.6. Thus the luminosity evolution of SN 1998Z in this band follows the curve LX t-2.6±0.6. SN1970G, with a slope of 2.70.9 is the only X-ray supernova with a light curve as steep, but much later in its evolution (Immler & Kuntz, 2005).
3.3 Inferred X-ray Properties
It is possible to infer information about the density of the gas from the X-ray luminosity, if an assumption is made about the size of the X-ray emitting region. Aretxaga et al. (1999) show that the H width decrease is consistent with the shock velocity being proportional to t-5/7. If we assume that the H width is a measure of the shock velocity, it is possible to estimate the radius and hence the volume of the region enclosed by the shock for each the four X-ray observations. The inferred velocity, radius and volume are listed in Table 4.
For a thermal plasma, Lx = (T)nVx, where P(T) is the plasma emissivity, ne the electron density, and Vx the volume of the emitting material. The product n Vx is referred to as the volume emission measure. For a plasma with a temperature in the range 0.5-10.0 keV, the emissivity in the 0.2-2.0 keV band is 1023 erg cm3 s-1 (Raymond, Cox, & Smith, 1976). In Table 4 we have tabulated the value of n Vx for each of the observations. The emitting volume Vx is equal to V, where V is the total volume enclosed by the shock and is the volume filling factor. Table 4 indicates that the value of ne, the density of the shock-compressed gas, varies from 6.2105 cm-3 for the first ROSAT observation to 1.1105 cm-3 for the Chandra observation. Thus the density is high, even for the lowest density case, assuming the plasma uniformly fills the shocked volume. Prior to being shock heated, the density of the ambient gas will be at least a factor of 4 lower than the post shock density.
In Table 4 we also list the inferred X-ray emitting mass. In all cases, the minimum mass is several solar masses. The high shock velocity (1,000 km s-1) ensures that the bulk of the luminosity emerges in the X-ray band throughout the interval covered by the ROSAT and Chandra observations.
The methodology used above for inferring properties of the X-ray emitting gas are similar to those first used by Immler and co-workers (as summarized in Immler & Lewin (2003)). The fundamental difference is that these authors assume a constant shock velocity, whereas we assume one decreasing with time. If we were to assume a constant velocity, the values we infer for density and mass would be similar, but would be higher or lower, depending upon the velocity we assume.
The rapid decrease of the X-ray emitting mass can in principle be used to set a lower limit on the density and thus constrain the filling factor. A decline in the emitting mass indicates that the shock-heated material is cooling quickly. The cooling time tc can be written as: tc = 0.2 v/(n7) yr, where v8 is the shock velocity in units of 108 cm s-1, n7 is the density in units of 107 cm-3, and is the plasma emissivity in units of 10-23 erg cm3 s-1 (Aretxaga et al. (1999)). The contents of Table 4 indicate n70.01 and v81, adopting 1. That the X-ray emitting mass is decreasing at a rate between 0.2 and 1 solar mass per year suggests a cooling time on the order of 1-5 years. Such a cooling time requires a density 4105 cm3. As this density lower limit is consistent with the inferred X-ray emitting gas density, we conclude that a filling factor as large as unity is allowed.
It is also possible to estimate the mass loss rate of the progenitor, if we assume that the circumstellar envelope is due to mass loss. Integrating the X-ray emitting mass yields a variable mass loss rate. For the epoch of the initial ROSAT observation, corresponding to 4000(vw/10 km s-1) years before the explosion, the minumum mass loss rate (from assuming =1) is 1.210-3 M☉ yr-1vw/10 km s-1). For the epoch of the Chandra observation, which corresponds to 5500(vw/10 km s-1) years before the explosion, the minumum mass loss rate is 410-4 M☉ yr-1(vw/10 km s-1). Alternatively, the X-ray cooling rate requires at least 7 M to have been swept up. This corresponds to an average mass loss rate of 1.310-3 M☉ yr-1(vw/10 km s-1). This range of mass loss rates lie at the extreme end of those inferred for X-ray supernovae (Immler & Lewin, 2003), as would be expected given its high luminosity.
We assumed above that the gas is in collisional ionization equilibrium. For a shock-heated plasma, CIE is attained when the product net1013cm-3 s. The inferred gas densities require t1-8108 s = 3-24 yr to reach equilibrium. Thus the equilibration time is comparable with the cooling time, and the assumption of CIE is justified.
The X-ray fluxes require ne to decline with time. Since Lx t-2.6 and ne L, we expect ne t-1.3. The data do not allow determination of whether the density declines while the filling factor remains constant, the filling factor declines while the density remains constant, or both change with time. In the discussion below, we consider the implications of a decline of density and filling factor in the context of models proposed for SN 1988Z.
4 Discussion
Two distinct models have been proposed to explain the multiband light curve of SN 1988Z. One postulates that the supernova exploded in an extremely dense (107 cm-3) medium (Fabian & Terlevich (1996); Aretxaga et al. (1999)). As the supernova shock propagates through such a medium, it loses energy rapidly, and evolves in a matter of years to the ”shell forming,” or radiative stage. Extremely high luminosities are produced as the SN radiates away most of its kinetic energy over decades. The second model postulates propagation of the SN shock through a clumpy medium, formed by an unstable wind from a progenitor star that underwent extreme mass loss (Chugai & Danziger (1994); Williams et al. (2002)). In this case the forward shock propagates rapidly outward, driving slower shocks into the clumps it encounters. X-ray (and radio) emission arises from the shocked clumps. Below we address how the predictions of these two models compare with the Chandra observation and the inferred X-ray light curve.
Aretxaga et al. (1999) provide a capsule summary of the so-called ”compact supernova” model, and compare optical, radio, and X-ray data from SN 19988Z with the model predictions. They show that the light curves in many bands (for the first decade after the explosion) follow trends similar to the model predictions. They also show that the shock velocity, which they infer from the width of the H line, follows the t-5/7 behavior predicted from the model. (We have used this inference above in our estimate of the radius enclosed by the shock.) They predict that the bolometric luminosity should decline as t-11/7. As their model also predicts that the bulk of the luminosity is emitted in the X-ray band, the X-ray luminosity should follow this decay curve. The ROSAT fluxes appear to fit this pattern. They estimate an average density on the order of 107 cm-3.
This model runs into difficulty when it is compared with the extended X-ray light curve. The measured t-2.6±0.6 is not consistent with the prediction. The assumption of a constant density of 107 cm-3 is challenged by the decline in n required by the X-ray flux measurements. A constant density of 107 cm-3 requires a small filling factor that decreases with time (from 3.610-3 at the time of the first ROSAT observation to 1.210-4 at the time of the Chandra observation). If the X-ray emitting gas is confined to a shell, its thickness also decreases, from 21015 cm to 11014 cm. Additionally, the model is inconsistent with the late-time radio spectrum, which shows little free-free absorption (Williams et al., 2002) from the intervening material composing the cocoon in which the supernova exploded.
There are two ways to potentially reconcile these difficulties. First, it is conceivable that the bulk of the luminosity has shifted out of the X-ray band. This is not likely, based on the inferred shock velocity from the H line width measurements. Even if the velocity is overestimated by a factor of two at the time of the Chandra measurement, the bulk of the emission should still arise in the X-ray band. Second, it is possible that the supernova shock has encountered a change in the average medium density. This possibility cannot be ruled out, given the small number of measurements postdating Aretxaga et al. (1999). For instance, it is possible that the shock recently broke through the dense cocoon into a low-density medium. In that case, the X-ray light curve, which until the Chandra observation could be characterized by a -11/7 slope, might show a pronounced break. If the change occurred at day 4500, roughly midway between the final ROSAT and the Chandra observations, then the light curve from day 4500 to the Chandra observation would have and extremely steep decline: LX t-7. The two steepest light curves observed are those of this remnant and SN 1970G (Immler & Kuntz, 2005). Therefore, while the Chandra flux measurement does not exclude the compact supernova model, the required steep late-time decline entails significant modification of the model.
Williams et al. (2002) champion the alternative model, whereby the high radio luminosity is produced by slow shocks driven into dense clumps of wind material. They assume a constant shock velocity through the interclump medium (20,000 km s-1, as was observed early in the evolution of SN 1988Z –Turatto et al. (1993)). Using this assumption, and the theoretical framework of Chugai & Danziger (1994), they interpret the radio light curve as arising from a medium with a low cloud number density (filling factor). They quantify neither the filling factor, nor the density of the clumps or interclump medium, but they infer a mass loss rate of 1.210-4 M0 yr-1, and a corresponding /wwind = 7.31013 g cm-1.
The key observation driving this interpretation is that the radio light curve between days 1750 and 5000 has a -2.7 slope. This slope is essentially identical to the X-ray decline between days 2355 and 5678. While SN radio and X-ray light curves are generally correlated, and all X-ray supernovae are detected in the radio, none has been observed to have exactly the same slope (Immler & Kuntz (2005)). In fact, the X-ray light curve should have a shallower slope. Since the X-ray and H fluxes depend on n while the radio light curve depends on n, the X-ray light curve should follow the H light curve, which Williams et al. (2002) show is consistent with a -2.1 slope. For our case, since the filling factor decreases while the volume increases with time, a simple interpretation might be a shock running through a clumpy medium. Based on the clumpy medium model, a light curve with slope -2.1 is marginally consistent with the X-ray data.
As a matter of interest, Williams et al. (2002) show that the radio and H light curves steepened significantly after day 1750. They interpret this steepening as evidence for a decrease in the number density of clumps. As none of the X-ray observations were performed before day 1750, we do not know whether the X-ray light curve also changed slope. Whatever the physical reason behind it might be, the fact that one slope change has been observed, however, supports the possibility of a second steepening during the last few years. All the observations listed in Williams et al. (2002) were performed before day 4500. If we assume that the X-ray light curve followed a -2.1 slope until that time (allowed by the ROSAT fluxes), and then decreased more rapidly after that date, then a slope of at least -2.8 is required for consistency with the Chandra flux point, which corresponds to a radio slope of -3.9. Again, no X-ray light curve this steep has ever been measured.
In summary, neither model is consistent with all of the observations. Aretxaga et al. (1999) assume a dense, uniform shell. This should result in self-absorption of the radio emission which becomes smaller with time. Williams et al. (2002) show that the self-absorption is small, and constant, suggesting radio emission is not being produced within a dense cocoon. If the intense UV and X-ray radiation keep this material ionized, then little or no intrinsic absorption of soft X-rays might be detected at this time. The highest allowed column density from the quantile analysis is 51022 of neutral material. Williams et al. (2002), on the other hand, assume a constant, high shock velocity of 20,000 km s-1. This is not consistent with the smooth velocity decline suggested by the H width. From the X-ray standpoint, the light curve is at odds with both models. Both predict flatter X-ray decays than observed: -11/7, and -2.1 compared with the measured -2.6. But the current X-ray observations do not rule out either model.
The ambiguity presented by the limited X-ray data could be largely removed by a single additional observation. Such an observation will show whether the light curve has a shallower average slope than inferred from the existing X-ray observations, continues to track the -2.6 slope, or steepened after the ROSAT observations. If the slope is flatter, then it could support either model and possibly provide a discriminator between them, depending on whether it is closer to the -11/7 predicted by the compact supernova model or -2.1 predicted by the clump model. As described above, a change in slope could rescue either model, but would require a change in the properties of the medium being encountered by the shock. If the slope is constant at -2.6, then a different model must be sought which explains the X-ray light curve in the context of the numerous other observations. Additionally, radio observations are needed to show whether the X-ray and radio light curves continue to follow each other.
It is possible to compare the inferred density profile with those of other X-ray emitting SNe. Immler et al. (2005) plot the density profiles for several X-ray SNe, and show333Note that in the cited paper, the density is represented by ; we made the change to conform to our notation. that r-s, where s ranges between 1 and 2. The inferred density (or more precisely ) follows a r-1.3 profile, entirely within this range. In calculating their density profiles, Immler et al. (2005) assume a constant shock velocity. In contrast to this assumption, we have assumed that the shock velocity profile of SN 1988Z is known, and that the shock decelerates. A comparison with the inferred density for, e.g., SN 1979C indicates that its inferred density range is comparable to the range of for SN 1988Z. This could be interpreted as suggesting that the actual density is substantially higher, and thus is much less than unity (or that the shock velocity decreases in the other SNe, leading to different density profiles).
5 Conclusions
An ACIS observation yields a clear detection of SN 1988Z 16 years after discovery, and a decade after the first X-ray detection. Although limited spectral information is available, the X-ray light curve constructed using this observation and the three archival ROSAT observations yields a flux decline proportional to t-2.6±0.6. This decline is steeper than predicted by either of the two prominent competing models. The inferred density is high, larger than 105 cm-3, indicating a massive envelope around the progenitor, and requiring rapid evolution of the X-ray emitting plasma. If the circumstellar envelope is the result of presupernova mass loss, a very high mass loss rate is required, as might be expected from this, the most X-ray luminous supernova. An additional observation can potentially discriminate between the two competing models, or require a new model.
References
- Chandra Proposers’ Guide (2002) Chandra Proposers’ Guide, Rev 5.0 (Cambridge, MA: Chandra X-ray Center)
- Aretxaga et al. (1999) Aretxaga, I., Benetti, S., Terlevich, R. J., Fabian, A. C., Cappellaro, E., Turatto, M., & Della Valle, M. 1999, MNRAS, 309, 343
- Barbon, Cappellaro, & Turatto (1989) Barbon, R., Cappellaro, E., & Turatto, M. 1989, A&AS, 81, 421
- Burstein & Heiles (1982) Burstein, D. & Heiles, C. 1982, AJ, 87, 1165
- Cappellaro, Turatto, & Candeo (1988) Cappellaro, E., Turatto, M., & Candeo, G. 1988, IAU Circ. 4691
- Chevalier & Fransson (1994) Chevalier, R. & Fransson, C. 1994, ApJ, 420, 268
- Chevalier & Fransson (2004) Chevalier, R. & Fransson, C. 2004, in Supernovae and Gamma-Ray Bursters, ed. K. Weiler, (New York: Springer-Verlag), 171
- Chevalier (1974) Chevalier, R. 1974, ApJ, 188, 501
- Chugai & Danziger (1994) Chugai, N. N., & Danziger, I. J. 1994, MNRAS, 268, 173
- Davis (2001) Davis, J. E. 2001, ApJ, 562, 575
- Draine & Woods (1991) Draine, B. T. & Woods, D. T. 1991, ApJ, 383, 621
- Fabian & Terlevich (1996) Fabian, A. C. & Terlevich, R. J. 1996, MNRAS, 280, L5
- Filippenko (1989) Filippenko, A. V. 1989, IAU Circ 4713
- Freedman et al. (2001) Freedman, W. L., et al. 2001, ApJ, 553, 47
- Garmire et al. (2003) Garmire, G. P., Bautz, Mark W., Ford, Peter G., Nousek, John A., & Ricker, George R., Jr., SPIE, 4851, 28
- Heathcote, Cowley, & Hartwick (1988) Heathcote, S., Cowley, A., & Hartwick, D. 1988, IAU Circ. 4693
- Hong, Schlegel, & Grindlay (2004) Hong, J. S., Schlegel, E. M., & Grindlay, J. 2004, ApJ, 614, 508
- Immler et al. (2005) Immler, S., et al. 2005, ApJ, 682, 283
- Immler & Kuntz (2005) Immler, S., & Kuntz, K. D. 2005, ApJ, 632, L99
- Immler & Lewin (2003) Immler, S. & Lewin, W. 2003, in Supernovae and Gamma-Ray Bursters, ed. K. Weiler, (New York: Springer-Verlag), 91
- Liedahl et al. (1992) Liedahl, D. A., Kahn, S. M., Osterheld, A. L., & Goldstein, W. H. 1992, ApJ, 391, 306
- Mewe et al. (1985) Mewe, R., Gronenschild, E. H. B. M., & van den Oord, G. H. J. 1985, A&AS, 62, 197
- Pollas (1988) Pollas, C. 1988, IAU Circ. 5112
- Pooley & Lewin (2003) Pooley, D. & Lewin, W. H. G. 2003, Astronomer’s Telegram 116
- Predehl & Schmitt (1995) Predehl, P. & Schmitt, J. H. M. M. 1995, A&A, 293, 889
- Raymond, Cox, & Smith (1976) Raymond, J. C., Cox, D. P., & Smith, B. W. 1976, ApJ, 204, 290
- Schlegel, Finkbeiner, & Davis (1998) Schlegel, D. J., Finkbeiner, D., & Davis, M. 1998, ApJ, 500, 525
- Schlegel (2005) Schlegel, E. M., in Populations of High-Energy Sources in Galaxies, IAU Symp. 230, ed. E. J. Meurs, in press
- Schlegel (1995) Schlegel, E. M. 1995, Rep. Prog. Phys., 58, 1375
- Schlegel (2001) Schlegel, E. M. 2001, 2001ApJ, 556, L255
- Schlegel et al. (2004) Schlegel, E. M., Kong, A., Kaaret, P., Di Stefano, R., & Murray, S. S. 2004, ApJ, 603, 644
- Schlegel (1990) Schlegel, Eric M. 1990, MNRAS, 244, 269
- Shull (1980) Shull, J. M. 1980, ApJ, 237, 769
- Spergel et al. (2003) Spergel, D. N., et al. 2003, ApJS, 148, 175
- Terlevich et al. (1992) Terlevich, R. J., Tenorio-Tagle, G., Franco, J., & Melnick, J. 1992, MNRAS, 255, 713
- Turatto et al. (1993) Turatto, M.,Cappellaro, E., Dandiger, I. J., Benetti, S., Gouiffes, C., & Della Valle, M. 1993, MNRAS, 262, 128
- Van Dyk et al. (1993) Van Dyk, S. D., Sramek, R. A., Weiler, K. W., Panagia, N. 1993, ApJ, 419, 69
- Weiler, Panagia, & Sramek (1990) Weiler, K. W., Panagia, N. & Sramek, R. A. 1990, ApJ, 364, 611
- Wheeler, Mazurek, & Sivaramakrishnan (1980) Wheeler, J. C., Mazurek, T. J., & Sivaramakrishnan, A.. 1992, ApJ, 237, 781
- Williams et al. (2002) Williams, C. L., Panagia, N., Van Dyk, S. D., Lacey, C. K., Weiler, K. W., & Sramek, R. A. 2002, ApJ, 581, 396
- Zimmermann & Aschenbach (2003) Zimmermann, H.-U., & Aschenbach, B. 2003, A&A, 406, 969
| D | NH | Inferred LXaaFor the bandpass of 0.2-2 keV. | |||
|---|---|---|---|---|---|
| Authors | H0 | Mpc | cm-2 | Model | erg s-1 |
| Fabian & Terlevich (1996) | 50 | 131 | 31020 | 1 keV bremss | 11041 |
| 5 keV bremss | 21041 | ||||
| Aretxaga et al. (1999) | 50 | 131 | 2.51020 | 1 keV bremss | 81040 |
| This paper | 72 | 93 | 1.41020 | 5 keV MeKaL | 3.41040 |
| Net | ||
|---|---|---|
| Band | Counts | RateaaUnits = 10-4 counts s-1. |
| 0.2-2.0 | 29.86.82 | 6.681.53 |
| 0.3-2.0 | 30.46.82 | 6.811.53 |
| 0.3-10.0 | 37.47.71 | 8.381.73 |
| 0.5.2.0 | 29.66.60 | 6.641.49 |
| 2.0-10.0 | 7.75.13 | 1.731.15 |
| Count | FluxddAll fluxes in 0.2-2.0 or 0.5-2 keV band with units of 10-14 erg s-1 cm-2. Adopted model is an absorbed vmekal, kT = 5.0 keV, NH = 1.41020 cm-2. For the HRI values, fluxes were computed from the model after adjusting the model normalization to match the observed count rate. | LuminosityeeLuminosity units are 1040 erg s-1 for 0.2-2.0 keV band. | ||||||
|---|---|---|---|---|---|---|---|---|
| Detector | Obs. DateaaMJD at center of observation when spanning multiple days; those observations are footnoted. | MJD | Agebbunits = days; based upon adopted date of maximum = 1988 Dec 12 = MJD 47508. | ExpT | RateccUnits are 10-4 sec-1 for 0.2-2.4 keV band. | 0.2-2.0 | 0.5-2.0 | 0.2-2.0 |
| HRI | 1995 May 16-25aaMJD at center of observation when spanning multiple days; those observations are footnoted. | 49884 | 2335 | 12287 | 114 | 3.92 | 2.75 | 3.4 |
| HRI | 1996 Dec 14aaMJD at center of observation when spanning multiple days; those observations are footnoted. | 50725 | 2924 | 6739 | 54 | 1.78 | 1.25 | 1.5 |
| HRI | 1997 May 13-24aaMJD at center of observation when spanning multiple days; those observations are footnoted. | 50908 | 3085 | 34300 | 3.72 | 1.32 | 0.92 | 1.15 |
| ACIS | 2004 Jun 29 | 50908 | 5678 | 44618 | 6.71.5 | 0.36 | 0.25 | 0.27 |
| AgeaaMJD at center of observation when spanning multiple days; those observations are footnoted. | VelocitybbEstimated using velocity profile in Aretxaga et al. (1999). | RadiusbbEstimated using velocity profile in Aretxaga et al. (1999). | nVcc is the dimensionless volume filling factor. | n | ddVolume filling factor assuming n=107 cm-3 (Aretxaga et al., 1999). The volume filling factor changes by a factor of 100 for a change in the assumed number density by a factor of 10. | Mx |
|---|---|---|---|---|---|---|
| (days) | (km s-1) | (pc) | (1063 cm-3) | (105 cm-3) | Msun | |
| 2335 | 1900 | 0.044 | 3.4 | 5.7 | 3.210-3 | 4.9 |
| 2924 | 1620 | 0.046 | 1.4 | 3.4 | 1.210-3 | 3.7 |
| 3085 | 1560 | 0.047 | 1.15 | 3.0 | 9.110-4 | 3.2 |
| 5678 | 1010 | 0.056 | 0.27 | 1.1 | 1.210-4 | 2.1 |
6 Figures