Hypernova Signatures in the Late Rebrightening of GRB 050525A
Abstract
We report observations of GRB 050525A, for which a Gemini North spectrum shows its redshift to be . This is the third closest long GRB discovered by Swift. We observed its afterglow using the VLT, Gemini and TNG telescopes to search for an associated SN. We find that the early-time light curve is described by a broken power law with a break at d after the burst. About 5 d after the burst, a flattening is apparent, followed by a further dimming. Both the magnitude and the shape of the light curve suggest that a supernova was emerging during the late decay of the afterglow. This supernova, dubbed SN 2005nc, had a rise time faster than SN 1998bw and a long-lasting maximum. A spectrum obtained about 20 d (rest-frame) after the GRB resembles the spectrum of SN 1998bw obtained close to maximum light.
Subject headings:
gamma rays: bursts — supernovae: individual (GRB 050525A)1. Introduction
In nearly one decade of optical and infrared studies of gamma-ray bursts (GRBs), it has been established that at least a large fraction of long-duration GRBs is directly connected with the death of massive stars. Most evidence arises from observations of supernova (SN) features in the spectra of a handful of GRB afterglows. Examples of the spectroscopic SN/GRB connection include SN 1998bw/GRB 980425 (Galama et al. 1998), SN 2003dh/GRB 030329 (Stanek et al. 2003; Hjorth et al. 2003), SN 2003lw/GRB 031203 (Malesani et al. 2004), SN 2002lt/GRB 021211 (Della Valle et al. 2003), XRF 020903 with a broad-line type-Ib/c SN (Soderberg et al. 2005), and the recent SN 2006aj/GRB 060218 (Masetti et al. 2006; Fatkthullin et al. 2006; Campana et al. 2006; Modjaz et al. 2006). In addition there are about a dozen afterglows which show rebrightenings and/or flattenings in their light curve days to weeks after the gamma-ray event (e.g. Bloom et al. 1999; Zeh et al. 2004). These bumps are interpreted as due to the emergence of SN. Most of these studies are based upon photometric data, due to the extreme faintness of late-time afterglows. There is some evidence that the population of SNe associated with GRBs is quite heterogeneous: several bumps have light curves which are well matched by faint SNe (e.g. GRB 011121: Garnavich et al. 2003, Bloom et al. 2002; XRF 030723: Fynbo et al. 2004; GRB 020410: Levan et al. 2005; XRF 040701: Soderberg et al. 2005), rather than bright “hypernovae” such as SN 1998bw. However, only spectroscopic observations can definitely assess the degree of “diversity” among GRB progenitors. Moreover, dust echos (e.g. Esin & Blandford 2000; Waxman & Draine 2000) can produce red late-time ‘rebrightenings’ resembling SN bumps, and spectroscopy is the most effective way to identify their nature. Despite the intense interest in detailing the diversity of GRB-SNe, only one association with a Swift burst has been reported to date (GRB 060218/SN 2006aj). This is very likely due to the higher redshifts of Swift bursts (; Jakobsson et al. 2006) compared with pre-Swift events. In particular, only about 10% of the almost 100 Swift bursts have occured at redshift less than one. At redshifts , SNe are almost impossible to detect with current instrumentation. Thus, the discovery of low-redshift GRBs is a critical gateway for the study of GRB-SNe. In this Letter, we detail the measurement of the redshift of GRB 050525A and present the discovery of an extra component in its late afterglow, together with spectroscopic evidence for an associated SN. This SN was dubbed SN 2005nc (Della Valle et al., 2006).
2. GRB 050525A
The long-duration GRB 050525A was discovered by the Swift satellite (Gehrels et al. 2004) on 2005 May 25.002 UT (Band et al. 2005). It was a bright event, with fluence erg cm-2 and duration s (this is the time during which 90% of the photons are collected). The burst was observed also by numerous other satellites (INTEGRAL: Götz et al. 2005; Wind: Golenetskii et al. 2005; RHESSI; Mars Odyssey), allowing for a detailed study of the high energy prompt emission spectrum. The optical afterglow was soon discovered by the ROTSE-III robotic telescope (Rykoff et al. 2005a), as a bright, fading source at , (Rykoff et al. 2005b). The optical and X-ray counterparts were also monitored in great detail by the X-Ray Telescope (XRT) and the Ultraviolet/Optical Telescope (UVOT) onboard Swift (Blustin et al. 2005). The brightness of the afterglow allowed an intense monitoring of this object, from optical (e.g. Klotz et al. 2005; Mirabal et al. 2005) to radio frequencies (Cameron & Frail 2005), including the first detection of a GRB at mid-infrared wavelengths (3.6 to 24 m; Garnavich et al. 2005).
3. Observations and Data Analysis
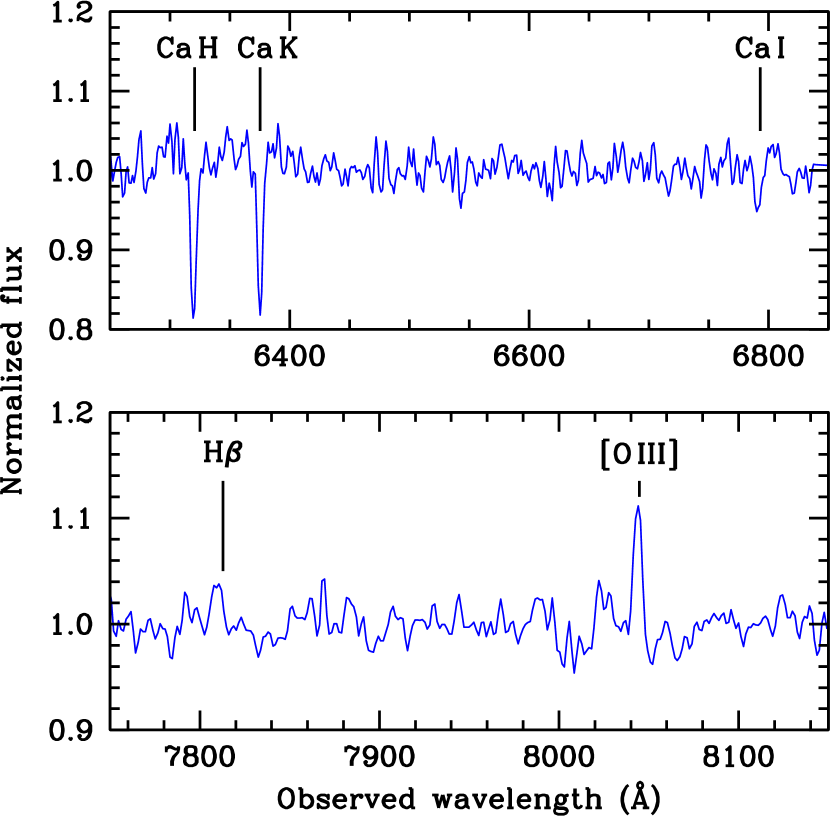
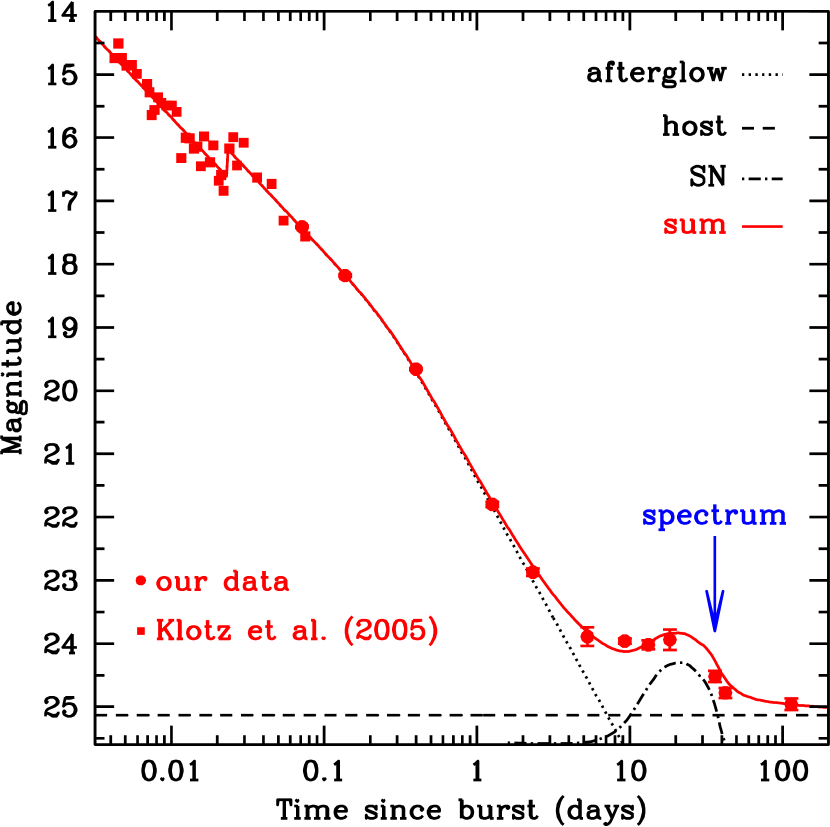
A spectrum of the afterglow was obtained with the Gemini North telescope equipped with the GMOS instrument. The spectroscopic redshift was measured through both emission and absorption lines, yielding (Foley et al. 2005; see also Fig. 1). This is at the low end of the GRB redshift distribution (Bloom et al. 2003, Berger et al. 2005, Jakobsson et al. 2006) and is the third lowest redshift Swift long-duration GRB aside GRB 050803 (Bloom et al. 2006) and the recent GRB 060218 (Mirabal & Halpern 2006). This event therefore presents a good opportunity for detailed analysis and modelling. We observed the optical afterglow of GRB 050525A with the VLT and TNG telescopes, during the period 2005 May-September (from a few hours up to d after the gamma-ray event, see Fig. 2). Data reduction was carried out following standard procedures. The photometric calibration was achieved by observing several standard star fields on different nights, yielding a zeropoint accuracy of mag. Photometric data (Fig. 2) show a flattening of the light curve at , starting about 5 d after the burst (observer rest frame) and lasting for about 20 d. The contribution of the host galaxy during this phase is , as estimated from our late-epoch images which show the host magnitude is fainter than . The afterglow contribution, as extrapolated from the earlier measurement, is negligible at these epochs ( at 20 d after the GRB). This fact suggests that the flattening is powered by an additional source of energy. To further quantify this, we fitted the observed light curve including the contribution from the afterglow (a broken power law), the host galaxy, and a SN component:
| (1) |
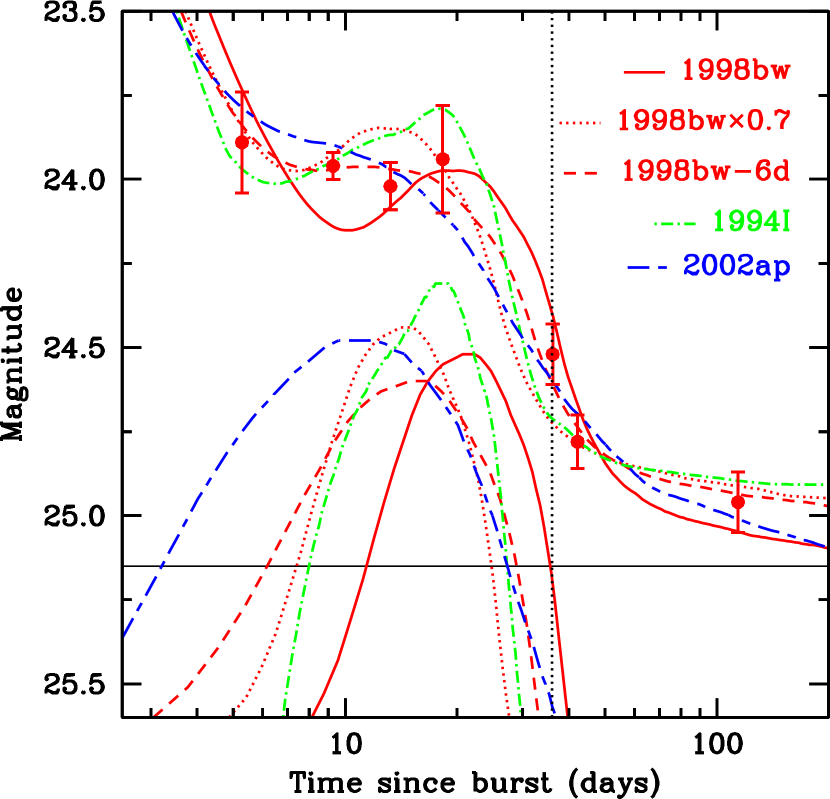
Here , (the early- and late-time slopes) and (the break time) characterize the afterglow decay ( determines how sharp is the break). and are the host galaxy and the SN flux, respectively. We allowed for a time offset between the SN and the GRB, for a temporal stretch in the light curve, and for a magnitude difference. For the SN flux, we adopted the light curves of several type-Ic SNe (SN 1998bw: Galama et al. 1998; SN 2002ap: Yoshii et al. 2003, Pandey et al. 2003, Gal-Yam et al. 2002, Foley et al. 2003; SN 1994I: Richmond et al. 1996). Our approach is similar to that adopted by Zeh et al. (2004). The afterglow component is well fitted with , , and d. Interpreting the break as due to a jet effect, this value of makes GRB 050525A consistent with the Ghirlanda relation (Ghirlanda et al. 2004; Nava et al. 2005). In Fig. 2, the solid line shows the best fit using SN 1998bw as a template, dimmed by 0.9 mag. The Galactic extinction towards GRB 050525A is mag (Schlegel et al. 1998). The extinction inside the GRB host is uncertain. Blustin et al. (2005) suggest assuming an SMC extinction curve, so that the observed band (roughly corresponding to the rest-frame ) suffers an additional mag. This implies that the SN associated with GRB 050525A may have a luminosity just about 0.3 mag fainter than SN 1998bw. However fits of comparable quality (both in terms of visual appearance and ) can be obtained by assuming other SN templates. Figure 3 shows fits obtained with the hypernova SN 2002ap (brightened by 1.3 mag) and the “standard” type-Ic SN 1994I (brightened by 1.8 mag). Finally, we note that the best matches to the data points are obtained by allowing a time offset between a 1998bw-like SN and the GRB of d (corresponding to d in the GRB rest frame) or a time stretch factor . These fits reproduce the flat shape of the rebrightening. A more exotic scenario calls for the effect of a light echo. Indeed, sudden flattenings have been observed in the light curves of SNe due to the occurrence of light-echo components (e.g. Schmidt et al. 1994; Cappellaro et al. 2001; Quinn et al. 2006, in preparation) during the late SN decline. However in these cases the flattenings were characterized by much longer evolutionary time scales (700 d) than is observed for GRB afterglow bumps (–20 d). In the SN 1991T echo-light, the spectrum at late stages was similar to that emitted by the SN at maximum light, although about 10 mag fainter. In our case, if the bump was due to an echo, we would expect to observe, in the spectrum obtained during the flattening, the signatures (at considerably fainter level of luminosity) of the very early optical afterglow. All of this indicates that a good set of photometric data alone may not constrain the SN type unambiguously. This task can be tackled only by means of spectroscopic observations.
4. Spectroscopy
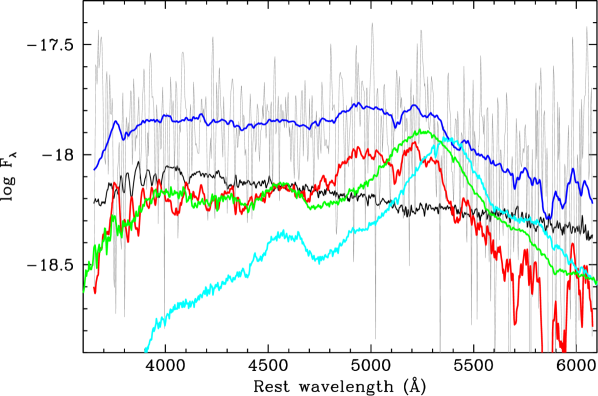
A spectrum was obtained at the ESO VLT-UT1 with the FORS 2 instrument on 2005 Jun 28 (36 d after the burst, observer frame). The original spectrum ( min integration) covered the range 5000–10000 Å with a resolution of Å. The extraction of the spectrum was performed inside the IRAF and MIDAS environments. This spectrum, shown in the rest-frame of the GRB as a grey line (Fig. 4), was smoothed with a 100 Å wide boxcar filter (blue line) and cleaned from the host galaxy emission features. As indicated by the light curve, this spectrum contains a significant contribution from the host galaxy. We thus subtracted from our spectrum a template of a blue star-forming galaxy (black line), normalized to the host brightness and color. The use of a template (average of 70 blue star-forming galaxies, from Cimatti et al. 2002), was necessary due to the faintness of the host galaxy. An unsuccessful attempt to get its spectrum with VLT was made on 2005 Oct 1. This observation allowed us to set a robust upper limit to the magnitude of the host (). The use of a blue star-forming galaxy template is fully justified by several studies, which allow to conclude that GRB hosts belong to this type of systems (e.g. Djorgovski et al. 1998; Fruchter et al. 1999; Le Floc’h et al. 2003; Christensen et al. 2004). The resulting spectrum (red line) is characterized by broad undulations resembling the spectra of SN 1998bw (Patat et al. 2001), obtained d past maximum (green line). The best match is obtained by dimming SN 1998bw by mag111The use of a template slightly brighter or fainter than shifts the date of the best match with SN 1998bw by about 2 d later and earlier, respectively.. The bump at Å has some contribution from residuals of sky emissions that we were unable to remove. For comparison, we also show the spectrum of SN 1998bw d past maximum (cyan line). Inspection of Fig. 4 reveals a poor match with the observed data, suggesting that SN 2005nc was not far from maximum when the spectrum was acquired. This result does not support the best fit to the photometric data, which suggested either a time lag between the SN and the GRB or a stretch factor . Indeed, in these cases the spectrum would have been obtained about 10 d (rest frame) past maximum, which is excluded by spectroscopic observations (see Fig. 4). Spectra of SN 1994I (Filippenko et al. 1995) obtained close to maximum light also do not match the observed spectrum.
5. Discussion
Photometric and spectroscopic observations of the rebrightening associated with GRB 050525A support the idea that the bump was powered by an emerging SN (SN 2005nc). While photometric data alone are consistent (within the errors) with different SN morphologies (based on either SN 1998bw, SN 2002ap, or SN 1994I templates), the analysis of the spectrum obtained during the bump allowed us to select a SN akin to SN 1998bw as the best match, possibly dimmed by mag. The flat shape of the bump light curve implies that SN 2005nc brightened relatively quickly after the GRB, with a rise time –12 d in the band (for SN 1998bw, ). This can be explained either by introducing a significant stretch factor () or a time lag between the SN and the GRB. Both possibilities would imply that at the epoch of our spectrum (36 d after the GRB) the SN provided a very small contribution to the observed light. This is inconsistent with our observations, which suggest that the SN and the host galaxy had comparable brightness () at that epoch. We thus conclude that SN 2005nc had a different light curve from the templates we adopted. Differences among GRB-SNe were noticed before the present study (e.g. Cobb et al. 2004). We find that the SN associated with 050525A had a faster rise than SN 1998bw, but that it was characterized by a broader, long-lasting maximum. On the other hand Maeda et al. (2005) showed that asymmetric SNe peak earlier if observed close to their polar axis. GRB 050525A was a bright event, likely observed on-axis. On the contrary, SN 1998bw may have been observed off-axis (Yamazaki et al. 2003), so that an earlier peak for SN 2005nc could be expected in this scenario. In spite of the putative existence of a broad range in the magnitudes at maximum of SNe associated with GRBs, all GRB-associated SNe which have so far had spectroscopic confirmation (see Della Valle 2006 and Woosley & Bloom 2006 for reviews) appear to belong to the bright tail of the type-Ib/c SN population (all objects mentioned in the Introduction have ). Whether this is the effect of an observational bias (which favors the spectroscopic observations of bright SNe) operating on a small number of objects, or whether it has a deeper physical meaning is not yet clear. In this paper we have found a new case of association between a GRB and a bright hypernova, both on robust photometric grounds and spectroscopic evidence. On the other hand to prove beyond doubt the existence of a class of GRB-associated SNe having spectroscopic properties dramatically different from those exhibited by the prototypical hypernova SN 1998bw still remains one of the most important observational challanges for the SN/GRB community, that Swift will hopefully allow us to address in the near future.
M.D.V. thanks KITP at UCSB, where this work was completed, for its hospitality. This research was supported in part by the National Science Foundation under Grant No. PHY99-0974. J.S.B., J.X.P., and H.-W.C. are partially supported by NASA/Swift grant NNG05GF55G. K.H. is grateful for support under NASA grant FDNAG5-9210. Based on observations obtained at ESO, TNG and Gemini Observatories. We wish to extend special thanks to those of Hawaiian ancestry on whose sacred mountain we are privileged to be guests.
References
- Band et al. (2005) Band, D., et al. 2005, GCN Circ. 3466
- Berger & Soderberg (2005) Berger, E., & Soderberg, A. 2005, GCN Circ. 4384
- Bloom et al. (1999) Bloom, J. S., et al. 1999, Nature, 401, 452
- Bloom et al. (2002) Bloom, J. S., et al. 2002, ApJ, 572, L45
- Bloom et al. (2003) Bloom, J. S., Frail, D. A., & Kulkarni, S. R. 2003, ApJ, 594, 674
- Bloom et al. (2006) Bloom, J.S., Perley, D., Foley, R., Prochaska, J.X., Chen, H.-W., & Starr, D. 2006, GCN Circ 3758
- Blustin et al. (2005) Blustin, A. J., et al. 2006, ApJ, 637, 901
- Cameron & Frail (2005) Cameron, P. B., & Frail, D. A. 2005, GCN Circ. 3495
- Campana et al. (2006) Campana, S., et al. 2006, Nature, submitted (astro-ph/0603279)
- Cappellaro et al. (2001) Cappellaro, E., et al. 2001, ApJ, 549, L215
- Christensen et al. (2004) Christensen, L., Hjorth, J., & Gorosabel, J. 2005, A&A, 425, 913
- Cimatti et al. (2002) Cimatti, A., et al. 2002, A&A, 381, L68
- Cobb et al. (2004) Cobb, B. E., Bailyn, C. D., van Dokkum, P. G., Buxton, & M. M., Bloom, J. S. 2004, ApJ, 608, L93
- Della Valle et al. (2003) Della Valle, M., et al. 2003, A&A, 406, L33
- Della Valle (2005) Della Valle, M. 2006, Il Nuovo Cimento, 28, 563 (astro-ph/0504517)
- Della Valle et al. (2006) Della Valle, M., Malesani, D., Benetti, S., Chincarini, G., Stella, L., & Tagliaferri, G. 2006, IAUC 8696
- Djorgovski et al. (1998) Djorgovski, S. G., Kulkarni, S. R., Bloom, J. S., Goodrich, R., Frail, D. A., Piro, L., & Palazzi, E. 1998, ApJ, 508, L17
- Esin & Blandford (2000) Esin, A. A., & Blandford, R. 2000, ApJ, 534, L151
- Fatkthullin et al. (2006) Fatkthullin, T.A., et al. 2006, GCN Circ 4809
- Filippenko et al. (1995) Filippenko, A., et al. 1995, ApJ, 450, L11
- Foley et al. (2003) Foley, R. J., et al. 2003, PASP, 115, 1220
- Foley et al. (2005) Foley, R. J., Chen, H.-W., Bloom, J. S., & Prochaska, J. X. 2005, GCN Circ. 3483
- Fruchter et al. (1999) Fruchter, A. S., et al. 1999, ApJ, 519, L13
- Fynbo et al. (2004) Fynbo, J. P. U., et al. 2004, ApJ, 609, 962
- Galama et al. (1998) Galama, T. J., et al. 1998, Nature, 395, 670
- Gal-Yam et al. (2002) Gal-Yam, A., Ofek, E. O., & Shemmer, O. 2002, MNRAS, 332, L73
- Garnavich et al. (2003) Garnavich, P. M., et al. 2003, ApJ, 582, 924
- Garnavich et al. (2005) Garnavich, P. M., et al. 2005, GCN Circ. 3532
- Gehrels et al. (2004) Gehrels, N., et al. 2004, ApJ, 611, 1005
- Ghirlanda et al. (2004) Ghirlanda, G., Ghisellini, G., & Lazzati, D. 2004, ApJ, 616, 331
- Golenetskii et al. (2005) Golenetskii, S., Aptekar, R., Mazets, S., Pal’shin, V., Frederiks, D., & Cline, T. 2005, GCN Circ. 3474
- Götz et al. (2005) Götz, D., Mereghetti S., Mowlavi, N., Shaw, S., Beck, M., Borkowski, J., & Lund, N. 2005, GCN Circ. 3472
- Hjorth et al. (2003) Hjorth, J., et al. 2003, Nature, 423, 847
- Jakobsson et al. (2006) Jakobsson, P., et al. 2006, A&A, 447, 897
- Klotz et al. (2005) Klotz, A., Boër, M., Atteia, J. L., Stratta, G., Behrend, R., Malacrino, F., & Damerdji, Y. 2005, A&A, 439, L35
- Le Floc’h et al. (2003) Le Floc’h, E., et al. 2003, A&A, 400, 499
- Levan et al. (2005) Levan, A., et al. 2005, ApJ, 624, 880
- Maeda et al. (2005) Maeda, K., Mazzali, P. A., & Nonoto, K. 2005, ApJ, in press (astro-ph/0511389)
- Malesani et al. (2004) Malesani, D., et al. 2004, ApJ, 609, L5
- Masetti et al. (2006) Masetti, N., Palazzi, E., Pian, E., & Patat, F. 2006, GCN Circ 4803
- Mirabal et al. (2005) Mirabal, N., Bonfield, D., & Schawinski, K. 2005, GCN Circ. 3488
- Mirabal et al. (2006) Mirabal, N., Halpern, J., An, D., Thorstensen, J. R., & Terndruf, D. M. 2006, ApJL, submitted
- Modjaz et al. (2006) Modjaz, M. 2006, ApJL, submitted (astro-ph/0603377)
- Nava et al. (2005) Nava, L., Ghisellini, G., Ghirlanda, G., Tavecchio, F., & Firmani, C. 2005, A&A, in press (astro-ph/0511499)
- Pandey et al. (2003) Pandey, S. B., Anupama, G. C., Sagar, R., Bhattacharya, D., Sahu, D. K., & Pandey, J. C. 2003, MNRAS, 340, 375
- Patat et al. (2001) Patat, F., et al. 2001, ApJ, 555, 900
- Richmond et al. (1996) Richmond, M. W., et al. 1996, AJ, 111, 327
- Rykoff et al. (2005a) Rykoff, E., Yost, S. A., & Swan, H. 2005a, GCN Circ. 3465
- Rykoff et al. (2005b) Rykoff, E., Yost, S. A., Swan, H., & Quimby, R. 2005b, GCN Circ. 3468
- Schlegel et al. (1998) Schlegel, D. J., Finkbeiner, D. P., & Davis, M. S. 1998, ApJ, 500, 525
- Schmidt et al. (1994) Schmidt, B. P., Kirshner, R. P., Leibundgut, B., Wells, L. A., Porter, A. C., Ruiz-Lapuente, P., Challis, P., & Filippenko, A. V. 1994, ApJ, 434, L19
- Soderberg et al. (2005) Soderberg, A. M., et al. 2005, ApJ, 627, 877
- Stanek et al. (2003) Stanek, K. Z., et al. 2003, ApJ, 591, L17
- Waxman & Draine (2000) Waxman, E., & Draine, B. T. 2000, ApJ, 537, 796
- Woosley & Bloom (2006) Woosley, S., & Bloom., J. S. 2006, ARA&A, submitted
- Yamazaki et al. (2003) Yamazaki, R., Yonetoku, D., & Nakamura, T. 2003, ApJ, 594, L79
- Yoshii et al. (2003) Yoshii, Y., et al. 2003, ApJ, 592, 467
- Zeh et al. (2004) Zeh, A., Klose, S., & Hartmann, D. H. 2004, ApJ, 609, 952
| Mean time (UT) | Time since GRB (d) | Telescope | Exposure time (s) | Seeing (″) | magnitude |
|---|---|---|---|---|---|
| May 25.073 | 0.072 | TNG+LRS | 2120 | 1.2 | 17.410.02 |
| May 25.139 | 0.137 | TNG+LRS | 2120 | 1.2 | 18.180.02 |
| May 25.402 | 0.400 | VLT+FORS2 | 6120 | 1.1 | 19.660.02 |
| May 26.262 | 1.260 | VLT+FORS2 | 2090 | 0.6 | 21.800.04 |
| May 27.326 | 2.324 | VLT+FORS2 | 2090 | 0.4 | 22.870.06 |
| May 30.280 | 5.278 | VLT+FORS1 | 12180 | 1.0 | 23.890.15 |
| Jun 03.279 | 9.277 | VLT+FORS2 | 10180 | 0.4 | 23.960.04 |
| Jun 07.242 | 13.240 | VLT+FORS1 | 10180 | 0.9 | 24.020.07 |
| Jun 12.302 | 18.300 | VLT+FORS2 | 10180 | 0.6 | 23.940.16 |
| Jun 30.155 | 36.153 | VLT+FORS2 | 2090 | 0.4 | 24.520.09 |
| Jul 06.190 | 42.188 | VLT+FORS2 | 10180 | 0.4 | 24.780.08 |
| Sep 07.121 | 105.119 | VLT+FORS2 | 8240 | 0.5 | 24.960.09 |