11email: battinel@oarhp1.rm.astro.it 22institutetext: Département de Physique, Université de Montréal, C.P.6128, Succursale Centre-Ville, Montréal, Qc, H3C 3J7, Canada
22email: demers@astro.umontreal.ca 33institutetext: Las Campanas Observatory, Casilla 601, La Serena, Chile
33email: kunkel@jeito.lco.cl
Photometric Survey of the Polar ring galaxy NGC 6822††thanks: Based on observations obtained with MegaPrime/MegaCam, a joint project of CFHT and CEA/DAPNIA, at the Canada-France-Hawaii Telescope (CFHT) which is operated by the National Research Council (NRC) of Canada, the Institut National des Sciences de l’Univers of the Centre National de la Recherche Scientifique (CNRS) of France, and the University of Hawaii.
Abstract
Context. We have previously established, from a carbon star survey, that the Local Group dwarf irregular galaxy NGC 6822 is much larger than its central bright core.
Aims. Four MegaCam fields are acquired to survey a 2 2∘ area centred on NGC 6822 to fully determine its extent and map its stellar populations.
Methods. Photometry of over one million stars is obtained in the SDSS g′, r′, i′ to three magnitudes below the TRGB. RGB stars, selected from their magnitudes and colours, are used to map the NGC 6822 stellar distribution up to a distance of 60 arcmin.
Results. We map the reddening over the whole area. We establish that the stellar outer structure of NGC 6822 is elliptical in shape, with and a major-axis PA = 65∘, contrasting with the orientation of the HI disk. The density enhancement can be seen up to a semi-major axis of 36′ making NGC 6822 as big as the Small Magellanic Cloud. We fit two exponentials to the surface density profile of the spheroid, and identify a bulge with a scale length of 3.85′ and an outer spheroid with a scale length of 10.0′. We find intermediate-age C stars up to 40′ while demonstrating that the SDSS filters are unsuitable to identify extragalactic C stars.
Conclusions. NGC 6822 is a unique Local Group galaxy with shape and structure suggesting a polar ring configuration. Radial velocities of carbon stars have indeed demonstrated that there are two kinematical systems in NGC 6822.
Key Words.:
galaxies, individual: NGC 6822 – galaxies: local group – galaxies: structure – stars: carbon1 Introduction
Recent carbon star surveys of Local Group dwarf irregular galaxies (dIrrs) (Letarte et al. 2002; Demers et al. 2004) have demonstrated that some dIrrs are much bigger than assumed from their bright central core. Indeed, the NGC 6822 giant branch is seen up to the edge of the CFHT12k 42 field. Do these extended structures correspond to a huge stellar halo or do we see an extended disk, as reported by Gallart et al. (2004) for the Large Magellanic Cloud? However, in the presence of evidence for disruptive processes on their periphery, galaxies with recent harassment episodes admit a variety of interpretations of what formation mechanisms acted at the peripheries. The LMC is quite big, its stellar populations are spread over some 20 degrees (Irwin 1991; van der Marel 2002), being so close to the Milky Way its structure must have been influenced by the later.
NGC 6822 is also known as Barnard’s galaxy because he discovered it (Barnard 1884) and described it as a 2′ nebula, diffuse and difficult to see with his 5-inch instrument. NGC 6822 is located in the constellation Sagittarius in the direction of the Galactic centre ( = 25∘, b = –18∘). It is thus seen behind a relatively heavy stellar foreground and its reddening is far from negligible. A distance of (m – M)0 = 23.46 0.10 has been obtained from the magnitude of the tip of the red giant branch by Lee et al. (1993). However, recent estimates bring the galaxy slightly closer. Pietrzyński et al. (2004) derived (m – M)0 = 23.34 0.05 from V,I observations of over one hundred Cepheids. The observations of RR Lyrae by Clementini et al. (2003) yields a distance of (m – M)0 = 23.36 0.17. Near infrared observations of the tip of the red giant branch by Cioni & Habing (2005) give (m – M)0 = 23.34 0.12. We adopt a weighted mean of (m – M)0 = 23.35. At 470 kpc, NGC 6822 is the nearest dIrr after the Magellanic Clouds. It is isolated in the Local Group, without close neighbours.
NGC 6822 is one of the few dwarf galaxies surrounded by a huge HI envelope which was first mapped by Roberts (1972) to a density of 9 1019 cm-2. The HI component, recently surveyed by de Blok & Walter (2000a, 2000b), to a sensitivity of 1.6 1019 cm -2, is essentially a disk whose high-resolution rotation curve has been obtained by Weldrake et al. (2003). A photometric survey by Komiyama et al. (2003) revealed the presence of a significant number of young stars throughout the HI disk.
The LMC, a more luminous galaxy, seen at the distance of NGC 6822 would subtend an angular diameter of 2.2∘. It is then reasonable to expect that the overall diameter of NGC 6822 could reach one degree. Since the CFH12k was found to be inadequate to properly establish the extent of NGC 6822, we decided to take advantage of the newly CFHT MegaCam camera to survey the outer parts of NGC 6822.
In Sect. 2 observations are presented. The absorption map over the whole observed region along with the reddening free colour-magnitude and colour-colour diagrams are presented in Sect. 3. The stellar density profile of NGC 6822 is obtained and discussed in Sect. 4.
2 Observations
Our observations consist of images taken with MegaPrime/Megacam in Queue Observing mode in May and June 2004. The wide field imager Megacam consists of 36 2048 4612 pixel CCDs, covering nearly a full 1 field. It is mounted at the prime focus of the 3.66 m Canada-France-Hawaii Telescope. It offers a resolution of 0.187 arcsecond per pixel. Four slightly overlapping fields were observed, the galaxy located at the common corners, to cover essentially a 2 area centred on NGC 6822. Images were obtained through g′, r′ and i′. These filters are designed to match Sloan Digital Sky Survey (SDSS) filters, as defined by the Smith et al. (2002) standards. Exposures times range from 160 s for i′ to 1200 s for g′ to reach i′ = 22, r′ = 23, g′ = 24 with a S/N = 20. The observations were secured under excellent seeing. Two additional Megacam fields, North East and South West of the four central fields, were obtained to better assess the foreground stellar surface density.
The data distributed by the CFHT have been detrended. This means that the images have already been corrected with the master darks, biases, and flats. This pre-analysis produces 36 CCD images, of a given mosaic, with the same zero point and magnitude scale. The photometric reductions were done by Terapix, the data reduction centre dedicated to the processing of extremely large data flow. The Terapix team, located at the Institut d’Astrophysique de Paris, matches and stacks all images taken with the same filter and, using SExtractor (Bertin & Arnouts 1996), provides magnitude calibrated catalogues of objects in each of the combined images. SExtrator classifies objects into star or galaxy but the classification scheme breaks down for faint magnitudes, thus not useful in our case. Furthermore, a flag is attached to each object: flag = 0 corresponds to isolated object not affected by neighbours. As expected, few stars in the central part of NGC 6822 have a flag = 0. In this paper we do not take into account the flags and select the stars according to their photometric errors.
Because the astrometric calibration of the images has been done by the CFHT Service Observing team, we have equatorial coordinates as well as calibrated colours and magnitude for each object in the whole field. The six Megacam fields have been matched and concatenated into three files corresponding to each filter. These files contain approximately one million star each. Many stars have, however, large photometric errors. When the error limit is set to , the numbers in each file are reduced to 650,000. Cross identification of the i′ and r′ file, with a colour requirement of leads to some 650,000 stars while for the three colour file, with we have 500,000. The concatenation of the three files reduces even more the number of stars satisfying these criteria.

3 Results
3.1 The absorption map
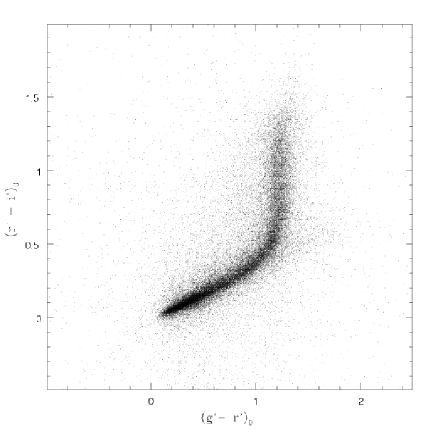
For a wide and relatively low latitude field, a certain variation of the foreground reddening is expected. It is important to take into account differences in the local absorption since they effect directly the number of star detected locally. To determine the reddening variations across our field, we adopt a procedure similar to that recently employed with success for IC 10 by Demers et al. (2004). The basic idea is to compare the observed colour of the vertical ridge, well visible in the CMD shown in Figure 1 at , with its unreddened value. In this figure we display a representative colour-magnitude diagram (CMD) of the foreground toward NGC 6822. This CMD contains 30 000 stars and corresponds to a 59′ 12′ region in the SW foreground field. Only stars with colour error, as given by SExtractor, 0.20 are plotted. Inspection of this CMD is instructive. Stars brighter than i′ 16.5 are saturated; the luminosity function turnoff is at i′ 21.5. The well-defined vertical ridge corresponds to the Galactic G dwarfs, seen along the line of sight, and located at their main sequence turnoff. The unreddened value for the ridge colour, , comes from Smith et al. (2002) transformation of R–I into (r′–i′) and the G dwarf turnoff at (R–I)0 = 0.35 (Cox 2000). As a first step, in the CMD we select only the stars in a vertical strip 0.3 mag wide in colour, centred on the ridge. We select exclusively in the 17.0 i′ 18.5 magnitude interval in order to have a sample mostly consisting of foreground stars because fainter objects would include many unresolved galaxies. The faintest G dwarfs should then be 3 kpc above the plane of the Milky Way.
The whole field is then subdivided into grid points separated by 100 pix and at each such locus the ridge colour is determined within 2000 pix radius centred on the grid intersection. The local reddening value is thus given by . We observe a range in colour for the ridge between 0.24 and 0.32 corresponding to reddening ranging from 0.12 , while the extinction in the band, 0.37. The standard colour excess, E(B–V) varies from 0.19 to 0.30. The global reddening value of E(B–V) = 0.25 adopted by van den Bergh (2000) appears quite reasonable. Values as high as E(B–V) = 0.45 were determined in the NGC 6822 centre, from UBV photometry, by Massey et al. (1995). Our reddening is the foreground reddening and certainly does not apply to the inner parts of NGC 6822.
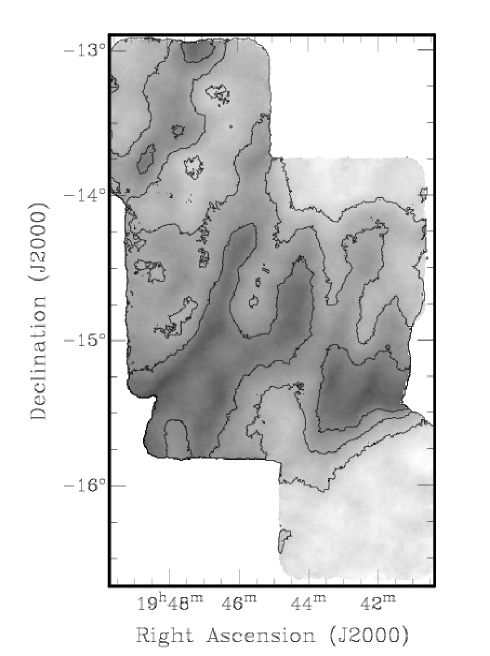
Figure 2 shows the grey-scale foreground extinction towards NGC 6822 along with the iso-absorption contours corresponding to . The reddening in this six degree region is patchy and certainly not negligible. Magnitudes and colours of individual stars are corrected using the absorption map in Fig. 2 and the following relations by Schlegel et al. (1998): and .
3.2 Colour-magnitude diagram
The study of the stellar populations in NGC 6822 is outside the goal of the present paper which is focused on the size and shape of this galaxy. For this reason the CMD is used here only for the selection of a suited subsample of stars to be employed for star counts in Sect. 3.4.

In Figure 3 the reddening corrected CMD of NGC 6822 is shown. The RGB is well visible extending for more than 3 magnitudes. The surface density of foreground stars in the direction of NGC 6822 is quite high and therefore, to detect the low density outskirts of NGC 6822, it is recommended to increase the contrast as much as possible by selecting stars expected to belong to the galaxy. The most straightforward method is to consider only stars with magnitudes and (r′ - i′) colours corresponding to the red giant branch of NGC 6822. To do so, we selected stars in the unreddened CMD which fall between the two lines traced on Fig. 3.
3.3 Colour-colour diagram
NGC 6822, being a Magellanic-type galaxy, young blue stars are expected to be present. They are indeed present in the central part where star formation is still taking place. (Gallart et al. 1996, Battinelli et al. 2003). The young stars are seen to follow more or less the HI disk. The fainter outer region contains almost exclusively older stars. The reddening-corrected colour-colour diagrams, presented in Figure 4, confirm this known fact. We display stars with 0.125 in various radial zones, centred on NGC 6822. It is our standard procedure to display such diagrams with only stars with small photometric errors in order to better see their features. The zones are selected to contain 25,000 to 30,000 stars.

One sees in panel a) the blue main sequence stars, possibly as early as O5 (see main sequence colours from Fukugita et al. 1996) extending to negative colours. The bulk of stars are earlier than mid K-type. In panel b) the vertical branch, corresponding to M-type is stronger while the very early types have diminished. As one moves further out the number of blue stars drastically decreases while the importance of M-type stars increases. In all the panels, stars with (g′–r′)0 1.5 and (r′–i′)0 0.5 are seen. These stars have colours corresponding to C stars (Margon et al. 2002, Downes et al. 2004). Because of the heavy foreground pollution it is advisable to have a good estimate of its influence on the interpretation of the features of the colour-colour diagram.
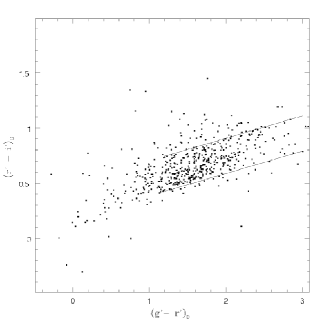
We present, in Figure 5, a reddening free colour-colour diagram of the one square degree south west foreground field. The main sequence branch, extending from late A-type ( 0,0) to late M-type, is well visible in Fig. 5. There is also present, as a well-defined red tail extending to nearly = 1.8, the region where carbon stars are located. The detection of carbon stars in the outer regions of NGC 6822 would be of great interest since they are excellent kinematic probes. Unfortunately, since we do not expect to see the NGC 6822 C star population extending so far from the galaxy, Fig. 5 suggests that the tail is not exclusively populated by C stars and must contain also foreground and/or background objects.
To try to answer this question we follow the procedure used by Demers & Battinelli (2005) when they studied the SLOAN colours of the M31 C star population. We cross-identify the 900 known C stars of NGC 6822, selected from R, I, CN and TiO photometry, with our reddening corrected database. Excluding the crowded centre and taking only stars whose coordinates match within one arcsec ( 500 stars), we obtain the colour-colour diagram displayed in Figure 6. Even though the previous sample corresponds to cool N-type C stars with (R–I)0 0.90 (Letarte et al. 2002), their (g′ – r′) colours span over a wide range. C stars with (g′ – r′)0 less than 1.6 cannot be differentiated from the bulk of K stars. The parallel lines, drawn by eye, limit the region where the bulk of the C stars are found. The luminosity function of the matched stars is shown in Figure 7. As expected the magnitude distribution of C stars follows a narrow Gaussian (see e.g. Battinelli & Demers, 2005).

We then selected the “C star” candidates in the two foreground fields as stars with (g′ – r′)0 1.5 and having colours within the two lines drawn on Fig. 6. Figure 8 presents the LF of these two samples. The Gaussian LF of NGC 6822 C stars in outlined in each panel, there is little evidence for a peak at 19. We conclude, as expected, that these stars are not C stars belonging to NGC 6822.
The possibility that we are observing numerous dwarf C stars along the line of sight must be rejected. Indeed, the surface density of dwarf C stars is quite low at high Galactic latitude, values such as 0.02 per deg2 are quoted (Margon et al. 2002). Their numbers in the disk, thick disk or bulge are not well known. Taking into account the origin of dwarf C stars, de Kool & Green (1995) estimate that their density in the Galactic disk is 1 10-6 pc-3. The absolute magnitude of dwarf C stars is believed to be MV +10 (Harris et al. 1998). For such a luminosity, stars at 2 kpc from the Sun will already be fainter than i′ = 20, thus the observed number of stars with the right colours is much too high to be explained by dwarf C stars.
Quasars, with z 3, partially overlap the C star region in the colour-colour plane (Fan 1999; Fan et al 2001, Richards et al 2001) since their numbers increase quite a bit at 20, they could account for some of the interlopers. They would not, however, define a narrow red tail as the one seen on Fig. 5. On the other end, galaxies, at the r 19 level, are found nearly exactly in the C star region, as Fig. 4 of Newberg et al. (1999) clearly demonstrates. We then conclude that faint galaxies pollute the C star region of the colour-colour diagram in such a way to render the SDSS colours of little use to detect C stars. We do see, however, a recognisable difference between the red tail of Fig. 5 and Fig. 6: C stars often have very red (g′–r′). For the subsample of C stars with (g′–r′) 1.7, 37% of them are redder than (g′–r′) = 2.0, while only 10% of the objects of the red tail of Fig. 5 have such red colours. Thus, objects with extreme (g′–r′) have more chances of being C stars than background galaxies. In the two foreground fields we observe in the C star region of the colour-colour diagram (as defined above) 230 interlopers per deg2 for i′ 20.0.

3.4 Star counts and the shape of NGC 6822
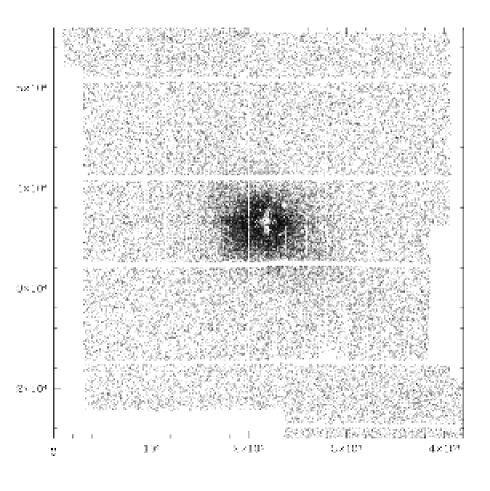
Nearly 200,000 stars fall into the RGB region defined in Sect. 3.2. Their spatial distribution is shown in Figure 9. The density enhancement, at the centre, corresponds to NGC 6822. Other features seen in Fig. 9 require comments. There is an obvious deficiency of stars are the very centre of NGC 6822 which is explained by crowding and by the inadequacy of SExtractor to deal with crowded fields. The horizontal empty strips correspond to the gaps ( wide) between the CCDs. This complicate the determination of the surface density. The narrower vertical gaps (13′′) are more numerous but not as critical. The dent seen on the lower right of the MegaCam field is due to the failure of three CCDs during the observation of the SW field. Finally, lacks of stars, here and there are due to very bright stars contaminating their surrounding.
In order to determine the stellar surface density the gaps need to be filled. The horizontal gaps are filled by duplicating the observe stellar distribution on a strip of width 40′′ above and 40′′ below the gap. Similar fill-up is done for the vertical gaps. The whole field is then covered by a 50 50 pixel wide grid and stars are counted over a circular 500 pixel sampling area, centred on each intersection of the grid. This is done to smooth out major irregularities (mainly due to bright foreground stars that locally prevent the detection of fainter members of NGC6822).
The density map is then transformed into a density image that is analysed with IRAF/STSDAS/ELLIPSE task to fit isodensity ellipses, determine their position angles and ellipticities. The results of this task are summarised in Figure 10 where we show the position angles (PA) and the ellipticities () derived for semi-major axes larger than 10′. Closer to the centre we feel that our data are inadequate to properly investigate the isodensity contours. Furthermore, the stellar distribution in the centre is highly spotty and asymmetric. Fig. 10 shows that the PA’s, close to 80∘ near the centre, decrease slightly to settle at at semi-major axis larger than 25 arcmin. The isodensity contours become somewhat more elliptical as the ellipses increase in size.

The outer ellipse that can be detected above the noise has a semi-major axis of 36′. This ellipse is traced in Figure 11 over a Digitized Sky Survey image of NGC 6822. The HI isodensity contours from de Blok & Walter (2000b) are also traced. This figure reveals that the stellar spheroid, surrounding the bright central bar of NGC 6822 is comparable in size to the HI disk.

Using the above PA’s and ellipticities, we determine the stellar surface density profile by counting “giant” stars in elliptical annuli. The profile is shown in Figure 12. As expected, the incompleteness for r 5′ is severe. The surplus of stars, over the foreground, is seen at least up to 40′. This demonstrates that NGC 6822 is indeed quite large. We adopt for the foreground contribution, to be remove from the total counts, a density of 6.93 0.14 “giants” arcmin-1, this value represents the mean of counts in areas with r 50′.

3.5 The structure of NGC 6822
As a first step, we fit a simple exponential to the profile displayed in Fig. 12, with three free parameters of the form:
we fit the density in the 7′ to 40′ interval and obtain: = 7.85 0.32, = 402.2 14.5 and a scale length h = 5.16 0.11′. The resulting foreground density is, however, too large being more than 6 above our estimated value. We must conclude that a single exponential cannot represent the entire profile of the spheroid.
It has been the norm, in recent years, to fit the surface brightness profile of dE’s with a Sérsic law (i.e. Durrell 1997, Aguerri et al. 2005). It is therefore reasonable to try a similar fit for our observed density profile. The Sérsic (1968) law, given in the form:
is more flexible than the simple exponential because it includes a third free parameter () which controls the shape of the profile. This is normally applied to the surface brightness but can as well be used for the stellar density.
The fit yields: = 3323, = 0.711 and = 0.54. This last coefficient is function, with appreciable scatter, of the total magnitude of the galaxy. When compared to early-type dwarfs of the Virgo Cluster (Binggeli & Jerjen 1998), NGC 6822, with BT = –15.2, should have 0.5 1.0. At the distance of NGC 6822, the scale length of 0.711 arcmin corresponds to 97 pc. The Sérsic laws implies that the density decline is shallower than a simple exponential. It turns out that the solution of the Sérsic fit is very much dependent on the radial interval selected and tends toward 1 when we limit the maximum r to 40′ or smaller values, suggesting that the inner spheroid can indeed be represented by a single exponential.
Having the density profile over a long interval provides an opportunity to see if a two-exponential law could also fit the observed density variation. Indeed, we can obtain a slightly better fit with two exponentials than with the Sérsic law. Fitting the whole 10′ to 50′ interval and using our determine foreground density, we obtain:
with A = 45.2 16.8, a = 10.03 1.12′, B = 579.1 55.0 and b = 3.85 0.26′ for a correlation coefficient r = 0.999 (see Figure 13). With a short scale length of 560 pc, NGC 6822 is quite normal for its luminosity when compared to the dIrr sample of Padori et al. (2002)

The decomposition of the profile into two exponentials suggests that we are observing in the spheroid profile the contribution of a bulge, of scale length of 3.85′ (560 pc), and an extended spheroid of lower density and much larger scale length (1450 pc). The individual profiles and the fractional contributions of these two components are presented in Figure 14.

3.6 The extent of the intermediate-age population
From their identification of C stars, Letarte et al. (2002) have shown that the stellar population of NGC 6822 extends to a surprisingly large distance, when compared to the bright central core of the galaxy. The CFHT12k mosaic reaches only 20′ from the centre, leaving a substantial area of the ellipse of Fig. 11 not surveyed. The SDSS colours cannot unambiguously pick up C stars since, as we have shown in Sec. 3.3, the pollution by background galaxies is severe. However, we now have a reliable estimate of the contribution of interlopers thanks to the two Megacam fields obtained to evaluate the properties of the foreground/background. This permits us to correct the C star counts in the region surrounding NGC 6822 and obtain their density profile.
Figure 15 presents the surface density of C stars, as defined from the SDSS colours. The profile is obtained by counting C star candidates in elliptical annuli having the proper PA and ellipticity and subtracting the background density. The profile reveals that intermediated-age stars belong to the bulge as well as to the outer spheroid. The small numbers involved prevent us to rule out the possibility that a few of our C stars may belong to the HI disk component. According to the profile in Fig. 15, C stars are detectable in appreciable number only up to but the recent discovery of a globular cluster at (Hwang et al. 2005) shows that NGC 6822 extends beyond 12 kpc. In recent years evidences on the existence of such extended structures around dwarf galaxies have accumulated, for example: Leo A (Vansevičious et al. 2004), LMC (Minniti et al. 2003), IC 10 (Demers et al., 2004), DDO 187 (Aparicio et al. 2000). Once more, when securely identified, these stars will provide valuable kinematic probes to better understand the peculiar dynamics of NGC 6822.

4 Discussion
The distribution of the RGBs, displayed in Fig. 9, reveals the presence of elliptically shaped spheroid. The spatial distribution of these old stars contrasts with the youngest population, restricted to the central parts where the HI is observed. To underline the difference between the two spatial distributions, we present in Figure 16, on the same scale, the spatial distribution of some 30,000 main sequence stars, selected as stars with . The blue stars have also an elliptical distribution but the orientation of the major axis of their ellipse follows the HI disk and is nearly at right angles to the major axis of the spheroid. One notices some stars with similar colours distributed all over the field. These are stars with spurious colours whose photometry is affected by the presence of extremely bright stars. They are seen as “clusters” which are located near bright stars. The brightest and most obvious one is in the lower right of the plot.

The profile of the spheroid which can be fitted to two exponentials is not unique among dwarf galaxies. Indeed, Sandage & Binggeli (1984) observed that the surface brightness profile of some dE galaxies of the Virgo Cluster could not be fitted with a single exponential component. Binggeli & Cameron (1991) matched an exponential profile to the surface brightness of the outermost parts of these galaxies but could not fit all radii, indicating that these objects have at least two components. They call these galaxies dwarf lenticulars (dS0s). It has later been found that some of the dS0s in Virgo have a disk-like structure due to the presence of bars and/or spiral patterns (Barazza et al. 2002). More recently, from an analysis of the structural parameters of dwarf galaxies in the Coma cluster, Aguerri et al. (2005) identified two types of dwarfs: the dEs with a Sérsic profile and the dS0s with a Sérsic + exponential profile. They note that the dS0 galaxies have a mean ellipticity of 0.36 0.05, flatter than dEs and essentially similar to what we find for NGC 6822. They suggest that harassment by nearby spirals could explain the origin of dS0s. Closer to the Local Group, the dSO galaxy NGC 59 in the Sculptor Group, may also have a polar ring. The HI observations by Beaulieu et al. (2006) do not have sufficient resolution to confirm this feature. Two structural features of NGC 6822, the central bar and the two exponential profile, imply that its spheroid could be identified as a dSB0 galaxy. Furthermore, the presence of the HI disk nearly at right angles to the major axis of the spheroid reveals that we are seeing a typical polar ring galaxy (hereafter, PRG) configuration. PRGs are indeed composed of an early-type host galaxy surrounded by a gaseous and stellar perpendicular ring or disk with characteristic typical of late-type galaxies. This hypothesis has been confirmed by our radial velocity measurements of nearly 100 C stars which revealed that the spheroid is rotating around its minor axis, thus the spheroid and the HI disk angular momenta are nearly at right angles (Demers et al., 2006).
The size and mass of the polar ring is of little help to assess whether we are observing a genuine PRG. Indeed, both models and observations show that PRGs may have various radii and masses (see e.g. Bournaud & Combes, 2003). The inclination of the polar ring found in NGC 6822 () is large (most PRGs are inclined by less than this value) but some PRGs are observed with much higher inclinations (e.g. the ring of NGC 660 is at ).
The first major study of the class of PRGs was done by Whitmore et al. (1990). They presented data of some 100 galaxies but at that time only a few were kinematically confirmed. The number of kinematically confirmed PRGs is rising slowly, less than two dozens are presently known. The two nearest ones being NGC 660, at 13 Mpc, and NGC 2685 at 13.5 Mpc. In this context, the identification of NGC 6822 as a PRG offers a great leap forward to better understand this phenomenon.
Some caution is however due since the two most likely mechanisms for the formation of PRGs, namely merging and tidal accretion, both imply the interaction with some neighbour while NGC 6822 is, presently, an isolated galaxy. The tiny NW HI cloud suggested by Komiyama et al. (2003) to be responsible of the overall SFR enhancement observed in NGC 6822 (see e.g. Gallart et al., 1996) and of the SE bent of the HI density contours is certainly too small to explain the present configuration of NGC 6822. The Milky Way could have influenced, in the past, the morphology of NGC 6822. These galaxies are currently moving apart at 44 km s-1 at this rate they were 50% closer a few Gyr ago. More exotic formation mechanisms, which do not require two galaxy encounters, have also been proposed (see Combes 2005 for a review) .
PRGs investigated by Ritcher et al. (1994) were found to be much more luminous in the far infrared (FIR) than typical early-type galaxies (S0). But, the few kinematically confirmed PRGs did not show such excess. Taking for NGC 6822 LFIR = 116 Jy and LB = 1.88 Jy, from the NED/IPAC database, we calculate a log(LFIR/LB) = 1.79 making NGC 6822 a galaxy with an extreme ratio, when compared to the Ritcher et al. sample. Furthermore, the HI mass of NGC 6822 is quite normal for a dIrr of its luminosity implying that the HI seen as a disk may be intrinsic to NGC 6822. Its very red (60/100) infrared colour is not particularly high suggesting that the dust, present in the central region, is heated by the blue stars present in abundance and not by numerous red giants.
Another feature often found among PRGs is that the HI rotates faster than predicted for normal spiral galaxy Tully-Fisher (TF) relation (see Iodice et al. 2003) while, as Combes (2005) has shown, on a sample of five well studied PRGs, the host galaxy rotation is in fair agreement with the TF relation. All this has been interpreted as evidence of a DM halo flattened along the HI disk. The rotation along the entire length of the major axis of the spheroid of NGC 6822 has not yet been mapped. For the inner 15 arcmin, Demers et al. (2006) found that the spheroid rotates, within one standard deviation, following the red TF relation as given by Giovannelli et al. (1997). The HI disk appears also to follow the TF relation, using the rotation curve from Weldrake et al. (2003) and taking M for the absolute magnitude (NED/IPAC).
5 Summary
We have determined the reddening map over an area of square degrees in the direction of NGC 6822. This reddening map is used to deredden the colour-magnitude and colour-colour diagrams. The surface density profile of stars selected in the RGB region of the CMD has revealed the existence of a stellar spheroid that we could trace up to from the centre of NGC 6822. This spheroid is of elliptical shape with a major axis at position angle of 65∘, thus nearly at right angles with the major axis of the HI disk described by de Blok & Walter (2000). Such configuration suggests that NGC 6822 is a polar ring galaxy. The stellar density profile is well fitted by a two-exponential law with scale lengths of 10′ and . We confirm that the spheroid contains, at least up to 40′, a detectable intermediate-age population revealed by the presence of C stars.
The identification of confirmed members at the extremities of its major axis is crucial to our understanding of the dynamical evolution of NGC 6822. Indeed, the rotation curve of the spheroid must be mapped to the limit in order to assess its full mass and see if a turn over, revealing past tidal interactions is present. For these reasons, our search for C stars in the periphery continues.
The proximity of NGC 6822 offers a unique opportunity to investigate scenarios leading to the formation of the polar disk. One could, in principle, determine which of the stellar populations belongs to each dynamical system thus permitting to date the event and identify the nature of the intruder.
Acknowledgements.
This research is funded in parts (S. D.) by the Natural Sciences and Engineering Research Council of Canada. We are grateful to Yannick Mellier and the Terapix to have promptly analysed our Megacam data.References
- (1) Aguerri, J. A. L., Iglesias-Páramo, Víchez, J. M., et al. 2005, AJ, 130, 475
- (2) Aparicio, A., Tikhonov, N., & Karachentsev, I. 2000 AJ, 119, 177
- (3) Barnard, E. E. 1884, AN, 110, 125
- (4) Battinelli, P, & Demers, S. 2005, A&A, 442, 159
- (5) Battinelli, P, Demers, S., & Letarte, B. 2003, A&A, 405, 563
- (6) Barazza, F. D., Binggeli, B., & Jerjen, H. 2002, A&A, 391, 823
- (7) Beaulieu, S. F., Freeman, K. C., Carignan, C., et al., AJ 131, 325
- (8) Binggeli, B. & Cameron, L. M. 1991, A&A, 252, 27
- (9) Binggeli, B., & Jerjen, H. 1998, A&A, 333, 17
- (10) Bertin, E., & Arnouts, S. 1996, A&AS, 117, 393
- (11) Bournaud, F. & Combes, F. 2003, A&A, 401, 817
- (12) Cioni, M.-R. L, Habing, H. J. 2005, A&A, 429, 837
- (13) Clementini, G., Held, E. V., Baldacci, L., & Rizzi, L. 2003, ApJ, 588, L85
- (14) Combes, F. 2005, in Mass Profiles and Shapes of Cosmological Structures, G. Mamon, F. Combes, C. Deffayetm B. Fort (eds) EAS Publications Series, in press (astro-ph/0508434)
- (15) Cox, A. N. 2000 in Allen’s Astrophysical Quantities, (4th ed,; New York: Springer), p392
- (16) de Blok, W. J. G. & Walter, F. 2000a in Mapping the Hidden Universe: The Universe behind the Milky Way - The Universe in HI ASP Conf. Ser. 218, p357
- (17) de Blok, W. J. G. & Walter, F. 2000b, ApJ, 537, L95
- (18) de Kool, M. & Green, P. J. 1995, ApJ, 449, 236
- (19) Demers, S., Battinelli, P., & Letarte, B. 2004, A&A, 424, 125
- (20) Demers, S. & Battinelli, P. 2005, A&A, 436, 91
- (21) Demers, S., Battinelli, P., & Kunkel, W. E. 2006, ApJ, 636, L85
- (22) Downes, R. A., Margon, B., Anderson, S. F., Harris, H. C. et al. 2004, AJ, 127, 2838
- (23) Durrell, P. R. 1997, AJ, 113, 531
- (24) Fan, X. 1999, AJ, 117, 2528
- (25) Fan, X., Strauss, M. A., Richards, G. T., et al. 2001, AJ, 121, 31
- (26) Fukugita, M., Ichikawa, T., Gunn, J. E. et al. 1996, AJ, 111, 1748
- (27) Gallart, C., Aparicio, A., Bertelli. G., & Chiosi, C. 1996, AJ, 112, 2596
- (28) Gallart, C., Stetson, P. B., Hardy, E., et al. 2004, ApJ, 614, L109
- (29) Giovanelli, R., Haynes, M. P., da Costa, L. N. et al. 1997, ApJ, 477, 1
- (30) Harris, H. G., Dahn, C. C., Walker, R. L., et al. 1998, ApJ, 508, 437
- (31) Hwang, N., Lee, M. G., Lee, J. C. et al. 2005, in Near Field Cosmology with Dwarf Elliptical Galaxies, IAU Coll. 198, J. Jerjen and B. Bingelli, eds., Cambridge, CUP, p. 257
- (32) Iodice, E., Arnaboldi, M., Bournaud, F. et al. 2003, ApJ, 585, 730
- (33) Irwin, M. J. 1991, in The Magellanic Clouds, IAU Symp. 148. Eds. Raymond Haynes and Douglas Milne, Kluwer, Dordrecht, 1991, p.453
- (34) Komiyama, Y., Okamura, S., Yagi, M. et al. 2003, ApJ, 590, L17
- (35) Lee, M. G., Freedman, W. L., & Madore, B. F. 1993, ApJ, 417, 576
- (36) Letarte, B., Demers, S., Battinelli, P., & Kunkel, W. E. 2002, AJ, 123, 832
- (37) Margon, B., Anderson. S. F. Harris, H. C., Strauss, M. A. et al. 2002, AJ, 124, 1651
- (38) Massey, P., Armandroff, T. E., Pyke, R. et al. 1995, AJ, 110, 2715
- (39) Minniti, D., Borissova, J., Rejkuba, M. et al., 2003, Science, 301, 1508
- (40) Newberg, H. I., Richards, G. T., Richmond, M., & Fan, X. 1999, ApJS, 123, 377
- (41) Padori, B. R., Barazza, F. D., & Binggeli, B. 2002, A&A, 388, 29
- (42) Pietrzyński, G., Gieren, W., Udalski, A. et al. 2004, AJ, 128, 2815
- (43) Richards, G. T., Fan, X., Schneider, D. P., et al. 2001, AJ, 121, 2308
- (44) Richter, O.-G., Sackett, P. D., & Sparke, L. S. 1994, AJ, 107, 99
- (45) Roberts, M. S. 1972 in External Galaxies and Quasi-stellar Objects IAU Symp. No. 44, ed. D. C. Evans, Reidel, Dordrecht, p.12
- (46) Sandage, A. & Binggeli, B. 1984, AJ, 89, 919
- (47) Schlegel, D., Finkbeiner, D., & Davis, M. 1998, ApJ, 500, 525
- (48) Sérsic, J.-L. 1968, Atlas de Galaxias Australes, Observatorio Astronomico de Córdoba
- (49) Smith, J. A., Tucker, D. L, Kent, S., et al. 2002, AJ, 123, 2121
- (50) van der Marel, R. P., Alves, D. R., Hardy, E., & Suntzeff, N. B. 2002, AJ, 124, 2639
- (51) van den Bergh, S. 2000, The Galaxies of the Local Group, Cambridge Astrophysics series: 35
- (52) Vansevičius, V., Arimoto, N., Hasegawa, T., et al., 2004, ApJ, 611, L93
- (53) Volders, L. M. J. S. & Högbom, J. A. 1961, BAN, 15, 307
- (54) Weldrake, D. T. F., de Blok, W. J. G., & Walter, F. 2003, MNRAS, 340, 12
- (55) Whitmore, B. C., Lucas, R. A., & McElroy, D. B. et al. 1990, AJ, 100, 1489