SINFONI Integral Field Spectroscopy of UV-selected Galaxies: Rotation Curves and Dynamical Evolution 11affiliation: Based on observations obtained at the Very Large Telescope (VLT) of the European Southern Observatory, Paranal, Chile (ESO Programme IDs 073.B-9018, 074.A-9011, 075.A-0466, and 076.A-0527).
Abstract
We present resolution near-infrared integral field spectroscopy of the H line emission of 14 UV-selected BM/BX galaxies, obtained with SINFONI at the ESO Very Large Telescope. The average H half-light radius is , and line emission is detected over in several sources. In nine galaxies, we detect spatially-resolved velocity gradients, from 40 to over . The observed kinematics of the larger systems are generally consistent with orbital motions. Four galaxies are well described by rotating disks with clumpy morphologies, and we extracted rotation curves out to radii . One or two galaxies exhibit signatures more consistent with mergers. Analyzing all 14 galaxies of the sample in the framework of rotating disks, we infer mean inclination- and beam-corrected maximum circular velocities of and dynamical masses from to within . On average, the dynamical masses are consistent with estimates of photometric stellar masses assuming a Chabrier or Kroupa initial mass function (IMF) but too small for a Salpeter IMF. The specific angular momenta of our BM/BX galaxies are similar to those of local late-type galaxies. In the single disk framework, the specific angular momenta of the baryons are comparable to those of their dark matter halos. Extrapolating from the average at , the virial mass of the typical halo of a galaxy in our sample is , in good agreement with previous estimates from the clustering and number density of the BM/BX population. Kinematic modeling of the three best cases implies a ratio of to local velocity dispersion and accordingly a large geometric thickness. We argue that this suggests a mass accretion (alternatively, gas exhaustion) timescale of . We also argue that if our BM/BX galaxies were initially gas rich, their clumpy disks will subsequently lose their angular momentum and form compact bulges on a timescale of . In support of this scenario, the object with brightest -band magnitude and among the reddest in colour in our sample (suggesting it is the most evolved) exhibits a maximum in [N II]/H ratio and a minimum in H equivalent width at the geometric/kinematic center, which we interpret as indicative of an inside-out metallicity and age gradient.
Subject headings:
galaxies: evolution — galaxies: high-redshift — galaxies: kinematics and dynamics — infrared: galaxies1. INTRODUCTION
Over the last decade, deep surveys in the optical, infrared, and submillimeter wavebands have revealed a large diversity among high redshift galaxy populations. This reflects in part a diversity in properties such as mass, stellar populations, and gas and dust content. High redshift samples have become sufficiently complete to enable fairly robust estimates of the cosmic evolution of the stellar mass and luminosity density, star formation history, and nuclear activity. About half the stellar mass density in the local universe appears to have been assembled by (e.g., Dickinson et al., 2003; Rudnick et al., 2003; Fontana et al., 2003), after the major peak of star formation and QSO activity at (e.g., Fan et al., 2001; Chapman et al., 2005).
It is, however, less clear exactly how galaxies were assembled. In particular, when and at what rate did galaxies of different masses form? What is the connection between bulge and disk formation? Progress in solving these questions is hampered by our incomplete knowledge of various key physical and observational aspects. For instance, we still have a poor understanding of the competing processes of cooling, angular momentum exchange and loss, and feedback from star formation and active galactic nuclei (AGN), which drive galaxy evolution. The links between the various high redshift populations, their origin, and their subsequent fates still have to be established. In the framework of semi-analytical models of structure formation, the description of the formation and evolution of galaxies remains uncertain because of the lack of observations constraining the parametrization of the complex physical processes involved. The most important ingredients include angular momentum, metallicity, stellar initial mass function (IMF), the spatial distribution of the gas and stars, feedback, and environmental effects such as merger frequency and harassment. A better knowledge of the spatially-resolved kinematics, morphologies, stellar populations, metallicities, and ionization state of the line-emitting gas within galaxies will greatly aid in addressing these issues.
In this context, we have begun a substantial program to investigate representative samples of galaxy populations at from integral field spectroscopy at near-infrared (NIR) wavelengths with SINFONI at the Very Large Telescope (VLT) of the European Southern Observatory (ESO): the high redshift galaxy Spectroscopic Imaging survey in the Near-infrared with SINFONI (SINS). For , NIR observations probe the rest-frame optical emission, which contains numerous diagnostic spectral features that have been well studied and calibrated from large samples at low redshift. SINFONI enables the full two-dimensional mapping of the spectral features, in seeing-limited or adaptive-optics mode. To obtain a panoramic view of the characteristic spatially-resolved properties, we target samples of galaxies selected by a variety of well-defined criteria. One of the class we have observed is the rest-frame UV-selected “BM/BX” galaxies, which are efficiently selected in optical surveys from colour criteria analogous to those of the Lyman-break technique but targeting the lower redshift range (Adelberger et al., 2004; Steidel et al., 2004). In this paper, we present the results of a sample of 14 BM/BX objects, focussing on the morphologies and kinematics traced by the H line emission.
In § 2, we describe the observations and data reduction of our BM/BX galaxy sample. In § 3, we present the results of the H morphologies and kinematics for the entire sample while in § 4, we present detailed case studies of three of the objects, which have the best quality two-dimensional information. We discuss our results in § 5 and summarize the paper in § 6. Throughout, we assume a -dominated cosmology with , , and , unless explicitely stated otherwise. For this cosmology, 1″ corresponds to at . Magnitudes are given in the Vega-based photometric system.
2. OBSERVATIONS AND DATA REDUCTION
We selected our BM/BX targets from the samples observed with long-slit NIR spectroscopy of Erb et al. (2003), Shapley et al. (2004), Steidel et al. (2004), and Erb et al. (2006b). Our criteria were a combination of target visibility, night sky line avoidance for H, and H line flux, with emphasis on objects with spatially extended emission, spatially resolved velocity gradients, or high velocity dispersions based on the existing long-slit spectroscopy. To date, we have observed 14 objects: one BM source at and 13 BX sources in the range , with a mean and median redshift of 2.24. Our sample includes one clearly identified pair, , with projected angular separation of 36 (corresponding to 30 kpc at the redshift of the system). The optical and NIR photometric properties of our targets are presented by Erb et al. (2006b) and are very similar to those of their BM/BX objects with long-slit NIR spectroscopy, spanning nearly the full range observed for the general BM/BX population in terms of and magnitudes as well as and colours (see, e.g., Steidel et al., 2004; Reddy et al., 2005). For comparison with other surveys, three of the 11 targets of our sample with available -band photometry have , and two of the eight with additional -band photometry have . We refer the reader to Erb et al. (2006b) for a more detailed discussion. Table 1 lists the sample (along with the redshifts derived from H in § 3) and summarizes the observations.
We collected the data with SINFONI (Eisenhauer et al., 2003a; Bonnet et al., 2004; Gillessen et al., 2005) mounted at the Cassegrain focus of the VLT UT4 telescope during several observing campaigns between 2004 July and 2005 October, as part of commissioning and guaranteed time observations. SINFONI consists of SPIFFI (Eisenhauer et al., 2003b), a NIR cryogenic integral field spectrometer equipped with a HAWAII detector, and a curvature-sensor adaptive optics (AO) module (MACAO; Bonnet et al., 2003). We used the - or -band gratings to map the H line emission, depending on the redshift of the galaxies. For , we complemented -band data with observations in the and bands to determine the abundance indicator “” from the [O II] , [O III] , and H emission lines. We carried out most of the observations in seeing-limited mode with the scale, for which the total field of view (FOV) is . For two sources, the presence of a sufficiently bright nearby star enabled us to obtain AO-assisted observations. For (guide star 8″ away), we used the scale with total FOV of . For , we employed the scale and locked on the guide star (13″ away) for one-third of the total integration time. In these configurations, SINFONI delivers a nominal FWHM spectral resolution of in (), in (), and in ().
We took the data in series of “AB” cycles, with typical nod throws of about half the SINFONI FOV so as to image the source in all frames, and jitter box widths of about one-tenth the FOV to minimize the number of redundant positions on the detector array. The individual exposure times varied from 300 s to 900 s depending mainly on the variability and intensity of the background and night sky line emission, in order to optimize the background subtraction and remain in the background-limited regime over the wavelength range of interest around the H line. The total on-source integration times ranged from 1 hr to 8 hr, driven by the surface brightness of the sources and our aim to map the kinematics out to large radii for those with the most extended H emission and the largest velocity gradients. We took exposures of stars (including the acquisition stars used for blind offsetting to the galaxies as well as late-B, A0V, and G1V to G3V telluric standards) interleaved with the target observations to monitor the seeing and the atmospheric transmission.
The data reduction included the following steps. We performed wavelength calibration of the individual BM/BX exposures using arc lamp frames, which we verified and corrected, if necessary, using night sky lines present in the data. We subtracted the BM/BX frames pairwise (without spatial shifting) to remove the night sky line and background emission. For some galaxies, we applied a more sophisticated sky subtraction procedure that involves scaling each transition group of telluric OH lines separately in order to minimize residuals affecting the emission lines of interest of the source. We flat-fielded the BM/BX data with exposures of a halogen calibration lamp. We identified bad pixels based on dark and flat-field frames, and replaced them using interpolation. We then reconstructed (including a distortion correction) and registered the three-dimensional data cubes, and averaged them together to produce the final reduced cube for each source. The data of the offset stars and telluric standards were reduced in a similar way. Based on the reference stars data, the seeing was typically (FWHM) in the NIR throughout the observations. For , the use of AO at the scale improved the effective resolution to a FWHM of 03. From the night sky lines, we determined that the effective spectral resolution of the reduced BM/BX data cubes corresponds to (FWHM).
3. RESULTS
We extracted maps of the velocity-integrated line flux, velocity field, and FWHM velocity width (hereafter ) of H from the reduced data cubes of the BM/BX objects. We also extracted position-velocity (p-v) diagrams in a -wide synthetic slit oriented along the kinematic major axis, identified from the SINFONI data for each object. To increase the signal-to-noise (S/N) ratio, we smoothed some of the p-v diagrams with a two-dimensional Gaussian of , or 025 spatially and spectrally. For the velocity and velocity width maps, we smoothed the reduced cubes spatially with a Gaussian of , resulting in a typical effective spatial resolution of (034 for observed in AO mode with the scale). We determined the total line flux, the systemic redshift, and the total from H by fitting a Gaussian profile to the spatially-integrated spectrum of each source. The velocity fields and velocity FWHM maps were extracted from the smoothed data cubes by applying the same Gaussian fitting procedure to each spatial pixel as to the integrated spectrum 111Throughout the paper, “velocity” and “velocity width” thus refer to the center and FWHM parameters of the Gaussians that best fit the observed line profiles.. Except for (which has a -band magnitude of 19.2 mag), the continuum emission of the BM/BX objects in the sample is sufficiently weak so that no continuum subtraction was necessary in making the linemaps. We measured , defined as half the maximum observed velocity gradient from Gaussian fits to spectra taken in apertures on opposite sides of each source along the kinematic major axis. We also estimated the intrinsic half-light radius along the geometric major axis from Gaussian fitting to the H linemaps.
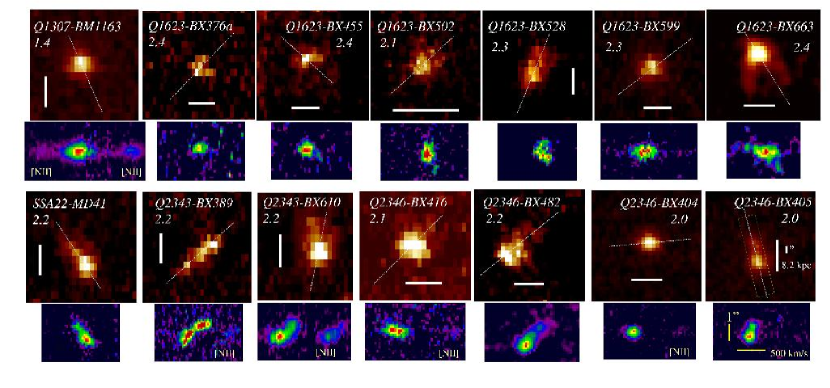
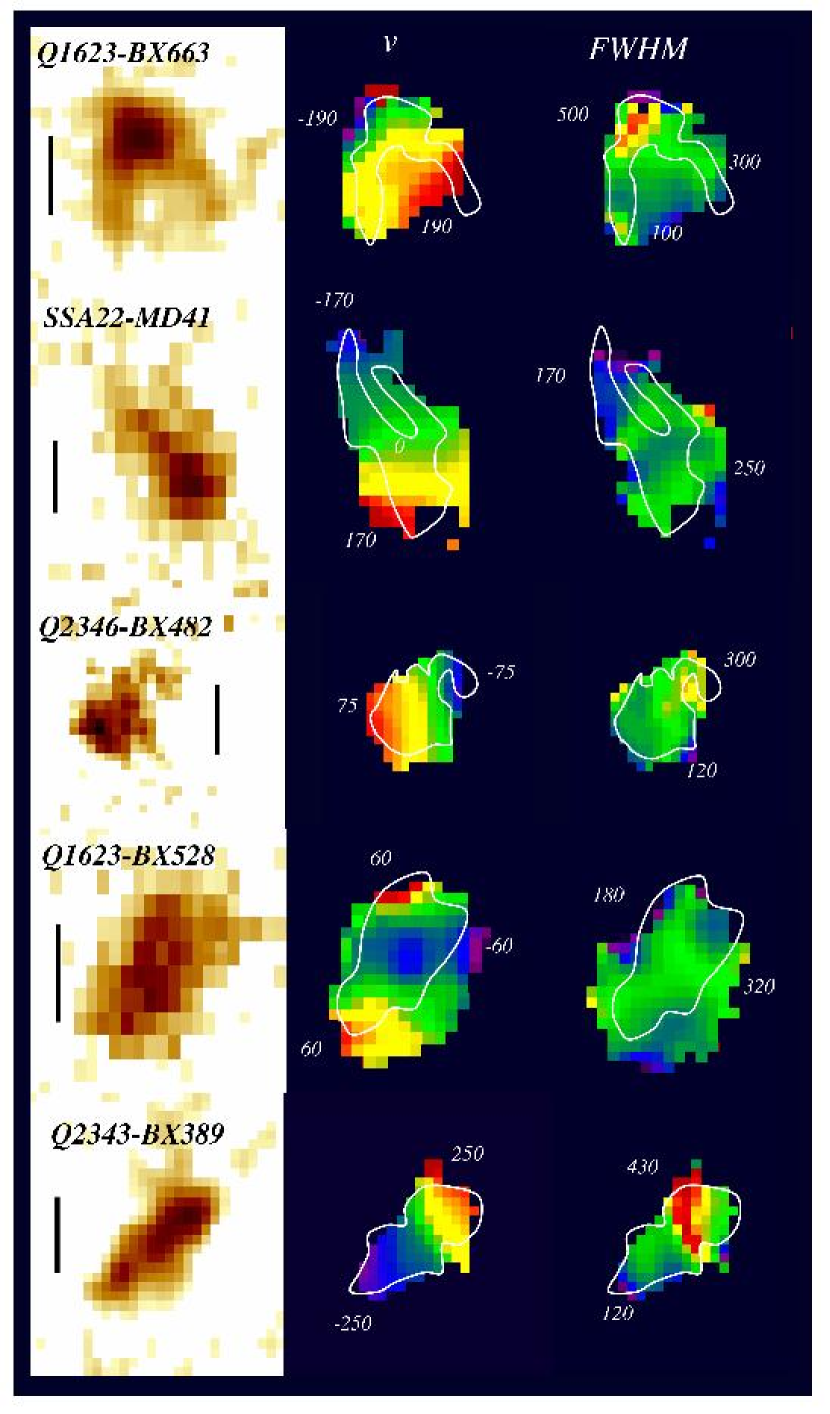
Table 2 lists the redshift, , , and measurements. The half-light radii and FWHM line widths are intrinsic quantities, corrected for the effective spatial and spectral resolution. Figure 1 shows the H linemaps and p-v diagrams along the kinematic major axis for all of the BM/BX galaxies in the sample. Figure 2 shows the two-dimensional spatial distributions of the velocity and FWHM velocity width (here uncorrected for the spectral resolution) of H for five of the galaxies. Together with (shown in Figure 3), these are the “best cases” among the sample observed with SINFONI in terms of the combination of high S/N, large spatial extent and good spatial resolution, and large velocity gradient.
3.1. H Spectra, Sizes, and Morphologies
In most cases, the integrated spectra from the SINFONI data agree well with the long-slit spectra published by Erb et al. (2003), Shapley et al. (2004), and Steidel et al. (2004). These were obtained at lower spectral resolution () with NIRSPEC at the Keck II telescope except for one, which was obtained at comparable resolution () with ISAAC at VLT UT1. Differences (significant in a few cases only) can be attributed to difficulties in night sky line subtraction, S/N limitations for extended sources or broad lines, and slit orientation and positioning that missed part of the emission for the largest sources. In addition to H, we detected the [N II] emission line in 12 of the 14 galaxies. The integrated [N II] /H line flux ratios (hereafter simply [N II]/H ratios) are listed in Table 2 (see also Figure 1).
The H sizes and morphologies among the sample span a fairly wide range. The majority of the sources (11/14) are resolved spatially. The intrinsic along the major axis range from about 2 to 7 kpc, with a mean of 4.4 kpc (median of 4.1 kpc). Three sources may be only marginally resolved, but the effective spatial PSF for their data is more uncertain. In the most extended sources, the H emission tends to be irregular and somewhat clumpy. In the six best cases (Figures 2 and 3), the H emission is clearly detected over . In all of them except , the brightest H peak is located off the geometric center and the H morphology exhibits features reminiscent of a tadpole or chain-like shape.
For two of the sources we observed, HST broad-band optical imaging is available (see Figure 3 of Erb et al., 2003). ACS and earlier WFPC2 data of reveal a very clumpy rest-frame UV morphology, with bright knots to the south-west and diffuse faint emission towards the north-east. The SINFONI linemap shows that the H emission follows very well the overall distribution of the rest-frame UV light (accounting for smearing by the seeing in our ground-based data). , in contrast, is one of the most compact in H among our sample. WFPC2 imaging indicates it is also compact in the rest-frame UV but it lies at the boundary between two detectors, making it difficult to assess its detailed spatial distribution. In these two cases for which we can make the comparison, the spatial distribution of the H and rest-frame UV emission is overall very similar.
The large H sizes in several of the BM/BX sources observed with SINFONI may not be surprising in view of our selection criteria, which emphasized (but were not strictly restricted to) bright and/or extended targets as indicated by previous long-slit spectroscopy (Erb et al., 2003, 2006b; Shapley et al., 2004; Steidel et al., 2004). The typical half-light radius of BX galaxies is (e.g. Shapley et al., 2004; Erb et al., 2004). It is perhaps more interesting that most of the extended sources in our sample do not appear regular or centrally concentrated in H emission. From ACS imaging, Erb et al. (2004) also found a prevalence of irregular and clumpy morphologies peaking off-center in the rest-frame UV for a sample of 13 BX galaxies, which were selected primarily to be elongated among their full spectroscopically-confirmed sample in the GOODS-North field.
One may consider these characteristics in light of the results of Elmegreen, Elmegreen, & Hirst (2004a) and Elmegreen, Elmegreen, & Sheets (2004b). These authors found from ACS imaging that the majority of faint blue galaxies at moderate to high redshift () appear as “chains,” “tadpoles,” and “clump-clusters” and exhibit a lack of central bulges (see also, e.g., Cowie, Hu, & Songaila, 1995). The analogy with the UV-selected BM/BX galaxies is instructive, although one must keep in mind the differences in selection and in redshift range in making this comparison. In addition, the rest-frame UV emission may not trace well the bulk of the stellar population and could miss a bulge component. In that respect, the recent study by Toft and coworkers may shed some new light (S. Toft et al. 2006, in preparation). These authors investigated the morphological variations between the rest-frame UV and optical of galaxies using deep HST ACS and NICMOS imaging at optical and NIR wavelengths. They found that the majority of their sources with blue rest-frame optical colours (as defined by observed NIR colours) show little change in morphology, including those that are clumpy and irregular. In contrast, their red sources typically become more regular and often bulge-dominated in the rest-frame optical. NIR - and -band photometry exists for eight sources in our sample (Erb et al., 2006b) and all but two have . In view of this, and given that BM/BX galaxies have in general colours (e.g. Reddy et al., 2005), the clumpy and asymmetric morphologies in the SINFONI H linemaps and in HST optical imaging may reflect intrinsic features of the overall distribution of the stellar population with a lack of prominent central bulges. We return to this point in § 4 and 5.
3.2. H Kinematics
From the integrated H line widths (corrected for instrumental resolution), we derive a mean and rms velocity dispersion of for our BM/BX galaxies, with a large range from about 70 to . This is in good agreement with the results of Erb et al. (2003, 2004), Shapley et al. (2004), and D. Erb et al. (2006, in preparation) from long-slit spectroscopy of various BM/BX samples. For nine galaxies, we find significant spatially-resolved velocity gradients (see Figure 1). At first glance, this may not appear too surprising. Indeed, four of the sources were preferentially chosen as having tilted H emission in long-slit spectra. In those cases, the new SINFONI data add two-dimensional information and higher spatial resolution. For the remaining five sources, however, the existing long-slit data did not show any significant velocity gradient.
For the six best spatially-resolved (since most extended) galaxies with two-dimensional kinematic information, the velocity fields appear smooth and ordered (see Figures 2 and 3). Similar to local star-forming galaxies (e.g., Elmouttie et al., 1998; Gordon et al., 2000), a smooth kinematic structure — despite a clumpy and asymmetric H light distribution — probably is indicative of ordered orbital motions in a disk or a merger. With the exception of a few objects, our modest linear resolution () compared to the source size does not allow us to uniquely distinguish between orbital motions of two galaxies in a (widely separated) merger or rotation in a single disk. For the purpose of mass estimates using the virial theorem discussed below, the difference between the merger and single disk cases, however, is unlikely to be very different. In analogy with the ultra-luminous infrared galaxies in the local universe (e.g., Downes & Solomon, 1998; Genzel et al., 2001), the gas in an advanced merger probably lies mostly in a single plane given that it dissipates efficiently on order of a dynamical timescale and settles in a rotating disk- or ring-like structure of moderately large scale at the center of the gravitational potential. For the same observed parameters and orientation of the orbital plane relative to the line of sight, a merger model yields a factor times larger dynamical mass than a rotating disk model (Heisler, Tremaine, & Bahcall, 1985).
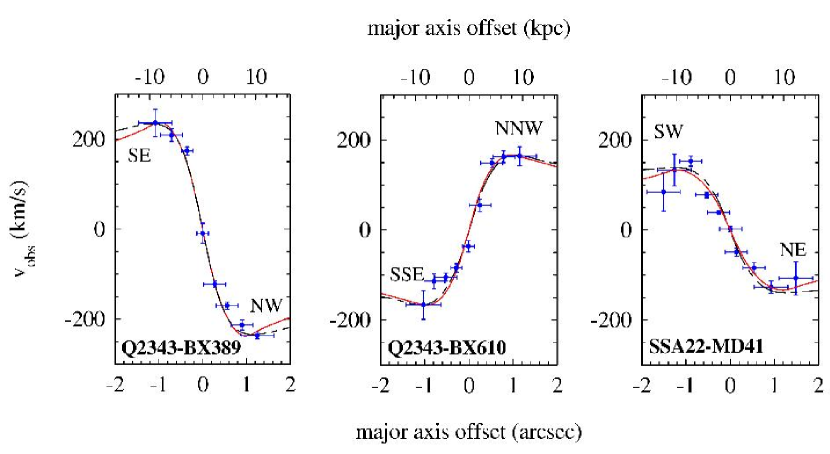
The fact that seven of the nine galaxies with spatially-resolved velocity structures exhibit the largest velocity gradients approximately along the morphological major axis supports a rotating disk interpretation. This contrasts with the findings of Erb et al. (2004) based on long-slit spectroscopy of mostly elongated BX sources in the GOODS-North field. The reason for this difference is unclear; it could possibly reflect in part a combination of selection biases for both samples and the comparatively lower velocity resolution () and angular resolution (mostly ) for the Erb et al. (2004) long-slit data. Stronger evidence for rotating disks is that the velocity gradients along the major axis of , , and flatten at the largest radii probed by the SINFONI H linemaps, suggestive of the flat part of a disk rotation curve (see Figure 4). These three sources also show a maximum in FWHM velocity width at their geometric and kinematic center (and not at the brightest H emission peak offset from the center; Figures 2 and 3), which is a key property of rotating disks. Finally, the velocity field of appears to exhibit a two-dimensional “spider diagram” (Figure 5), a compelling signature of a classical rotating disk (van der Kruit & Allen, 1978). We discuss these three galaxies in more detail in § 4.
In contrast, the reversal in velocities observed for (Figure 2) could be indicative of a counter-rotating merger (e.g., Mihos & Bothun, 1998; Tecza et al., 2000; Genzel et al., 2001). The source exhibits a smooth velocity field despite its complex surface brightness distribution, which could be either due to a relatively face-on disk or a merger. The largest FWHM velocity width () occurs off-center, towards the prominent north-eastern H peak. The latter characteristic is rather more consistent with the source being a merger remnant or disturbed spiral with two long tidal tails, similar to the local analog UGC 10214 (the “Tadpole Galaxy,” e.g., Tran et al., 2003). The larger velocity width towards the H peak, or “head,” of may then perhaps be attributed to an AGN located there, consistent with AGN spectral features present in its rest-frame UV spectrum (A. Shapley, private communication).
Keeping in mind that higher resolution observations will likely reveal a range of kinematic properties, which are perhaps very complex in any given source, the evidence for several of our best sources nevertheless encourages us to analyze the entire sample in terms of a rotating disk toy model to derive first order estimates of circular velocities and dynamical masses. We considered simple models consisting of azimuthally symmetric rotating disks, in which the input light distribution is assumed to trace the distribution of the mass surface density. Other input parameters include the total mass, the inclination angle of the normal to the disk’s plane with respect to the line of sight, and the vertical (-axis) thickness of the disk from which the component of the velocity dispersion is computed under the assumption of hydrostatic equilibrium in the limit of a thin and very extended disk. Furthermore, the model allows for an additional one-dimensional, local isotropic velocity dispersion component . The beam smearing due to seeing is taken into account by convolution of the inclined model with a two-dimensional Gaussian PSF of specified FWHM.
We used these models to estimate the projected circular velocity at turnover, , from our measurements of (half the maximum observed velocity gradient) and (the FWHM velocity width) as follows. For rotating disk models that account for beam smearing and with a range of sizes and of local one-dimensional velocity dispersions appropriate for the BM/BX galaxies in our sample 222For the purpose of this analysis, we assumed Gaussian light profiles but similar results are derived with exponential disks or ring-like distributions., the ratio is . The H emission may preferentially trace the central parts of the galaxy inside the turnover radius, so that the observed velocity gradient could underestimate the intrinsic velocity difference at turnover. This “velocity gradient” method thus yields values that may represent lower limits to the actual . In the same framework and with similar ranges of parameters, is . If there is any significant line broadening other than due to the projection of the rotation and random motions related to the disk thickness (e.g., caused by outflows/winds or streaming motions), this “line width” method yields estimates that may constitute upper limits to the intrinsic . In agreement with these expectations, the velocity gradient method leads to values on average 0.8 times those obtained with the line width method. We find the best agreement for the six best resolved galaxies, for which the mean is 1.1. We adopted the average of the values from the two methods as final estimates. For the 14 BM/BX galaxies studied here, ranges from 60 to . Assuming that the sources have random inclinations and correcting for gives an average and rms . Table 2 lists the dynamical masses enclosed within the H half-light radius, calculated as , where is the gravitational constant. For the three galaxies for which more detailed kinematic modeling is possible (§ 4), the dynamical masses estimated from the simple recipes above are close to (a factor of 0.82 on average) those derived from the modeling.
3.3. Additional Considerations
The new SINFONI data represent a significant step forward in our ability to analyze the kinematics of high redshift galaxies because of the full two-dimensional spatial mapping at good angular and spectral resolution. A major advantage of integral field spectroscopy is that no a-priori assumption about the kinematic major axis needs to be made. Nevertheless, the interpretation of velocity profiles and maps obviously requires some caution for observations of distant systems where uncertain inclination and beam smearing due to seeing can play an important role (see, e.g., the discussion by Erb et al., 2004).
As stated above, we cannot rule out a merger interpretation for our BM/BX sources, except possibly for a few of them, mainly because of spatial resolution limitations. The simulations of integral field spectroscopy data by Law, Steidel, & Erb (2006) indicate that while it may still be difficult to distinguish between rotating disks and two-component mergers for faint and/or compact high redshift systems, such a distinction is however possible for extended sources if the data have sufficient angular and spectral resolution, and sufficient S/N. This may be the case for the three best cases of our sample (discussed in § 4), especially for which the high quality data reveal key kinematic signatures favouring a rotating disk scenario.
Other factors also need to be considered. For instance, outflows and winds may affect the H kinematics. In local starburst galaxies with “superwinds,” the outflowing gas does not dominate the emission line kinematics along the major axis (Lehnert & Heckman, 1996a), neither does it dominate the total high surface brightness H line emission (Lehnert & Heckman, 1995, 1996b). Even in local infrared luminous starburst galaxies with large extinction, Armus et al. (1990) found that the extended emission line gas outside of a few kiloparsecs from the nucleus accounts for of the total H emission. For the luminous dust-rich starburst galaxy , our SINFONI data (see Tecza et al., 2004) indicate an outflow component but its contribution to the integrated H emission is . Differential extinction therefore does not seem in general to play a major role in the relative contribution of outflows compared to gas photoionized directly by the starburst. There is also little evidence for a significant amount of shock-heated gas in BM/BX galaxies (such as high [N II]/H ratios, as discussed by Lehnert & Heckman 1996a; see Table 2 and Erb et al. 2003; Shapley et al. 2004; D. Erb et al. 2006, in preparation). It is thus unlikely that mechanically heated gas plays a significant role in determining the kinematics along the major axis of BM/BX objects.
4. CASE STUDIES: ROTATION CURVES OUT TO AND METALLICITY AND STELLAR POPULATION GRADIENTS
For , , and , we carried out significantly deeper H observations than for the rest of the sample (integration times of 8, 5, and 6 hr, respectively). This has enabled us to study their kinematics on radial scales and determine a detailed velocity and mass model out to the asymptotic part of the rotation curve. Figure 4 shows the velocity profile along the kinematic major axis derived from the SINFONI data of these three galaxies. For , the data further allowed us to investigate spatial variations of the metallicity and stellar population.
We applied the axisymmetric rotating disk models described in § 3.2 to fit the H kinematics of the galaxies. From the models, we then determined the following key properties: the inclination angle , the total () dynamical mass and the dynamical mass within the half-light radius, the circular velocity at turnover radius and at half-light radius, the vertical scale height of the disk , and the ratio at turnover radius (where is the velocity dispersion in the -direction). We explored a range of model parameters and fit the data by tuning the main parameters interactively. Our principal criterion for the goodness-of-fit was that the models reproduce the observed radial profile of the velocity along the major axis (Figure 4) as well as that of the FWHM velocity width. In addition, the models have to account for the major axis size (at FWHM or 20 percentile) and the minor to major axis aspect ratio. We otherwise gave little weight to the details of the spatial distribution of the H emission since it can be significantly affected, for instance, by extinction and by the actual distribution of H II region complexes within the galaxy. These, however, do not influence the overall kinematics traced by H.
We explored exponential disk models as well as models where the light/mass distribution is in form of a ring, as is perhaps suggested by the observed H morphologies, which peak off-center. We found that both types of models can provide good fits to the kinematic data. In terms of the surface brightness distributions, however, the exponential models are generally too centrally peaked and also have outer wings that are too large. Ring models do better in this respect but require, in addition, a more extended component to reproduce the H emission at that is observed in all three galaxies. For the exponential disk models, a better fit is obtained if the disk has a central hole (of radius ), which is conceptually similar to a ring model. Exponential disks with scale lengths of , or rings with radii and thicknesses combined with a more extended component (e.g., a Gaussian of FWHM ), both match adequately the overall surface brightness distribution of the three galaxies.
We note that of the 14 BM/BX galaxies we observed with SINFONI, only a very few (the most convincing case is ) exhibit a classical “double-horn” integrated spectral profile, which is characteristic of motions in a thin azimuthally symmetric plane, as for rotating thin disks and some mergers. For such models to match the data satisfactorily, it is thus required that large random motions throughout the source wash out the double-horn pattern. In the case of rotating disks, another contributing factor may be a slowly rising rotation curve. The inevitable consequence of such random motions is that the planar structure must be geometrically thick.
4.1.
is one of the largest sources among our BM/BX sample, with H emission detected over a projected diameter of 29 (24 kpc). As discussed in § 3.1, the H light distribution follows well the rest-frame UV morphology and relative intensities seen in deep HST imaging. In the context of the Elmegreen et al. (2004a, b) analysis, resembles a “tadpole” system with two bright knots dominating one side of a clumpy disk or ring embedded in a more diffuse emission. There is no evidence for a central bulge.
has the third largest projected velocity gradient in our sample, , first detected in long-slit data by Erb et al. (2003). The observed maximum in velocity dispersion near the geometric and kinematic center of the source is . The two-dimensional velocity field is in excellent agreement with expectations for a rotating disk/ring model, with a smooth velocity gradient that is steepest approximately along the morphological major axis (Figure 2). The most striking kinematic feature is the flattening of the velocity gradient at the largest radii where we still detect H emission, () from the geometric center (Figure 4). This feature is consistent with the asymptotically flat part of a classical rotation curve.
The H kinematics and light distribution are very well fit by the rotating disk models described above. The total dynamical mass inferred (within the radius of 12 kpc probed by our data) is , where the largest source of uncertainty comes from the choice of light distribution (exponential disk with central hole or ring) and from the uncertainty in inclination angle (). As would be expected from their larger spatial wings, exponential disk models give masses near the upper end of this range, while ring models give masses near the lower end. About 60% of this total mass is enclosed within the H half-light radius of . The intrinsic (i.e., model) rotation curve rises rapidly to a maximum of , near , with a slow fall-off at larger radii. In the framework of our simple constant (exponential) scale height plus constant additional isotropic velocity dispersion models, the best fits require a scale height of and a ratio of peak rotational velocity to total -velocity dispersion of . Clearly the disk is geometrically thick and highly turbulent.
4.2.
has the largest projected velocity gradient among our sample, , and H is detected over a projected diameter of 27 (22 kpc). The observed peak in velocity dispersion near the geometric and kinematic center is very large, . The H morphology is reminiscent of “chain” galaxies (Elmegreen et al., 2004a, b), with three main knots forming a linear structure of half-light radius . Both the two-dimensional velocity field and the radial velocity profile are as expected for a nearly edge-on rotating disk (Figures 2 and 4). The velocity gradient is steepest along the morphological major axis and flattens at the largest radii probed by the data, ().
The kinematic features and the overall light distribution of H are well reproduced by disk models with an inclination angle of . The total dynamical mass derived from the models is , of which about 70% is enclosed within . Again, uncertainties are dominated by those of the light distribution and inclination but in this case, the difference between exponential disk and ring models is less than for . has the largest derived dynamical mass of our sample. The intrinsic rotation curve reaches a maximum of , near the half-light radius, and decreases slowly at larger radii. Good fits also require the combination of a substantial scale height () and corresponding -velocity dispersion, as well as an additional isotropic velocity dispersion of . This implies .
4.3.
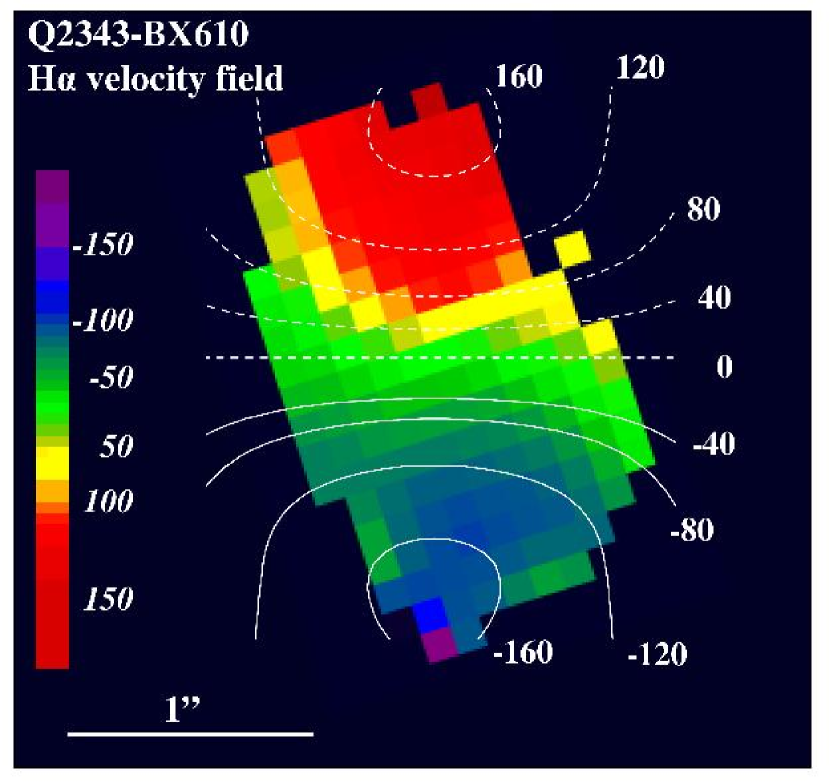
has the second largest projected size and velocity gradient among our sample, with H detected over 24 (20 kpc) and . The half-light radius is . The observed peak in velocity dispersion near the geometric and kinematic center is . is remarkably similar to in its morphological (“tadpole” shape) and kinematic features. Its observed rotation curve also appears to flatten at radii () from the geometric center (Figure 4). This galaxy constitutes our best data set in terms of S/N and kinematic detail. This enabled us to map the two-dimensional distribution of velocity and FWHM velocity width with good significance over a large fraction of the galaxy, encompassing about 2 square arcsec (or 16 spatial resolution elements).
The two-dimensional and distributions are in excellent agreement with expectations for a moderately inclined rotating disk. The velocity map shows the telltale “spider diagram” pattern (Figure 5) and the velocity dispersion clearly peaks at the geometric center of the source (Figure 3), both basic characteristics of rotating disks (van der Kruit & Allen, 1978). For this galaxy, we also detected the continuum in the -band, tracing the rest-frame optical continuum emission from stars that likely dominate the mass in the central regions. The spatial coincidence of the continuum emission peak and of the kinematic center from the velocity map lends further support for the rotating disk scenario.
Rotating disk models (either exponential disks with a central hole or rings) provide excellent fits to the data of , including in this case the two-dimensional velocity field of Figure 5. The axis ratio of the emission indicates an inclination angle of . The total dynamical mass of this disk is , of which 75% is enclosed within the half-light radius. The difference between masses from exponential disks and from ring models is small. The peak rotation velocity is , near the half-light radius. As for the other two sources, our simple models require a substantial scale height () and associated velocity dispersion, and an additional large isotropic velocity dispersion (). The inferred ratio is .
4.4. The Dynamical Center, -band Surface Brightness, and Metallicity Gradient in
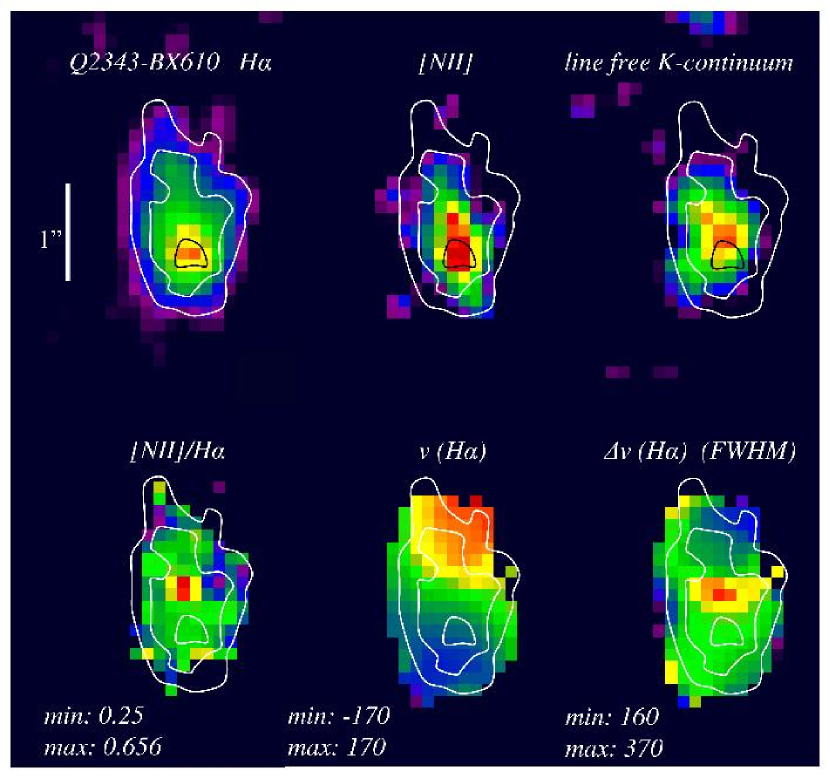
has the brightest -band magnitude and the highest [N II]/H ratio of the BM/BX sample studied here, with total (D. Erb et al. 2006, in preparation) and [N II]/H (Table 2). Its brightness has allowed us to investigate the relative spatial distribution of the line and continuum emission, and their relation to the emission line kinematics.
Figure 3 shows the detailed properties of , including maps of the velocity-integrated H and [N II] line flux, the [N II]/H ratio, and the line-free -band continuum tracing the rest-frame optical continuum. The [N II]/H ratio clearly varies spatially, reaching a maximum near the geometric center of the continuum emission. The peaks of [N II]/H ratio and -band continuum emission are within of each other. While there is H emission detected at this position, there clearly is no local maximum. The [N II]/H ratio measured in a 05–diameter circular aperture centered where the ratio peaks is . Within an annulus of inner diameter 05 and outer diameter 15, we estimate an average ratio of for the rest of the galaxy. The maximum value of [N II]/H is rather high but similar ratios have been observed in H II regions of nearby spiral galaxies (e.g., Ryder, 1995). Furthermore, there is no evidence for the presence of an AGN in a deep optical spectrum obtained with LRIS at the Keck I telescope (D. Erb et al. 2006, in preparation). In support of this result, our SINFONI -band data give an integrated ratio of [O III] /H, which, combined with the integrated [N II]/H ratio, places in a region still populated by non-AGN galaxies and consistent with normal star-forming galaxies in the [O III] /H versus [N II] /H diagnostic diagram (e.g., Lehnert & Heckman, 1994; Kewley et al., 2001; Kauffmann et al., 2003). We conclude that the spatial variations of the [N II]/H ratio and continuum emission are most likely due to gradients in metallicity and stellar populations.
The relationship between oxygen abundance and [N II]/H flux ratio proposed by Pettini & Pagel (2004, “N2” index),
| (1) |
implies at the location of the [N II]/H peak and for the rest of the galaxy. For an assumed solar value of (e.g. Asplund et al., 2004), we infer an oxygen abundance about 1.25 times solar towards the center of and approximately solar for the rest of the galaxy. Since the [N II] emission, and thus the [N II]/H ratio, tends to saturate at solar metallicity and above (see Pettini & Pagel, 2004, and references therein), the abundance gradient in could be even higher than implied by the application of equation (1). We also used our additional - and -band data for this source to estimate the global abundance by applying the method (Pagel et al., 1979) as well as the “O3N2” index calibration of Pettini & Pagel (2004), with appropriate corrections for extinction and ionization effects (as in, e.g., Tecza et al., 2004). Integrated over the source, the method implies and the O3N2 index yields , both of which are consistent with the estimate based on the N2 index 333The S/N ratio of the - and -band data prevents us from measuring reliably spatial gradients in line ratios and metallicity indicators.. The observed velocity of the higher metallicity region indicates that it is located near the kinematic center of the galaxy. In addition, the relative spatial distributions of the -band and H emission imply a significant decrease in the H equivalent width (EW) towards the center. The rest-frame EWs within a 05–diameter aperture centered on the -band peak and integrated over the galaxy are Å and Å, respectively, suggestive of an increase in the age of the stellar population towards the -band continuum peak (see, e.g., the model predictions from STARBURST99; Leitherer et al., 1999).
The SINFONI data of thus indicate that the -band continuum peaks very close to the kinematic center of the galaxy, while the H emission, tracing intense star-forming sites, peaks off-center. The observed gradients in [N II]/H ratio and H EW suggest significant spatial variations in metallicity and stellar ages, with higher metallicities and older ages towards the dynamical center. Overall, appears to be one of the most evolved galaxies among our sample. In addition to its high [N II]/H and bright -band flux, it has a red colour, very close to the criterion for selecting “Distant Red Galaxies” (DRGs, with ; Franx et al., 2003; van Dokkum et al., 2003), which are found to be generally more evolved than UV-selected galaxies at similar redshifts (Förster Schreiber et al., 2004; Labbé et al., 2005). The overlap between BM/BX galaxies and DRGs is small at (Reddy et al., 2005), but the metallicity estimates for are consistent with the properties both of DRGs (van Dokkum et al., 2004) as well as of the brighter part of the BM/BX population (; Shapley et al., 2004).
4.5. Mass-Metallicity Relation
Shapley et al. (2004) discussed the first evidence for (super-)solar metallicities and the possible existence of a luminosity(mass)-metallicity relationship for BM/BX galaxies. The measurements of the [N II]/H ratio and the dynamical mass estimates inferred in § 3.2 for our 14 BM/BX galaxies (see Table 2) show considerable scatter, although the two objects with the largest dynamical masses have higher than average [N II]/H ratio. Converting the [N II]/H ratios to O/H abundances with the Pettini & Pagel (2004) relation (see eq. [1]), we can compare our and estimates with the local relationship between metallicity and stellar mass derived by Tremonti et al. (2004) using the Sloan Digital Sky Survey. Here, it must be borne in mind that a scaling of our dynamical masses within the half-light radius to total dynamical masses will lead to an upward correction, and from dynamical to stellar masses will lead to an (unkown) downward correction in the mass coordinate. Nevertheless, the data suggest that, overall, our BM/BX galaxies lie at lower metallicity (by roughly 0.4 dex) for a given mass with respect to the local relationship. This is consistent with the earlier results of Shapley et al. (2004) as well as the recent work by Erb et al. (2006a), who discuss in detail the stellar mass-metallicity relation at based on a large BM/BX sample (including the majority of our SINFONI targets). The scatter and uncertainties of our [N II]/H ratios, the small mass range covered by our sample, and possible systematic differences between abundances derived from different methods (see, e.g., Tremonti et al., 2004; Shapley et al., 2004; Erb et al., 2006a, and references therein) make it difficult to assess the presence of a mass-metallicity trend from our data.
5. DISCUSSION
While the spatial resolution of our ground-based seeing-limited SINFONI data is still somewhat coarse, they provide us with powerful new tools to investigate the properties and possible evolution of high-redshift galaxies based on their kinematics. In this section, we explore some implications of our results. For simplicity, we exclude the BM object of our sample and focus on the 13 BX objects in the following analysis.
5.1. Angular Momentum
Within the context of the CDM model, the large velocity gradients within we observe for the BX galaxies of the SINFONI sample are derived from the tidal torques generated by merging dark matter halos (Peebles, 1969; White, 1984). If this hypothesis is correct, then these gradients are directly linked to the spin and specific angular momentum of the dark matter halo. Moreover, the amplitude of the gradients over large radii imply that the galaxies in our sample have significant amounts of specific angular momentum. Combining the inferred sizes and rotation velocities, we can make simple estimates of the specific angular momenta of the baryons. An estimate of the angular momentum depends on the mass-weighted velocity distribution of the galaxies for which we have only limited constraints. Assuming a simple model, the angular momentum of the baryons can be estimated as , where is a dimensionless number that depends on the geometry and spatial distribution of the mass. For a disk-like geometry, values of range between 0.7 for a constant density disk with outer radius and 2 for an exponential disk of scale length . Adopting , the average specific angular momentum for the BX sources of our sample is then . The larger rotation velocities and sizes inferred for , , and imply higher specific angular momenta of . Interestingly, these values are comparable to those of local late-type spirals (e.g., Abadi et al., 2003, and references therein).
The theoretical explanation for local disk galaxies having significant angular momenta compared to that calculated for their dark matter halos is that there has been little dissipation and net transfer of angular momentum between the disk’s baryons and the dark matter halo (e.g., Abadi et al., 2003). How does the specific angular momentum that we estimate for our sample of BX galaxies compare with that expected for dark matter halos at ? In the context of the discussion by Mo, Mao, & White (1998, see also ), the specific angular momentum of the halos for our BX sample (with ) is roughly given by:
| (2) |
where is the normalized spin parameter of the dark matter halo and where we have assumed since this is approximately the most frequent value in the spin parameter probability distribution (see Mo et al., 1998), and is the halo circular velocity at virialization in the classical spherical collapse model (White & Frenk, 1991; Mo & White, 2002). Due to the variations in the spin parameter and to possible differences in the mass distribution of individual halos, at constant halo circular velocity the angular momentum of a dark matter halo can vary by a factor of a few (see Mo et al., 1998, and references therein). This large range and the uncertainty of our estimates of the specific angular momenta means that we can only make an approximate comparison with theory. If we hypothesize that the circular velocities at turnover of our BX galaxies are representative of the halo virial circular velocities (as we argue in § 5.2), then these velocities and the range of estimated values imply . Estimating this ratio to be of order of unity implies that it is indeed likely that the baryons at small radii did acquire their specific angular momentum during the collapse of their parent dark matter halos. Given the uncertainties, and more speculatively, this would suggest that the baryons do not transfer their angular momentum to the dark matter upon collapsing from the virial radius to the disk scale length of a few kiloparsecs.
5.2. Constraints on the Properties of Dark Matter Halos
Given that the specific angular momentum of the dark matter halo appears to be comparable to that of the baryonic disk for the BX galaxies in the sample studied here, it is, in principle, possible to constrain the properties of their dark matter halos using the observed kinematics.
In their analysis of the spatial distribution of UV-selected galaxies at in 21 disjoint fields with total area of , Adelberger et al. (2005a) deduced a correlation length for BX objects with of . Through comparison with CDM numerical simulations of large-scale structure, Adelberger et al. then inferred that the estimated correlation length corresponds to halo masses of . Similarly, Adelberger et al. (2004, 2005a) found that the observed comoving number density of BX objects is consistent with the estimated clustering strength, meaning there are sufficient halos to host galaxies of these halo masses.
If the circular velocity determined on scales from our BX data is a reasonable estimate of the circular velocity of the halo the galaxy resides in, we can directly estimate the halo mass using the basic relationship between halo mass and circular velocity at virialization in the classical spherical collapse model (White & Frenk, 1991; Mo & White, 2002). For our BX sample, this yields an average and rms
| (3) |
For , , and , the average is about a factor of two higher than for the whole sample. These estimates based on the kinematics are remarkably close to those obtained by Adelberger et al. (2004, 2005a) from the clustering properties and comoving number density of the BX population. This supports our hypothesis that the circular velocities we derived for our BX sample may indeed be similar to those at the halo virial radius. The analysis of White & Frenk (1991) and Mo & White (2002) also implies a virial radius for the halos of our BX galaxies of
| (4) |
For , , and , the virial radii are about 30% larger, or . For these three cases, for which our data show a flattening of the rotation curve at , we thus infer . At a radius of , simulations (e.g. Hayashi et al., 2004) show that , supporting our contention that the circular velocities are a reasonable representation of the halo virial velocity for our BX objects. Since these simulations do not include the condensation of baryons at the center of these halos — which obviously happened for the galaxies studied here — the values of inferred from these models constitute lower limits. Overall, the simple analysis above implies that the circular velocities we derived for our BX sample are very likely good estimates of the true circular velocity of their halos.
We note that in a second paper on the spatial clustering focussing on BX galaxies in four fields with NIR imaging, Adelberger et al. (2005b) found a substantially higher correlation length for those brighter than compared to the overall population (by a factor of about 2.4). However, as the authors point out, much of the signal leading to this high correlation length comes from a single field, which may bias the average result (see also the discussion by Steidel et al. 2005 who found a significant redshift overdensity for BX sources in another of the four fields used by Adelberger et al. 2005b).
The estimates of the halo masses and galaxy dynamical masses of our BX sample imply that only a fraction of the baryons are associated with the galaxies (see Adelberger et al. 2005a for a related discussion). By combining our derived dark matter halo masses with the dynamical masses, we can estimate the amount of the possible total baryonic matter in place in our BX galaxies. For , , and , our dynamical modeling (§ 4) leads to . The halo masses derived above assuming virial equilibrium are about a factor of 10 higher, i.e., the ratio . For comparison, the currently best value for the fraction of baryonic to total mass is (e.g., Spergel et al., 2003). Taken literally, our results would suggest that even if the dark matter content is negligible inside a radius of , only about half or less of the baryons associated with the dark matter halo are actually within . For the Milky Way, the fraction of total baryonic to dark matter mass is (e.g., Cardone & Sereno, 2005). The similarity between the Milky Way and the three BX galaxies considered here suggest that at epochs as early as , at least some of the BX galaxies might already have an “incorporated mass fraction” comparable to that of local spiral galaxies (with this fraction likely to grow further during subsequent evolution if BX galaxies evolve into present-day elliptical galaxies as suggested by their clustering; see Adelberger et al. 2005a).
5.3. Dynamical Evolution
The determination of the ratio of circular velocity to -velocity dispersion may provide an interesting new probe of the dynamical evolution of actively star-forming galaxies at high redshift. We consider again the three best cases, , , and , for which the modeling of § 4 implies and of . These ratios are much lower than the value of for the Milky Way disk. We here briefly explore two possible mechanisms through which the local velocity dispersion of the gas can be increased in high redshift star-forming galaxies.
In one scenario, the energy from the gravitational potential is converted into random motions during gas infall onto a disk. If the conversion is efficient, gives a measure of the rate of gas infall (N. Murray, private communication). Assuming that random motions are generated by viscous processes in a rotating disk (as considered, e.g., by Jog & Ostriker 1988 and Gammie, Ostriker, & Jog 1991 for lower velocity dispersions in the Galactic disk; see also Goldreich & Tremaine 1978; Fukunaga 1984) and that the rotational and random motion energies grow at approximately equal rates, then
| (5) |
since dispersion is generated on a dynamical timescale and rotational energy increases at the mass accretion rate. In equation (5), is the dynamical timescale, is the mass accretion timescale onto the disk, and is a dimensionless parameter with value near unity. In this scenario, the values of for , , and translate into . Given their at , this implies (consistent with scenarios of accretion through cold flows of baryons from the halo; e.g., Dekel & Birnboim 2006). The rotating disk picture assumed here as well as for the modeling of § 4 neglects possible contributions to the observed velocity dispersion due to non-circular motions, merger-induced flows, or other perturbations. Therefore, the values are very likely upper limits in the context of equation (5) so that the accretion timescale estimates represent almost certainly lower limits. Erb et al. (2006b) applied population synthesis models to fit the optical to NIR (and Spitzer/IRAC mid-IR for a subset) spectral energy distribution (SED) of a large BX sample including and , for which they derived stellar ages (at 95% confidence), at the high end of the range of typical for BX galaxies (see also Shapley et al., 2005). Interestingly enough, the lower limit for and the stellar ages are consistent with each other.
An alternative scenario is that of an actively star-forming disk in which stellar winds, supernova explosions, and radiation pressure are responsible for setting the velocity dispersion and providing vertical support against gravity (Thompson et al., 2005). If the disk reaches marginal stability in terms of Toomre’s Q-parameter (Toomre, 1964), the relationship between and the gas fraction can be written as
| (6) |
where is a dimensionless parameter depending on the assumed distribution of gas and gravitational potential. In this case, the total star formation rate may be described by a Schmidt law,
| (7) |
and the gas exhaustion timescale by star formation is
| (8) |
Here is the star formation efficiency for converting gas into stars, which is estimated to be in the Galactic disk (e.g., Elmegreen, 1999). For the inferred range of , equation (6) and imply . To be as thick as inferred from our data the gas disks must be very gas-rich. For , the gas exhaustion timescale is about 500 Myr. This picture, in which the velocity dispersion in a gas-rich star-forming disk is related to feedback processes from star formation, thus leads to estimates of gas exhaustion timescales that are plausibly consistent with the stellar ages as well.
5.4. Disk Stability and Subsequent Evolution
In view of the above, we now consider the question of the lifetime of the present dynamical state of the BX galaxies we have observed. In a merger interpretation with two interacting galaxies within , the system would form a compact (i.e., bulge) merger remnant within dynamical timescales, or . One might suppose that a disk configuration would be more stable. However, the disks we appear to be observing in some of the BX galaxies differ from local Sa/Sb disk galaxies in that they seem very gas-rich and possibly lack a central bulge. Such systems are probably dynamically unstable.
Immeli et al. (2004b) present the results of a chemo-dynamical simulation of the collapse and fragmentation of a gas-rich galactic disk at high redshift (one of the possible scenarios for disk evolution and bulge formation explored by Immeli et al. 2004a). In this simulation, Immeli et al. (2004b) start from a gaseous disk with a mass inflow rate of , growing to a total mass of in 1 Gyr. This disk fragments into massive star-forming clumps, with masses between 0.6 and and . The total mass, the star formation rate (reaching a maximum of after ), the assembly time, and the knotty appearance of this disk are very similar to the properties of the clump-cluster galaxies studied by Elmegreen & Elmegreen (2005, see also ) and some of the BX galaxies in our sample. The clumpy fragmenting disk is unstable. The star-forming clumps sink to the gravitational center by dynamical friction against the diffuse underlying disk of gas and form a central bulge after . It is interesting to note that this final configuration is similar to those of high redshift galaxies in the hydrodynamical simulations by Abadi et al. (2003), and that it also resembles that of a spheroid rather than of a disk galaxy.
In the context of these simulations, it is tempting to speculate that some of the BX galaxies in our sample are in the mid-stages of the evolution of such unstable gas-rich disks later evolving into galaxy bulges. may be in a more evolved stage in this sequence, in which an older and more metal-rich central bulge of substantial mass has already formed.
5.5. Comparison Between Stellar and Dynamical Masses
Having estimated dynamical masses for our BX sample, an obvious test is to compare them with photometric stellar mass estimates. Shapley et al. (2005) and Erb et al. (2006b) have carried out population synthesis modeling of the SEDs of large samples of spectroscopically-confirmed BX galaxies. They found that the average stellar mass in a typical BX galaxy is . Shapley et al. (2004) further compared the stellar masses and a virial estimate of the dynamical masses of nine BX objects, which are at the massive tail () of the population. They concluded that the stellar masses exceed the dynamical masses by a factor of about three for a Salpeter IMF () between and , which is commonly adopted in studies of high redshift galaxies.
From studies in the Milky Way, it is now clear (e.g., Scalo, 1986) that the IMF flattens below a few solar masses even if a Salpeter slope may be applicable at the high mass end. With such a flattening at the low mass end, modern versions of appropriate local IMFs (e.g. Kroupa, 2001; Chabrier, 2003) lead to total masses times lower than the unrealistic Salpeter IMF. For a more extreme (but probably also unrealistic) Salpeter IMF, total masses are 2.5 times lower. Shapley et al. (2004) found that a Kroupa or Chabrier IMF is consistent with their virial mass estimates derived from the velocity widths for seven BX galaxies.
The 11 BM/BX SINFONI targets with available NIR photometry are included in the sample for which Erb et al. (2006b) carried out SED modeling. For a Chabrier IMF, their modeling implies and average and rms stellar mass of . The dynamical masses we inferred from the velocity gradient and line width methods in § 3.2 for these objects agree well, with a mean and rms of within the H half-light radius. Taking the results of the more detailed kinematic modeling of , , and as a guide (§ 4), the ratio of total mass and mass within is about 1.5. With this correction, is about . For and , the kinematic modeling gives total of and , which are factors of 0.4 and 3 times the estimates of Erb et al. (2006b). These considerations illustrate the uncertainties involved in deriving photometric stellar masses and dynamical masses. Nonetheless, the dynamical masses tend to be overall about equal to the photometric stellar masses with a Kroupa or Chabrier IMF. Leaving some room for contributions from gas and dark matter might imply a slight shortfall of the dynamical masses and would then require a still smaller fraction of low mass stars or, alternatively, a more top-heavy IMF (e.g., as proposed by Baugh et al., 2005). Our dynamical mass measurements may thus strengthen the arguments that a Salpeter IMF is inappropriate for high redshift galaxies.
6. Summary
We have carried out NIR integral field spectroscopy with SINFONI of a sample of 14 UV-selected BM/BX galaxies at to investigate the morphology and kinematics as traced by their H line emission. From our H linemaps, as well as higher resolution rest-frame UV imaging from HST for other BX galaxies (Erb et al., 2004), it appears that, at least in part, the BM/BX galaxies we have observed are not classical exponential disks with a central bulge but present rather asymmetric and clumpy morphologies. Deep high resolution NIR imaging is obviously highly desirable to determine the morphologies in rest-frame optical continuum emission.
We detected spatially-resolved velocity gradients in almost all galaxies whose integrated size is sufficiently large to allow us to make such a measurement. For the six cases for which the data provide high quality two-dimensional kinematic information, the velocity fields and gradients are smooth and, in all but one or two cases, match the expectations for a simple rotating disk. The steepest velocity gradients for the galaxies in our sample are generally approximately along the morphological major axis. For the three best cases among our SINFONI sample, we have obtained the first convincing asymptotic rotation curves at high redshift, on radial scales of from the dynamical center. The dynamics of the BM/BX sample studied here thus appear to be dominated by gravitationally-driven motions.
From these measurements and from kinematic modeling, we inferred dynamical masses ranging from to within the H half-light radius. Hypothesizing that the average at a radius of is an appropriate proxy for the circular velocity of the dark matter halo implies a virial mass for the typical halo of a BM/BX galaxy in our sample of . This is in good agreement with estimates based on the clustering and co-moving space density of the BM/BX population (Adelberger et al., 2005a). The kinematic technique may provide a new, independent method for estimating dark matter halo masses. From the more detailed kinematic modeling of the three best cases, we inferred a ratio of peak circular velocity to -velocity dispersion of . This suggests a mass accretion timescale onto the disk or, alternatively, a gas exhaustion timescale of , broadly consistent with the stellar ages. We found that the specific angular momenta of the BM/BX objects in our sample are similar to those of local late-type galaxies, and that the specific angular momenta of their baryonic disks appear to be roughly comparable to those of the dark matter halos from which they formed.
We presented arguments, based on the properties of the BM/BX galaxies analyzed in this paper, which may suggest an interesting scenario for their evolution. Merger-induced or (quasi-)adiabatic gas collapse, whereby the specific angular momentum of the gas relative to the dark matter halo is preserved, has its free energy converted into turbulence in the disk, which is one way to explain the low we observed. Gas-rich disks growing through infall are likely unstable against fragmentation. The self-gravitating fragments result in clumpy and irregular morphologies such as seen in the H linemaps of several of our BM/BX sources. These fragments may transfer angular momentum to infalling gas as they sink towards the center of the gravitational potential through dynamical friction, leading to the formation of a central bulge. Angular momentum transfer in this way may allow the residual gas to keep its high specific angular momentum, such that it remains comparable to that of the dark matter halo. The collapse of the gas would be relatively inefficient, preserving the relatively low fraction of baryonic mass that we inferred for our sample. Although some of these arguments are speculative, they may suggest a plausible and consistent picture that may explain a number of features observed for some of the BM/BX galaxies studied here.
The results presented in this work apply to the BM/BX sample that we have observed with SINFONI. Admittedly, the sample may not be representative of the BM/BX population as a whole because the targets were preferentially selected to be large, or to exhibit significant velocity gradients or large line widths based on existing long-slit spectroscopy. Nonetheless, the SINFONI data we have obtained show the improvement in our ability to investigate the morphologies and kinematics of high redshift galaxies afforded by NIR integral field spectroscopy. It will undoubtedly be very interesting to extend such studies to other high redshift populations and further investigate the issues addressed in this work in the future.
References
- Abadi et al. (2003) Abadi, M. G., Navarro, J. F., Steinmetz, M., & Eke, V. R. 2003, ApJ, 591, 499
- Adelberger et al. (2005a) Adelberger, K. L., Erb, D. E., Steidel, C. C., Reddy, N. A., Pettini, M., & Shapley, A. E. 2005a, ApJ, 620, L75
- Adelberger et al. (2005b) Adelberger, K. L., Steidel, C. C., Pettini, M., Shapley, A. E., Reddy, N. A., & Erb, D. E. 2005b, ApJ, 619, 697
- Adelberger et al. (2004) Adelberger, K. L., Steidel, C. C., Shapley, A. E., Hunt, M. P., Erb, D. K., Reddy, N. A., & Pettini, M. 2004, ApJ, 607, 226
- Armus et al. (1990) Armus, L., Heckman, T. M., & Miley, G. K. 1990, ApJ, 364, 471
- Asplund et al. (2004) Asplund, M., Grevesse, N., Sauval, A. J., Allende Prieto, C., & Kiselman, D. 2004, A&A, 417, 751
- Baugh et al. (2005) Baugh, C. M., Lacey, C. G., Frenk, C. S., Granato, G. L., Silva, L., Bressan, A., Benson, A. J., & Cole, S. 2005, MNRAS, 356, 1191
- Bonnet et al. (2003) Bonnet, H., et al. 2003, Proc. SPIE, 4839, 329
- Bonnet et al. (2004) Bonnet, H., et al. 2004, The Messenger, 117, 17
- Cardone & Sereno (2005) Cardone, V. F., & Sereno, M. 2005, A&A, 438, 545
- Chabrier (2003) Chabrier, G. 2003, PASP, 115, 763
- Chapman et al. (2005) Chapman, S. C., Blain, A. W., Smail, I., & Ivison, R. J. 2005, ApJ, 622, 772
- Cowie et al. (1995) Cowie, L., Hu, E., & Songaila, A. 1995, AJ, 110, 1576
- Dekel & Birnboim (2006) Dekel, A. & Birnboim, Y. 2006, MNRAS, in press (astro-ph/0412300)
- Dickinson et al. (2003) Dickinson, M., Papovich, C., Ferguson, H. C., & Budavári, T. 2003, ApJ, 587, 25
- Downes & Solomon (1998) Downes, D., & Solomon, P. M. 1998, ApJ, 507, 615
- Eisenhauer et al. (2003a) Eisenhauer, F., et al. 2003a, Proc. SPIE, 4841, 1548
- Eisenhauer et al. (2003b) Eisenhauer, F., et al. 2003b, The Messenger, 113, 17
- Elmegreen (1999) Elmegreen, B.G., 1999, ApJ, 517, 103
- Elmegreen & Elmegreen (2005) Elmegreen, B. G., Elmegreen, D. M. 2005, ApJ, 627, 632
- Elmegreen et al. (2004a) Elmegreen, B. G., Elmegreen, D. M., & Hirst, A. C. 2004a, ApJ, 612, 191
- Elmegreen et al. (2004b) Elmegreen, D. M., Elmegreen, B. G., & Sheets, C. M. 2004b, ApJ, 603, 74
- Elmouttie et al. (1998) Elmouttie, M., Koribalski, B., Gordon, S., Taylor, K., Houghton, S., Lavezzi, T., Haynes, R., & Jones, K. 1998, MNRAS, 297, 49
- Erb et al. (2003) Erb, D. K., Shapley, A. E., Steidel, C. C., Pettini, M., Adelberger, K. L., Hunt, M. P., Moorwood, A. F. M., & Cuby, J.-G. 2003, ApJ, 591, 101
- Erb et al. (2004) Erb, D. K., Steidel, C. C., Shapley, A. E., Pettini, M., & Adelberger, K. L. 2004, ApJ, 612, 122
- Erb et al. (2006a) Erb, D. K., Shapley, A. E., Pettini, M., Steidel, C. C., Reddy, N. A., & Adelberger, K. L. 2006a, ApJ, in press (astro-ph/0602473)
- Erb et al. (2006b) Erb, D. K., Steidel, C. C., Shapley, A. E., Pettini, M., Reddy, N. A., & Adelberger, K. L. 2006b, ApJ, submitted
- Fan et al. (2001) Fan, X., et al. 2001, AJ, 121, 54
- Förster Schreiber et al. (2004) Förster Schreiber, N. M., et al. , 2004, ApJ, 616, 40
- Fontana et al. (2003) Fontana, A., et al. 2003, ApJ, 594, L9
- Franx et al. (2003) Franx, M., et al. , 2003, ApJ, 587, L79
- Fukunaga (1984) Fukunaga, M. 1984, PASP, 36, 433
- Gammie et al. (1991) Gammie, C. F., Ostriker, J. P., & Jog, C. J. 1991, ApJ, 378, 565
- Genzel et al. (2001) Genzel, R., Tacconi, L. J., Rigopoulou, D., Lutz, D., & Tecza, M. 2001, ApJ, 563, 527
- Gillessen et al. (2005) Gillessen, S., et al. 2005, The Messenger, 120, 26
- Goldreich & Tremaine (1978) Goldreich, P., & Tremaine, S. 1978, Icarus, 34, 227
- Gordon et al. (2000) Gordon, S., Koribalski, B., Houghton, S., & Jones, K. 2000, MNRAS, 315, 248
- Hayashi et al. (2004) Hayashi, E., et al. 2004, MNRAS, 355, 794
- Heisler et al. (1985) Heisler, J., Tremaine, S., & Bahcall, J. N. 1985, ApJ, 298, 8
- Immeli et al. (2004a) Immeli, A., Samland, M., Gerhard, O., & Westera, P. 2004a, A&A, 413, 547
- Immeli et al. (2004b) Immeli, A., Samland, M., Westera, P., & Gerhard, O. 2004b, ApJ, 611, 20
- Jog & Ostriker (1988) Jog, C. J., & Ostriker, J. P. 1988, ApJ, 328, 404
- Kauffmann et al. (2003) Kauffmann, G., et al. , 2003, MNRAS, 346, 1055
- Kewley et al. (2001) Kewley, L. J., Dopita, M. A., Sutherland, R. S., Heisler, C. A., & Trevena, J. 2001, ApJ, 556, 121
- Kroupa (2001) Kroupa, P. 2001, MNRAS, 322, 231
- Labbé et al. (2005) Labbé, I., et al. , 2005, ApJ, 624, L81
- Law et al. (2006) Law, D. R., Steidel, C. C., & Erb, D. K. 2006, AJ, 131, 70
- Lehnert & Heckman (1994) Lehnert, M. D. & Heckman, T. M. 1994, ApJ, 426, L27
- Lehnert & Heckman (1995) Lehnert, M. D. & Heckman, T. M. 1995, ApJS, 97, 89
- Lehnert & Heckman (1996a) Lehnert, M. D. & Heckman, T. M. 1996a, ApJ, 462, 651
- Lehnert & Heckman (1996b) Lehnert, M. D. & Heckman, T. M. 1996b, ApJ, 472, 546
- Leitherer et al. (1999) Leitherer, C., et al. 1999, ApJS, 123, 3
- Mihos & Bothun (1998) Mihos, J. C., & Bothun, G. D. 1998, ApJ, 500, 619
- Mo et al. (1998) Mo, H. J., Mao, S. & White, S. D. M. 1998, MNRAS, 295, 319
- Mo & White (2002) Mo, H. J., & White, S. D. M. 2002, MNRAS, 336, 112
- Pagel et al. (1979) Pagel, B. E. J., Edmunds, M. G., Blackwell, D. E., Chun, M. S., & Smith, G. 1979, MNRAS, 189, 95
- Peebles (1969) Peebles, P. J. E. 1969, ApJ, 155, 393
- Pettini & Pagel (2004) Pettini, M., & Pagel, B. E. J. 2004, MNRAS, 348, L59
- Reddy et al. (2005) Reddy, N. A., Erb, D. K., Steidel, C. C., Shapley, A. E., Adelberger, K. L., & Pettini, M. 2005, ApJ, 633, 748
- Rudnick et al. (2003) Rudnick, G., et al. 2003, ApJ, 599, 847
- Ryder (1995) Ryder, S. 1995, ApJ, 444, 610
- Scalo (1986) Scalo, J. M. 1986, Fund. Cosmic Phys., 11, 1
- Shapley et al. (2004) Shapley, A. E., Erb, D. K., Pettini, M., Steidel, C. C., & Adelberger, K. L. 2004, ApJ, 612, 108
- Shapley et al. (2005) Shapley, A. E., Steidel, C. C., Erb, D. K., Reddy, N. A., Adelberger, K. L., Pettini, M., Barmby, P., & Huang, J. 2005, ApJ, 626, 698
- Spergel et al. (2003) Spergel, D. N., et al. 2003, ApJS, 148, 175
- Steidel et al. (2005) Steidel, C. C., Adelberger, K. L., Shapley, A. E., Erb, D. K., Reddy, N. A., & Pettini, M. 2005, ApJ, 626, 44
- Steidel et al. (2004) Steidel, C. C., Shapley, A. E., Pettini, M., Adelberger, K. L., Erb, D. K., Reddy, N. A., & Hunt, M. P. 2004, ApJ, 604, 534
- Tecza et al. (2000) Tecza, M., Genzel, R., Tacconi, L. J., Anders, S., Tacconi-Garman, L. E., & Thatte, N. 2000, ApJ, 537, 178
- Tecza et al. (2004) Tecza, M., et al. 2004, ApJ, 605, L109
- Thompson et al. (2005) Thompson, T. A., Quataert, E., & Murray, N. 2005, ApJ, 630, 167
- Toomre (1964) Toomre, A. 1964, ApJ, 139, 1217
- Tran et al. (2003) Tran, H. D., et al. 2003, ApJ, 585, 750
- Tremonti et al. (2004) Tremonti, C.A., Heckman, T.M., Kauffmann, G., Brinchmann, J., Charlot, S., White, S.D.M., Seibert, M., Peng, E., Schlegel, D.J., Uomoto, A., Fukugita, M. & Brinkman, J. 2004, ApJ, 613, 898
- van der Kruit & Allen (1978) van der Kruit, P. C., & Allen, R. J. 1978, ARA&A, 16, 103
- van Dokkum et al. (2003) van Dokkum, P. G., et al. 2003, ApJ, 587, L83
- van Dokkum et al. (2004) van Dokkum, P. G., et al. 2004, ApJ, 611, 703
- White (1984) White, S. D. M. 1984, ApJ, 286, 38
- White & Frenk (1991) White, S. D. M., & Frenk, C. S. 1991, ApJ, 379, 52
| Source | aa Systemic vacuum redshift derived from the integrated H line emission in the SINFONI data (as described in § 3). and BX405 form a pair, with angular separation of 36 (or 30 kpc at their redshift). | Band | Scale | bb Total on-source integration time. | Run cc SINFONI observing runs where the data were taken: Jul04: commissioning run on 2004 July 9 to 18; Nov04: GTO run on 2004 November 29 and 30; Dec04: GTO run on 2004 December 20 to 22; Mar05: GTO run on 2005 March 13 to 22; Apr05: GTO run on 2005 April 4 to 7. Jun05: GTO run on 2005 June 15 to 17. Aug05: GTO run on 2005 August 27 to September 4. Oct05 : GTO run on 2005 October 2 to 12. |
|---|---|---|---|---|---|
| (s) | |||||
| 1.4101 | 0125 | 14400 | Mar05 | ||
| 2.4087 | 0125 | 15600 | Mar05, Apr05 | ||
| 2.4071 | 0125 | 12000 | Mar05 | ||
| 2.1555 | 005 | 9600 | Apr05 | ||
| 2.2684 | 0125 | 13500 | Jul04 | ||
| 2.3313 | 0125 | 5400 | Jul04 | ||
| 2.4335 | 0125 | 9000 | Jul04 | ||
| 2.1710 | 0125 | 28800 | Nov04, Jun05 | ||
| 2.1728 | 0125 | 18000 | Oct05 | ||
| 2.2102 | 0125 | 10800 | Jun05 | ||
| 0125 | 18000 | Aug05, Oct05 | |||
| 0125 | 14400 | Oct05 | |||
| 2.0298 | 0125 | 8100 | Jul04 | ||
| 2.0308 | 0125 | 8100 | Jul04 | ||
| 2.2406 | 0125 | 7200 | Dec04 | ||
| 2.2569 | 0125 | 7200 | Nov04 |
| Source | aa Systemic vacuum redshift derived from the integrated H line emission. | [N II]/H bb Ratio of the integrated [N II] and H line fluxes. For , , and , there is a broad component to H, making estimates of the [N II]/H ratio more uncertain. | cc Rest-frame intrinsic half-light radius along the major axis of the detected H light distribution (see § 3). The observed HWHM along the morphological major axis of each galaxy was corrected for a typical NIR seeing with except for , for which AO-assisted observations were taken, resulting in an effective resolution with . | dd Intrinsic FWHM velocity width and half-total velocity spread over the H emitting regions (see § 3). The FWHM line widths for each galaxy were corrected for the instrumental resolution of . | dd Intrinsic FWHM velocity width and half-total velocity spread over the H emitting regions (see § 3). The FWHM line widths for each galaxy were corrected for the instrumental resolution of . | ee Inferred dynamical mass within (uncorrected for inclination), averaged from the “line width” and “velocity gradient” methods, as described in § 3. |
|---|---|---|---|---|---|---|
| (kpc) | () | () | () | |||
| 1.4101 | 3.1 | 310 | 60 | 0.84 | ||
| 2.4087 | 3.1 | 210 | 30 | 0.33 | ||
| 2.4071 | 3.5 | 270 | 55 | 0.73 | ||
| 2.1555 | 2.0 | 170 | 50 | 0.21 | ||
| 2.2684 | 6.6 | 280 | 65 | 1.7 | ||
| 2.3313 | 3.4 | 375 | 50 | 1.1 | ||
| 2.4335 | 5.3 | 360 | 95 | 2.4 | ||
| 2.1710 | 6.0 | 300 | 140 | 3.2 | ||
| 2.1728 | 7.0 | 570 | 235 | 11 | ||
| 2.2102 | 5.4 | 385 | 165 | 4.6 | ||
| 2.0298 | 2.8 | 210 | 20 | 0.27 | ||
| 2.0308 | 4.6 | 170 | 30 | 0.37 | ||
| 2.2406 | 2.8 | 315 | 70 | 0.84 | ||
| 2.2569 | 5.8 | 300 | 100 | 2.3 |