Mid-Infrared Identifications of SCUBA Galaxies
in the CUDSS 14-Hour Field
with the Spitzer Space Telescope
Abstract
We identify 17 possible 8.0 m-selected counterparts to the submillimeter galaxies in the CUDSS 14h field, derived from deep imaging carried out with the IRAC and MIPS instruments aboard the Spitzer Space Telescope. Ten of the 17 counterparts are not the same as those previously identified at shorter wavelengths. We argue that 8.0 m selection offers a better means for identifying counterparts to submillimeter galaxies than near-infrared or optical selection. Based on the panchromatic SEDs, most counterparts appear to be powered by ongoing star formation. Power-law fits to the SEDs suggest that five objects in the 8.0 m-selected counterpart sample harbor dominant AGNs; a sixth object is identified as a possible AGN. The 3.6-8.0 m colors of the infrared-selected counterparts are significantly redder than the general IRAC galaxy population in the CUDSS 14h field.
1 Introduction
Observations at 850µm, initially with the Submillimeter Common User Bolometer Array (SCUBA) and subsequently with the Max Planck Millimeter Bolometer (MAMBO), have revealed galaxies that are strong sources of dust emission but faint at visible wavelengths (Smail, Ivison & Blain 1997, Hughes et al. 1998, Barger et al. 1998, Eales etal 1999, Clements et al. 2004).
The SCUBA galaxy populations are important because they seem to represent the most luminous star-forming galaxies during the epoch when star formation rates were highest. The space density of submillimeter galaxies is orders of magnitude greater than that of galaxies at low redshift (Blain et al. 2002), implying that strong evolution has greatly altered the submillimeter galaxy populations since . Moreover, some or all of the SCUBA population may be the progenitors of today’s massive elliptical galaxies. The stars in nearby elliptical galaxies and in the bulges of disk galaxies are old and tend to be metal rich. At high redshifts, there ought to be a significant population of progenitor galaxies with star formation rates (SFRs) high enough to produce today’s population of ellipticals and bulges (Lilly et al. 1999). No such population has been detected in deep optical surveys, but the SCUBA galaxies, or some of them, could represent the long-sought progenitors. Understanding these so-called “SCUBA galaxies” and their place in cosmic evolution, however, requires complementary observations at other wavelengths and in particular some way to determine redshifts.
Observing SCUBA galaxies in visible light is difficult. The dust responsible for the submillimeter emission obscures the primary luminosity sources, making the SCUBA galaxies quite faint at visible wavelengths. Even identifying the correct visible counterpart to a given SCUBA galaxy is difficult because of the large beamsize (14″ FWHM at 850 m) of the James Clerk Maxwell Telescope and other submillimeter facilities. The unavoidable result is that at visible and even near-infrared wavelengths, there are numerous potential counterparts in the SCUBA beam, and there is no easy way to decide which of the candidates is the true counterpart.
One successful approach to finding counterparts has been to use radio interferometric observations to refine the SCUBA positions and thus select a specific visible object. Chapman et al. (2003, 2005), for example, have used this approach and have shown that radio-identified SCUBA galaxies have a median spectroscopic redshift of . However, about 1/3 of SCUBA sources are not detectable with current radio observations (Chapman et al. 2005) and could represent a distinct population. It is therefore worthwhile seeking alternate ways to identify counterparts.
This contribution describes a new program to recover submm-selected galaxies in the mid-infrared, so as to exploit the advantages this passband offers for better identifications of the counterparts to these important objects. Our submm sample is comprised of 23 SCUBA-detected objects in the 14h field of the Canada-UK Deep Submillimetre Survey (CUDSS; Lilly et al. 1999, Eales et al. 2000, Webb et al. 2003). We base our infrared counterpart search on the very deep 8.0 m Spitzer mosaic of the 14h field. Although the Spitzer observations (described below) include coextensive observations at a number of passbands from 3.6 to 160 m, we use sources drawn specifically from the 8.0 m mosaic, for the following reasons.
First, 8.0 m observations sample rest-frame K-band emission at typical SCUBA galaxy redshifts . They are therefore much less affected than shorter-wavelength observations by extinction due to the dust known to be abundant in galaxies that are actively forming stars (Schmitt et al. 2006). This rest-frame K-band emission is also a good proxy for stellar mass (Cole et al. 2001); it is therefore more sensitive to total star formation history than shorter-wavelength observations that are relatively more affected by recent star formation.
Second, high-redshift galaxies like those selected at submm wavelengths typically have red infrared colors that are well-suited to detection at 8.0 m (Egami et al. 2004, Huang et al. 2004, Frayer et al. 2004b), or at least they have red optical and near-infrared colors (Pope et al. 2005, Frayer et al. 2004a, Borys et al. 2004, Ivison et al. 2002). Lockman Hole galaxies were detected in 450 and 850 m SCUBA maps with stacking analyses at 5.8 and 8.0 m by Serjeant et al. (2004) but not at 3.6 or 4.5 m. In addition, although the 3.6 and 4.5 m Spitzer observations in the 14h field are somewhat more sensitive than the 8.0 m mosaic, they tend to detect more of the blue, relatively numerous, low-redshift galaxies that are unrelated to the SCUBA-selected population. The resulting contamination problem is of course more severe at shorter wavelengths, e.g., K-band. At 8.0 m we avoid to a great degree the problems of false associations that affect these other bands, without missing sources: all potential 8.0 m counterparts we considered are also detected in the 3.6 m mosaic.
Third, the 8.0 m mosaics themselves are very deep – down to a 5 point source sensitivity of 5.8 Jy. We used two very simple models of star formation history to calculate that this depth is easily sufficient to detect typical SCUBA galaxies. Both models (one a constant star formation rate model, the other a burst) give approximately equivalent results and suggest that at redshifts of the 8.0 m mosaics will detect star formation rates of and yr-1, respectively. This is comfortably below the rates found for submm galaxies (up to roughly yr-1, e.g., Smail et al. 2004, Yun & Carilli 2002, Lilly et al. 1999), so we can expect a priori that their 8.0 m counterparts are detected in the Spitzer data.
This paper describes the Spitzer observations, the 8.0 m counterpart identification procedure, and the inferences to be drawn from the panchromatic SEDs of infrared-selected SCUBA counterparts. A companion paper (Dye et al. 2006) describes the inverse process, whereby we determine the average submillimeter emission at the positions of the Spitzer sources found in the field.
The next Section describes the Spitzer/IRAC and MIPS observations and presents infrared images at the known locations of the SCUBA galaxies. We then outline the scheme used to identify the most-likely infrared counterparts of the submillimeter galaxies in Section 3. The infrared properties of the likely counterparts are analyzed in Section 4.
2 Observations and Data Reduction
2.1 The IRAC Observations
The IRAC (Fazio et al. 2004) observations were carried out as part of Spitzer Guaranteed Time Observing program number 8 to deeply image the Extended Groth Strip (EGS). The first visit to the field was in 2003 December. The field was observed again during a second epoch in 2004 June at a different position angle. The IRAC exposures (each of which covered a 51212 field of view with pixels in size) totaled 52 dithered 200 s exposures at 3.6, 4.5, and 5.8 m, together with 208 dithered 50 s exposures taken concurrently at 8.0 m at all positions in a map. Each dither cluster was separated from its neighbor by 290″, slightly less than the IRAC field of view. Because the field was observed at position angles differing by roughly during the two epochs it was straightforward to remove most of the well-known instrumental artifacts (multiplexer bleed, banding) during mosaicing. The resulting point-source sensitivity was 24.0, 24.0, 21.9, and 22.0 mag (AB, 5), in the 3.6, 4.5, 5.8, and 8.0 m bands, respectively. This corresponds to flux density levels of 0.9, 0.9, 6.3, and 5.8 Jy in the four IRAC bands. All magnitudes given in this work are on the AB system.
Sources in the IRAC mosaics were identified and extracted using SExtractor (Bertin & Arnouts 1996). The software was configured with a 2.5 detection threshold and a minimum object area of at least 5 pixels. The result was a band-merged photometric catalog of objects for all four IRAC wavelengths; photometry was performed using 3″ diameter apertures centered at the positions computed at 3.6 µm. All sources here are pointlike in the IRAC bands. To permit comparison with total magnitudes in the other bands, appropriate corrections were applied to obtain total magnitudes from the aperture magnitudes. The density of 8.0 m sources brighter than 5.8 Jy is roughly 11 per square arcminute.
2.2 The MIPS Observations
The MIPS (Rieke et al. 2004) observations of the EGS were carried out on 2004 June 19 and 20. The MIPS 24 m channel (m; m) used a 128128 Si:As array with a pixel scale of 255 pixel-1, providing a field of view of 54. The 70 m channel (m; m) uses a 3232 Ge:Ga array with a pixel scale of 998 pixel-1, but one half of the array is not usable due to a high noise caused by a cabling problem. The effective 70 m array size is therefore 32 16 pixels, providing a field of view of 5226.
The area was observed in scan map mode at slow rate with scan legs 24 long. This results in an integration time of 100 sec pixel-1 per scan pass (10 frames10 s) at both 24 and 70 m. In scan mode images at these two wavelengths are obtained simultaneously. Pairs of scan map observations, with a cross-scan offset of one full array (296″), were executed 6 times, with an offset of 21″ between successive pairs. The effective integration time is therefore 1500 s (12 passes) at 24 m for locations near the long centerline of the strip, decreasing to 700 s 5 ′ from the centerline. At 70 m, the integration time is only half as much due to the loss of half of the detector array. The final scan maps cover an area 2.4°10′ with an integration time sec pixel-1. A smaller 2°6′ strip in the center, encompassing most of the CUDSS field, was covered with an integration time of 1300–1600 seconds.
The data were reduced and mosaiced with the MIPS Data Analysis Tool (Gordon et al. 2004). The 24 m scan images were resampled and mosaiced at half the original instrument pixel scale (125) while at 70 m the original pixel scale was preserved. The point spread functions in the mosaics have FWHMs of 6″ and 18″ at 24 and 70 m, respectively. The resulting 5 point source sensitivities are respectively 70 Jy and 7 mJy at 24 and 70 m.
2.3 Observations at Other Wavelengths
We have drawn from several pre-existing photometric catalogs in order to construct SEDs spanning as wide a wavelength range as possible for our counterparts. For the U, B, V, and I band photometry, we used the Canada-France Deep Field Survey (McCracken et al. 2001, hereafter CFDF) survey data. CFDF magnitudes are calculated within 2.5″ diameter apertures. The 3 CFDF limiting magnitudes are 27.71, 26.23, 25.98, and 25.16 mag in U, B, V, and I, respectively. At R we use the very deep image acquired at the Subaru telescope with Suprime; our R-band photometry has a limit of 26.6 mag (Miyazaki 2006, private communication). For z-band we use the catalog constructed by Brodwin et al. (2006), converting Vega to AB magnitudes by adding a constant 0.54 mag. The limiting magnitude of the z-band data is 25.0 (), within 2.5″ diameter apertures. The -band photometry data are drawn from the observations described by Webb et al. (2003), converting to AB magnitudes using . -band magnitudes were measured within 3″ apertures. Because the -band data were acquired at two facilities, the depth is nonuniform but it generally extends down to mag (). All visible and near-infrared sources considered here are small compared to the apertures used; we therefore treat the aperture magnitudes as total magnitudes.
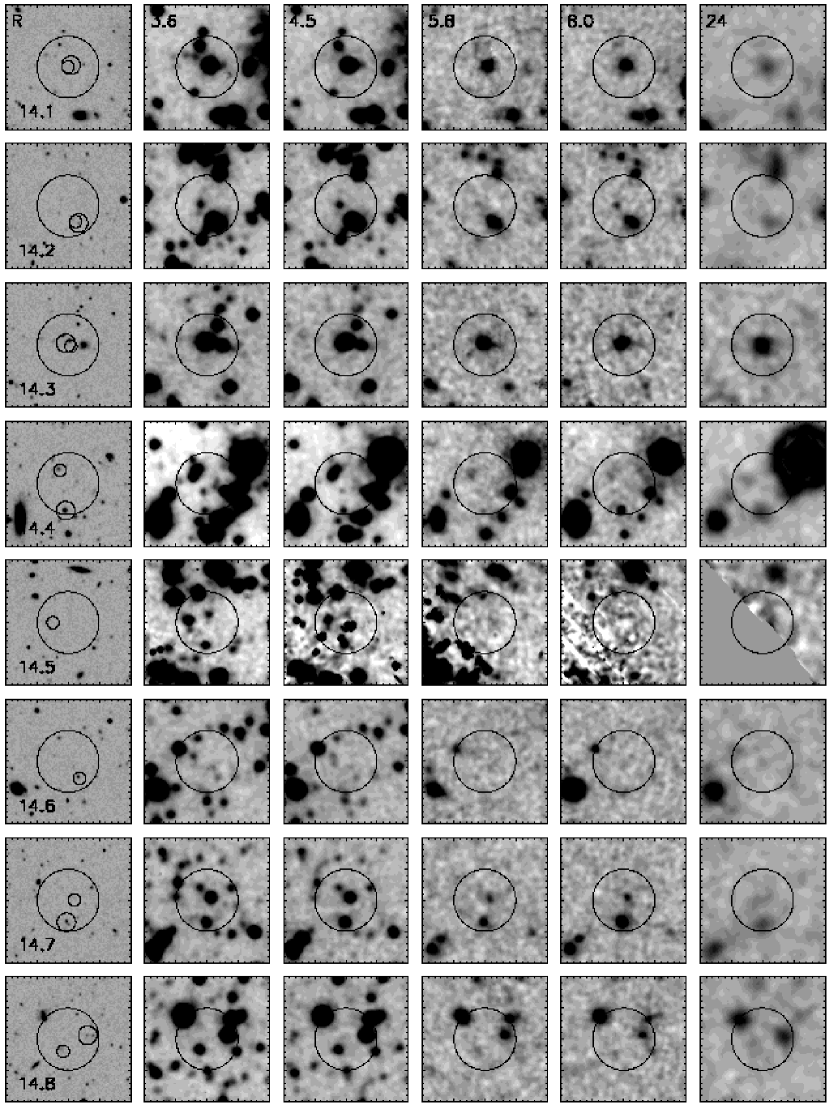
Two of the submillimeter galaxies (14.13 and 14.18) have Infrared Space Observatory (ISO) 15 m fluxes reported by Flores et al. (1999). One of these (14.13) was observed using Spitzer’s Infrared Spectrograph (IRS) in low-resolution mode by Higdon et al. (2004), who also report a 16 m flux density from the IRS Peakup Imager. Finally, we have also made use of the Chandra X-ray Observatory (CXO) source catalog compiled by Nandra et al. (2005). A montage showing our observations at R, 3.6, 4.5, 5.8, 8.0, and 24 m at the locations of each of the 23 SCUBA sources in the 14h field is provided in Figure 1.
3 The Mid-Infrared Identifications
3.1 The Identification Procedure
To avoid spurious sources we restrict our investigation to portions of the 14h field covered by at least ten 8 m IRAC exposures. With this constraint the IRAC coverage allows counterpart identifications for 20 of the 23 SCUBA galaxies in this field.
We identify IRAC counterparts of the SCUBA sources using a two-part approach, consisting first of a proximity search of the IRAC 8.0 m source catalog, followed by an examination of the infrared SEDs of all possible matches. We first use a metric based on 8.0 m brightness and positional coincidence to select likely counterparts. We restrict the search to IRAC objects within 10″ of each SCUBA source, for several reasons. The primary motivation is to adopt a (conservative) value slightly larger than the ″ uncertainty in the SCUBA positions, so as not to miss any true counterparts that might lie at relatively large separations, while simultaneously avoiding such a large value that we include a large number of unassociated foreground objects in the search. We find that a 10″ search radius often selected just one (or at most three) candidates, and was therefore well-matched to our IRAC source density. Based on the source surface density down to the 5 limit of our survey, on average one IRAC 8 m source should randomly reside within each 10″ radius search area.
Borys et al. (2004) found 11 counterparts within 7″ of 19 submillimeter objects in the Hubble Deep Field North, implying a substantial fraction may lie beyond this radius. Similarly, Wang et al. (2004) identified five of their 20 X-ray counterparts and two of their six mid-infrared counterparts to submillimeter galaxies in the same field at separations greater than 7″. By contrast Lilly et al. (1999) found at least 90% of the visible-wavelength counterparts to the submillimeter galaxies in the CUDSS 14h field are present within 7″, but their analysis includes only six sources. Our 10″ criterion is also safely larger than the mostly-likely average 850 m-infrared offset of 2″ determined from the stacking analysis discussed by Dye et al. (2006).
All potential counterparts are listed in Table 1. In seven cases (see below) a single, obvious best counterpart was identified. In instances where the identifications were not clear-cut, we applied a second criterion based on infrared color to refine the identifications. Specifically, we made use of -band photometry from Webb et al. (2003) as well as our own IRAC photometry to discriminate the most likely counterpart among multiple candidates. In doing so, we made one important assumption. We a priori assumed, based on spectroscopic studies (Chapman et al. 2003, 2005), that the true counterparts must reside at high redshift and that the SEDs must be consistent with this fact. We applied color criteria developed by Huang et al. (2004; see their Table 2), who use the -to-IRAC colors to constrain a galaxy’s redshift into local, intermediate, and high-redshift regimes. Those criteria are summarized as follows: a blue color corresponds to redshifts . Red color is consistent with either an intermediate () or high redshift (1.3), depending on whether the mid-infrared color is blue or red, respectively. In Section 3.2 we make frequent use of this technique to select the best (highest-redshift) candidate among multiple possibilities. Details of the identifications for these 20 accessible sources are provided in the following Section.
3.2 Individual IRAC Identifications
Seven sources have secure identifications: 14.1, 14.3, 14.13, 14.17, 14.18, 14.19, and 14.23. Of these, all but 14.17 and 14.23 have relatively small position uncertainties. We have possible identifications for ten others: 14.2, 14.4, 14.7, 14.8, 14.10, 14.12, 14.14, 14.15, 14.20, and 14.22. Because their infrared colors and R-band morphologies are not those of dusty, high-redshift galaxies, we regard both potential 8.0 m identifications for 14.11 as dubious and do not include it in subsequent analysis. Likewise 14.6 and 14.21 which have no significant 8.0 m counterpart within 10″ of the SCUBA positions.
3.2.1 Sources with Radio Identifications
Objects 14.1, 14.3, 14.13, and 14.18 have 1.4 GHz positions available from Fomalont et al. (1991). A recalibration of the VLA data by M. Yun improved the effective beamwidth of this dataset to 4″ FWHM and resulted in a radio identification for 14.19 (Webb et al. 2003).
CUDSS 14.1. Our single 8.0 m identification is coincident with both the Webb et al. (2003) -selected candidate and the I-selected candidate from Lilly et al. (1999) within the positional uncertainties. There is also a MIPS 24 m source at this position.
CUDSS 14.3. Our only 8.0 m candidate is coincident with the Webb et al. (2003) candidate as well as the position observed by Chapman et al. 2005, who used Keck to obtain a spectroscopic redshift of for this object. This object is also an obvious MIPS 24 m source.
CUDSS 14.13. For this object the best candidates at and 8.0 m agree within the positional uncertainties. This object is also a strong MIPS 24 m source and was detected by ISO at 7 and 15 m at the same position. This is not surprising, because it is by far the brightest of all our IRAC candidates. This object was also observed with the Infrared Spectrograph on the Spitzer Space Telescope (Higdon et al. 2004) and exhibits a continuum slope consistent with a Seyfert 2 nucleus and no PAH emission. Our best position is coincident with that observed by Chapman et al. (2005), who used Keck to obtain a spectroscopic redshift of for this object; this places it in the lowest quartile of the submm galaxy redshift distribution.
CUDSS 14.18. For this object our 8.0 m search selects the same candidate as Webb et al. found at . This is identical to the I-selected candidate from Lilly et al. (1999) as well. Within the positional uncertainties, all three positions (IRAC+-selected+I-selected) are also coincident with the ISO 7 and 15 m detections. The 8.0 m object is also a bright 24 m source. Finally, the best IRAC position is coincident with that observed at Keck by Chapman et al. (2005), who found a spectroscopic redshift of for this object. This is a surprisingly low redshift compared to most SCUBA sources.
CUDSS 14.19. For this object our 8.0 m search selects a different best candidate than at . The IRAC candidate position lies just 2″ from the radio position and is coincident with significant 24 m emission.
3.2.2 Secure Identifications for Sources without Radio Identifications
We identify what we believe to be secure infrared identifications for two objects that lack radio counterparts, 14.17 and 14.23.
CUDSS 14.17. Our 8.0 m search selects a single best candidate and disagrees with the -selected candidate, which is not apparent in the mid-infrared mosaics. The 8.0 m candidate falls just 08 from the ISO detection and is detected by MIPS at 24 m. Thus despite the large offset (95) this identification appears secure.
CUDSS 14.23. Our 8.0 m search selects two candidates. One (B) is fainter, blue in , and offset 66 to the NE of the SCUBA position. The other, brighter source is red in and and is a strong source of 24 m emission. It is offset only 2″ from the SCUBA position. For these reasons we prefer candidate A. It is the same as the -selected candidate from Webb et al.
3.2.3 Possible Identifications
We identify plausible infrared counterparts to ten sources, none of which has a radio identification (but see discussion of 14.8 and 14.20 below).
CUDSS 14.2. Although we detect the Webb et al. (2003) candidate (14.2A in Table 1) in all IRAC bands, we also find a closer, fainter IRAC object (B) only 21 from the reported SCUBA position. However, candidate A is a source of MIPS 24 m emission and is much brighter at 8.0 m. For these reasons we adopt A as the more likely counterpart to 14.2. The Lilly et al. (1999) I-selected counterpart, which is distinct from both the - and IRAC-selected positions, is not detected in the IRAC mosaic at 8.0 m.
CUDSS 14.4. At 8.0 m there are three possible counterparts. Of these, C is approximately coincident with the Webb et al. candidate. Object C is also the faintest of the three candidates at 8.0 m and shows no significant 24 m emission. It is blue in , suggesting this object resides at . Thus C seems unlikely to be the correct counterpart. Object A presents a red color, but the upper limit is not sufficiently sensitive to constrain the redshift. Object A is a MIPS 24 m source. Object B has no counterpart in the 24 m catalog, but this is most likely because it is blended with an even brighter object to the NW. However object B presents a blue color, suggesting it lies at . Thus candidate A seems the most likely SCUBA counterpart among the IRAC sources, despite its relatively large separation (87) from the SCUBA position.
CUDSS 14.7. There are two possible 8.0 m counterparts within the 10″ search radius. One of them (A, the closer and fainter of the two) coincides with the Webb et al. (2003) -selected candidate. Although both are detected in all IRAC bands, only the southern source (B, the one more distant from the reported SCUBA position) is unambiguously detected by MIPS. The southern source exhibits multiple components in our deep R-band image. It also has a redder and colors and is by far the brighter source at 8.0 m. For these reasons we prefer candidate B. However, the SCUBA source is extended toward both IRAC objects. In addition, both IRAC candidates have red -to-4.5 m colors that suggest they both reside at . Thus while we prefer B we cannot rule out the possibility that both objects may contribute to the submillimeter flux.
CUDSS 14.8. Our 8.0 m search selects two candidates (A and B). There is emission at the location of the -selected candidate (B), but it is present at less than 5 significance. Candidate A is roughly 65 west of the best SCUBA position. There is 24 m emission at this position but not at the position of candidate B.
Interestingly, the -selected candidate may be a source of radio emission (Chapman et al. 2005), and a spectroscopic redshift has been obtained for it. The radio detection is regarded as somewhat marginal however (, S. Chapman 2005, private communication), and so the association of candidate B with the SCUBA source is not established with certainty. Object B is detected at 3.6 and 4.5 m with flux densities of 5.4 and 5.6 Jy, respectively, but it exhibits no significant emission at 5.8, 8, or 24 m. Because B has a blue mid-infrared SED and only A is significantly detected 8.0 m, we prefer A as the counterpart. This object has red -to-4.5 m colors that place it at , meaning it is possible that it could reside at the same redshift as candidate B as part of an interacting system.
CUDSS 14.10. Our 8.0 m search selects a different best candidate (A) than Webb et al. (B), 98 SW of the best SCUBA position. Candidate A shows and , suggesting it lies in the range . Candidate B, the -selected object, though closer to the SCUBA position (44 away), is almost 1 magnitude fainter at K, is blue in , and exhibits no significant emission at 5.8, 8, or 24 m. Hence A is the more likely counterpart.
CUDSS 14.12. Our 8.0 m diagnostic selects two candidates, neither of which is coincident with the -selected candidate. The -selected candidate is not detected in the 8.0 m mosaic. Candidate A lies 55 W of the SCUBA coordinates and exhibits significant 24 m emission. Neither A nor B is a source of significant 5.8 m emission. Although B is brighter at 8.0 m than A, it exhibits no significant 24 m emission. Hence A is the more likely candidate, although the identification is by no means secure.
CUDSS 14.14. At 8.0 m there are two candidates. Neither is coincident with the -selected candidate. Significant MIPS 24 m emission is associated only with candidate B. Likewise only this candidate has significant detections in all four IRAC bands. Furthermore, only candidate B is red in . Candidate B is our preferred counterpart on the basis of its relative brightness, the IRAC colors, and the presence of 24 m emission at its position.
CUDSS 14.15. There are two possible 8.0 m counterparts. One of these (A, the brightest) is coincident with the best -selected candidate and is a MIPS 24 m source. Candidate B, however, exhibits comparable 24 m emission, has a red color, and has an SED that peaks at 5.8 m, suggestive of a galaxy at . Although A is brighter at 8.0 m, B is a more likely candidate because of these SED features. Perhaps because the -band coverage at this location is relatively shallow, only a upper limit can be determined for candidate B. The R-band source seen in Figure 1 close to the apparent position of candidate B is not the visible-wavelength counterpart. Only upper limits could be established in the bands blueward of I for this object.
CUDSS 14.20. The 8.0 m search selects a different best candidate than Webb et al. . The IRAC candidate is not detected in our deep R-band image or the Webb et al. I-band image but is detected with mag. It therefore has red -to-4.5 m colors that place it at . There is no significant MIPS 24 m source within 10″ of the SCUBA position. Acquiring a visible-wavelength spectrum of this extremely optically-faint object would be very challenging. As is the case for 14.8, we select a different position than preferred by Chapman et al. (2005), who obtained a spectroscopic redshift of for the -selected candidate, where they detect 1.4 GHz emission. However, the radio identification, which is made at roughly 4 significance (S. Chapman 2005, private communication) may be incorrect.
CUDSS 14.22. The 8.0 m search finds two candidates. One of these (A) is coincident with the the -selected candidate to the NW. Even though both are red in , the fact that they are both blue in suggests that they lie in a relatively nearby redshift range and that we may have not detected the true counterpart of this object. However, only the southernmost candidate is a strong 24 m source, so we regard it as the more plausible IRAC counterpart.
For the sake of completeness, we examined the relatively faint 24 m source apparent in Figure 1 103 NNW of the SCUBA position, just outside the search radius. It is blue throughout the IRAC bands and is a much weaker 24 m source (232 Jy) than candidate B. It is therefore likely to be a low-redshift object and not associated with the SCUBA source.
3.2.4 Failed Identifications
CUDSS 14.6. Despite the excellent IRAC coverage at the location of CUDSS 14.6 (a total of 218 exposures), no sources in the IRAC 8.0m mosaic satisfy our selection criteria as a valid counterpart to CUDSS 14.6. Within 10″ of the reported SCUBA position, and specifically at the position identified by Webb et al. (2003), there is no significant 5.8, 8.0, or 24 m emission. Moreover, the K to 4.5 m colors of the K-selected counterpart are blue, suggesting that object lies nearby.
There is a faint source in the 8.0 m mosaic within the 10″ search radius, 85 to the NE of the SCUBA position. However, its low flux density (5.5 Jy) puts it below the 5 sensitivity of the 8.0 m mosaic. Like the K-selected counterpart it also has a blue color, implying that it resides relatively nearby. The object appears in three of the IRAC mosaics (it is not apparent at 5.8 m) and is therefore unquestionably real, but it is too faint to satisfy our selection criteria.
A significant 8.0 m detection (18 Jy) is located just outside the search area, 101 to the NE of the SCUBA position. It is red in but exhibits a blue color, suggesting it lies at an intermediate () redshift and is therefore unlikely to be the true counterpart.
Both of the 8.0 m sources mentioned above are as likely as not to be due to chance superposition. In combination with the color information this strongly suggests that no plausible counterpart to the SCUBA source is present in the IRAC mosaics.
CUDSS 14.11. At 8.0 m there are two indistinguishable best candidates, one of which (B) is coincident with the -selected candidate. Candidate A is closer to the SCUBA position, only 26 away. Neither shows any significant 24 m emission, and both exhibit the morphologies of elliptical galaxies in our deep R-band image. Furthermore, the blue infrared colors (, and ) and R-band morphologies are consistent with both objects being elliptical galaxies at . There is no significant 24 m emission within 10″ of the SCUBA position. For all these reasons, we conclude that we have not detected the true counterpart to this SCUBA source. A speculative possibility is that the 850 m emission detected by SCUBA is lensed by the foreground, low-redshift objects. The closest 24 m source (176 Jy) lies 157 NE of the SCUBA position and has blue colors throughout the IRAC bands.
CUDSS 14.21. There are no significant 8.0 m sources within 10″ of the SCUBA position of this source. We therefore attempt no identification. There is significant 3.6 and 4.5 m emission at the location of the -selected counterpart. This object is red in but blue in , suggesting that it may be at . At 5.8, 8.0, and 24.0 m only upper limits are available. We regard CUDSS 14.21 as unidentified at 8 m.
Assuming that these sources are not highly dust-obscured galaxies at such extremely high redshift () that their obscured rest-visible emission falls in the observed mid-infrared, we suggest three possible causes for the lack of plausible 8 m counterparts. In the case of CUDSS 14.11, it may be that the two foreground elliptical galaxies are screening a high-redshift SCUBA source from view at visible-mid-infrared wavelengths. A second alternative is that the submillimeter flux densities may include contributions from multiple weak components that lie within the SCUBA beam but not precisely at the reported SCUBA position. The SCUBA maps are known to be highly confused below 2 mJy (Knudsen et al. 2006, and references therein). Weak submillimeter sources that combine to yield an apparent SCUBA detection might well be individually too faint to detect even in the deep IRAC mosaic. Third, one of the SCUBA sources might be spurious, which would not be unreasonable given that the sample contains so many roughly 3 sources. CUDSS 14.6, 14.11, and 14.21 are detected in the 850 m maps at 4.2, 3.5, and 3.0 significance, respectively.
3.2.5 Objects with Insufficient Coverage
Three sources lie in a portion of the IRAC 8.0 m survey region for which fewer than 10 exposures were acquired. For these sources (14.5, 14.9, and 14.16) the depth of coverage was insufficient to reliably detect an infrared counterpart.
3.3 Reliability of IRAC Detections
Excluding ‘dubious’ associations, potential counterparts for 17 of 20 SCUBA galaxies having deep 8.0 m coverage in the 14h field have been identified (Table 2). Of these, the seven secure identifications have a mean offset from the SCUBA positions of 4.4” and the ten possible identifications have a mean offset of 7.7”. If one uses the available 1.4 GHz positions in preference to the SCUBA positions only the mean offset for the set of secure identifications changes (because no SCUBA sources with ‘possible’ identifications have radio positions), to 24. The mean offsets in right ascension and declination for the 17 counterparts are 25 and 09 (SCUBA - 8.0 m), respectively. All these offsets are smaller than the SCUBA positional uncertainties.
Of course, a small number of the 8.0 m-selected counterparts are chance associations and not physically associated with the corresponding SCUBA source. In the following we address this issue in two ways. First, we derive an estimate of the number of such chance associations using a statistical analysis. Second, we compare the infrared-submm colors of our counterparts to those that have been reliably identified in a deep IRAC survey of the Lockman Hole region by Egami et al. (2004).
We first employ a variant of the statistical formalism used by Lilly et al. (1999) and others to assess the significance of possible matches. Specifically, we estimate a statistic, usually denoted , that a candidate IRAC source lies within the search distance (10″) of a SCUBA source to which it is unrelated. The statistic is where and is the surface density of IRAC sources at least as bright as the candidate. Thus lower values of suggest a higher likelihood that the association of the IRAC and SCUBA sources is significant. Unlike Lilly et al. (1999) we treat all sources within the 10″ search radius equally with respect to their offset from the SCUBA position. In doing so we avoid unduly biasing our selection toward sources at small offsets from the uncertain SCUBA positions.
We use Table 1 of Webb et al. (2003) for the SCUBA sources’ coordinates, except for CUDSS 14.1, 14.3, 14.13, 14.18, and 14.19. The first four of these objects have VLA positions (Eales et al. 2000) with lower uncertainties (roughly 2″). Similarly, we adopt the radio position reported for 14.19 by Webb et al. (2003), although it is offset from the nominal SCUBA position by 85. We found no significant differences in our lists of most-likely matches when we repeated the analysis using the less-certain SCUBA positions.
In order to interpret the -values, we performed a Monte Carlo analysis in which randomly-generated catalogs of IRAC sources were searched for counterparts in a manner identical to that employed for the real sources. The random catalogs were constructed to present brightness distributions and source densities identical to those of the real catalog. The -distributions for the random and real samples are compared in Figure 3. We calculate the probability of finding a random or unassociated source as bright as the observed candidate as , where is the ratio of the number of random sources with smaller values of than the candidate to the total number of random sources generated in the Monte Carlo calculation. Although the statistics are not meaningful for individual sources, the sum of the statistics tabulated in Table 1 is an estimate of the number of spurious identifications. We cannot say which particular identifications are wrong, but the sums for the seven secure and the ten possible identifications are 0.61 and 2.61, respectively, implying that the bulk of the errors apply to the latter subset, as one would expect. For the sample as a whole, the sum is 3.22, suggesting that about three of our 17 identifications are incorrect. This estimate (three false identifications) is a pessimistic one, because the probability formalism from which it is derived does not account for our use of color information to winnow lists of multiple candidates down to single most-likely counterparts. Three is in fact the maximum number of likely false sources, because we have taken into account the to mid-infrared colors as well as the presence of 24 m MIPS emission as identification criteria.
When the estimate for the number of spurious sources is subtracted, our identification rate is (conservatively) 14/20, or 70%. This is comparable to or better than rates described elsewhere. Borys et al. (2004) recovered 11 of 19 (57%) SCUBA source in the HDF-N. Pope et al. (2005) reported a 72% recovery rate for SCUBA sources in the GOODS-N field, although this figure doesn’t account for possible erroneous associations. Like Pope et al. (2005) we recovered essentially all the SCUBA sources with secure radio positions (but see the discussions of 14.8 and 14.20 above). More straightforward comparisons can be made with Lilly et al. (1999) and Webb et al. (2003), because the statistics they provide permit one to estimate the number of incorrect associations in a manner identical to that applied to our own sample. Lilly et al. (1999) identified counterparts for eight of the 12 submillimeter sources they observed at visible wavelengths. The sum of the resulting statistics was , suggesting a total identification rate of 7/12 or 58%. Likewise the Webb et al. (2003) -band counterparts for which the statistics sum to , implying a total identification rate of 17/23 or 74% (but see below).
Egami et al. (2004) presented mid-infrared through submillimeter flux densities measured by Spitzer for SCUBA sources in a area of the Lockman Hole East. Because these sources have radio counterparts from Ivison et al. (2002) their positions are well-localized, and the mid-infrared identifications are secure. For this reason, the Egami et al. (2004) submillimeter sample provides a useful basis with which to assess our own larger sample of infrared-selected counterparts.
Figure 4 shows the distributions of submillimeter galaxies in the IRAC versus color-color space. The portion of this space occupied by the Lockman Hole sources and the secure identifications of the CUDSS 14h field sources are approximately coextensive; they define a locus in which other counterparts sources may be expected to fall. This is indeed the case for the ‘possible’ sources taken as a group – the distribution of these objects occupies a very similar region of this color-color space overall as do the secure sources.
In general, when the counterpart is bright, the - and 8.0 m-selected counterparts are identical. However, the mid-infrared technique selects different counterparts than Webb et al. (2003) in 10 cases (CUDSS 14.4, 14.7, 14.8, 14.10, 14.12, 14.14, 14.15, 14.19, 14.20, and 14.22). The - and 8.0 m-selected techniques disagree for three additional cases (CUDSS 14.6, 14.11, and 14.21) for which the mid-infrared technique identifies no plausible counterparts. CUDSS 14.11 is a nearby elliptical galaxy and is therefore unlikely to be the source of the submillimeter emission. CUDSS 14.6 and 14.21 have no plausible counterparts in the 8.0 m mosaics. The - and 8.0 m-selected counterparts therefore disagree in a total of 13 cases (slightly more than half the total). With the exception of the counterpart to CUDSS 14.7A (which as noted above may indeed be a contributor to the submillimeter emission), the distribution of the -selected sources is clearly blue in both colors compared to the other objects. In particular it lies close to the region occupied by a passively evolving elliptical galaxy. Only six -selected counterparts are plotted because the remainder are undetected at both 5.8 and 8.0 m, however the colors of all these other sources tend to be similarly blue in and not like the distributions of the secure identifications (Table 1). We conclude that the 8.0 m-selected counterparts are therefore more likely to be the correct counterparts in these discrepant cases.
Figure 5 shows the same populations but in versus color-color space. Again, the distributions of the Lockman Hole counterparts and the secure sources from this work are similar. CUDSS 14.13 and 14.18 are understandable exceptions on account of their relatively low redshifts. And as before, the ‘possible’ counterparts occupy a region of this color-color space that is reassuringly similar to that of the secure sources. That is not the case for the discrepant -selected counterparts. These objects lie at the outskirts of the secure counterparts’ distribution. Based on the Lockman Hole sources and the secure 8.0 m-selected sources (not including CUDSS 14.13 and 14.18), one would expect the typical color of a SCUBA galaxy to be between 3 and 4 magnitudes. Not one of the discrepant -selected counterparts lies in this range, and indeed only one (14.15A) is even detected at 24 m.
Analogous trends are apparent in versus color-color space shown in Figure 6. The secure 8.0 m-selected sources occupy the same region of this color-color space as the Lockman Hole sources, and that region is spanned by the possible 8.0 m identifications. The low-redshift objects are not outliers in this distribution. As before, the discrepant -selected counterparts tend to be blue in and with the exception of 14.7A do not overlap with the securely identified counterparts; half of these discrepant sources are so blue they are not even detected at 8 or 24 m.
4 Discussion
4.1 SEDs of SCUBA Sources Detected by IRAC
Figure 7 shows the SEDs of our most-likely IRAC counterparts to the SCUBA sources in this field, showing the diversity of spectral shapes present within the sample. The galaxies divide roughly into two categories. The majority (12 objects) show evidence in the IRAC bands for the 1.6 m bump arising from the H- opacity minimum. In other words, these objects appear to be powered primarily by stars and not by a compact object. CUDSS 14.18 is among these sources, in agreement with Chapman et al. (2005).
Four objects in the sample (sources 14.3, 14.7, 14.13, and 14.19) show the monotonically rising SEDs indicative of AGN-dominated emission. These sources fulfill all three of the IRAC-color AGN selection criteria proposed by Lacy et al. (2004), Stern et al. (2005), and Hatziminaoglou et al. (2005). Source 14.4 has an unusual SED, very faint in the three shortest-wavelength IRAC bands compared to the optical and 8 and 24 m. This source also has a monotonic rise through the IRAC bands, so we consider it a tentative AGN candidate.
Simple color criteria developed from shallow IRAC surveys like those cited above are not adequate to separate AGN from starburst galaxies at high redshift however. We therefore chose to perform a simple SED fitting procedure to determine whether a galaxy is AGN-dominated, in exactly the same way as Barmby et al. (2006) did for other sources in the Extended Groth Strip.
Specifically, we fit power laws () to IRAC flux densities as an empirical way of characterizing their SEDs. Seven sources have acceptable power-law fits. Source 14.14 has a blue power-law (), source 14.18 has , and five others 14.3, 14.7, 14.12, 14.13, and 14.19) have good fits to red power-laws. Source 14.4 does not fit a power-law well because of a very steep rise in the SED at 8.0 m.
AGNs thus selected on the basis of the IRAC-MIPS SEDs show good agreement with AGNs discovered on the basis of their X-ray emission. Four objects with secure mid-infrared power-law AGN signatures are X-ray sources (14.3, 14.7, and 14.19 are Nandra et al. 2005 objects c111, c113, and c128 respectively; 14.13 is source c72 in the list of Nandra et al. and source 23 in Waskett et al. 2003). CUDSS 14.12 and 14.4 (the tentative AGN candidate), show no X-ray emission.
Our classification of 14.13 as AGN-dominated agrees with Higdon et al. (2004) and Le Floc’h et al. (2006, in preparation), although Chapman et al. (2005) call it a starburst. Given the small numbers involved, our finding that between five and six members of the sample are AGN-dominated is not inconsistent with the assertion by Alexander et al. (2004) that “at most 20%” of the luminosity of submillimeter galaxies arises from AGN. They found that bright ( mJy) SCUBA sources host AGNs at twice this rate (38%), although star formation tends to dominate the energy output.
In summary, the number of SCUBA counterparts apparently dominated by an AGN in the mid-infrared could be as few as five (CUDSS 14.3, 14.7, 14.12, 14.13, and 14.19) or as many as six (if 14.4 is included). There could be others not detectable using our approach: Barmby et al. (2006) found that not all (X–ray selected) AGN show clear mid-infrared signatures.
Figure 8 shows the 850 m flux density distribution of the 23 SCUBA galaxies. Our 17 counterparts span the full range occupied by the sample, including all of the brightest SCUBA sources and all but one of the faintest. There is no evidence that our recovery rate is biased toward either the high- or low-brightness SCUBA sources, based on a Kolmogorov-Smirnov (KS) test comparing a sample consisting of the retrieved sources with another sample consisting of all 23 SCUBA galaxies. Furthermore, AGN-dominated objects occupy the middle of the distribution, without any obvious skew toward either the high- or low-brightness extreme of the distribution.
4.2 Infrared Colors of SCUBA Galaxies
The infrared color distributions of the IRAC counterparts to the SCUBA galaxies are shown in Figure 9, and the means and dispersions are given in Table 3. Colors at longer wavelengths present greater diversity (larger dispersions) both for the SCUBA counterparts and for the full sample of all 8m-detected galaxies in the field, but the color distributions are consistently tighter for the counterparts. In particular, the counterparts do not overlap the blue wings of the distributions of the field galaxies. The SCUBA counterparts are slightly redder in the IRAC bands relative to the full sample of all IRAC galaxies in the CUDSS 14h field. Although the difference in any one color is small, it amounts to nearly 1 magnitude in . This is unlikely to be a selection effect. The seven counterparts (14.1, 14.3, 14.13, 14.17, 14.18, 14.19, and 14.20) identified without recourse to any color criteria show no significant color differences from the larger sample.
Given the dispersions, the differences in mean colors between SCUBA galaxies and field galaxies are only marginally significant. The KS test, however, is sensitive to the lack of blue galaxies in the counterpart sample. The KS-derived probabilities of drawing samples of SCUBA counterparts that are as different as observed from the sample consisting of all 8 m-detected galaxies are , , and for the , , and color distributions, respectively, if the underlying populations are the same. In other words, the color distributions are significantly different.
Figure 10 shows the [8.0] - [24.0] and K - [3.6] color distributions for the IRAC-detected galaxies in this field. Both distributions exhibit much larger dispersions than the IRAC-only colors plotted in Figure 9. Despite the fact that in some cases the IRAC counterpart was selected on the basis of the presence and/or strength of MIPS 24 m emission, there are no significant differences in the mean [8.0] - [24.0] colors or dispersions of the full sample and the counterparts. The K - [3.6] color distributions are likewise indistinguishable (given the wide range of colors exhibited by the sample). When we compare the color distributions using KS tests we find no evidence that the samples are different with respect to either K - [3.6] or [8.0] - [24.0] color.
5 Summary
Deep IRAC mosaics identify infrared counterparts for 17 of 20 SCUBA galaxies in the CUDSS 14h field. The recovery rate of SCUBA galaxies at 8.0 m is comparable to or better than that found in other counterpart surveys, once the likelihood of mistaken identifications is estimated (three or fewer for the current work). For more than half of the sample, the most-likely 8.0 m counterpart is different than the K-selected counterpart. Multiband IRAC-MIPS SEDs allow one to identify and avoid unlikely candidates in the SCUBA beam (e.g., elliptical galaxies). This suggests that the mid-infrared regime in general (and the IRAC 8.0 m band in particular) offers a more reliable means than ground-based optical or near-infrared surveys for identifying the true counterparts to the high-redshift, dusty starforming galaxies detected in submillimeter surveys.
On the basis of power-law fits to the infrared IRAC-MIPS SEDs we infer that five or possibly six of the counterparts are AGN-dominated. The 8.0 m counterparts have redder infrared colors than the general population of IRAC-detected galaxies in the field. Five counterparts have IRAC-MIPS SEDs that are fit well by red power laws and are likely to be AGN-dominated. One more is fit well by a slightly blue power-law and may also harbor an active nucleus. Four of these six objects are detected in X-ray observations, lending further support to the AGN hypothesis. The remaining counterparts are likely to be dominated by starburst emission.
References
- Alexander et al. (2004) Alexander, D. M., Smail, I., Bauer, F. E., Chapman, S. C., Blain, A. W., Brandt, W. N., & Ivison, R. J. 2004, Nature, 434, 738
- Barger et al. (1988) Barger, A. J., et al. 1998, Nature, 394, 428
- Barmby et al. (2006) Barmby, P. et al. 2006, ApJ, in press (astro-ph/0512618).
- Bertin & Arnouts (1996) Bertin, E., & Arnouts, S., 1996, A&AS, 117, 393
- Blain et al. (2002) Blain, A. W., Smail, I., Ivison, R. J., Kneib, J.-P., & Frayer, D. T. 2002, Phys. Rep., 369, 111
- Borys et al. (2004) Borys, C., et al. 2005, MNRAS, 355, 485
- Brodwin et al. (2006) Brodwin, M., et al. 2006, ApJS, 162, 20
- Chapman et al. (2003) Chapman, S. C., Blain, A. W., Ivison, R. J., & Smail, I. R. 2003, Nature, 422, 695
- Chapman et al. (2005) Chapman, S. C., Blain, A. W., Smail, I. R., & Ivison, R. J. 2005, ApJ, 622, 722
- Clements et al. (2004) Clements, D., et al. 2004, MNRAS, 351, 447
- Cole et al. (2001) Cole, S., et al. 2001, MNRAS, 326, 255
- Dye et al. (2006) Dye, S., et al. 2006, ApJ, accepted (astro-ph/0512357).
- Eales et al. (1999) Eales, S., Lilly, S., Gear, W., Dunne, L., Bond, J. R., Hammer, F., Le Fèvre, O., & Crampton, D. 1999, ApJ, 515, 518
- Eales et al. (2000) Eales, S., Lilly, S., Webb, T., Dunne, L., Gear, W., Clements, D., & Yun, M. 2000, AJ, 120 2244
- Egami et al. (2004) Egami, E., et al. 2004, ApJS, 154, 130
- Fazio et al. (2004) Fazio, G. G., et al. 2004, ApJS, 154, 10
- Flores et al. (1999) Flores, H., et al. 1999, ApJ, 517, 148
- Fomalont et al. (1991) Fomalont, E. B., Windhorst, R. A., Kristian, J. A., & Kellerman, K. I. 1991, AJ, 102, 1258
- Frayer et al. (2004a) Frayer, D. T., et al. 2004a, AJ, 127, 728
- Frayer et al. (2004b) Frayer, D. T., et al. 2004b, ApJS, 154, 137
- Gordon et al. (2004) Gordon, K. S., et al., 2004, SPIE vol. 5487, ed. J. C. Mather, 177
- Hatziminaoglou et al. (2005) Hatziminaoglou, E. et al. 2005, AJ, 129, 1198
- Higdon et al. (2004) Higdon, S. J. U., et al. 2004, ApJS, 154, 174
- Huang et al. (2004) Huang, J.-S., et al. 2004, ApJS, 154, 44
- Hughes et al. (1998) Hughes, D. H., et al. 1998, Nature, 394, 241
- Ivison et al. (2002) Ivison, R. J., et al. 2002, MNRAS, 337, 1
- Knudsen et al. (2006) Knudsen, K. K., et al. 2006, MNRAS, in press (astro-ph/0602131)
- Lacy et al. (2004) Lacy, M. et al. 2004, ApJS, 154, 166
- Lilly et al. (1999) Lilly, S.J., Eales, S. A., Gear, K.P., Hammer, F., Le Fèvre, O., Crampton, D., Bond, J.R., and Dunne, L. 1999, ApJ, 518, 641
- McCracken et al. (2001) McCracken, H. J., Le Fèvre, O., Brodwin, M., Foucaud, S., Lilly, S. J., Crampton, D., & Mellier, Y., 2001 å, 376, 756
- Nandra et al. (2005) Nandra, K., et al. 2005, MNRAS, 356, 568
- Pope et al. (2005) Pope, A., Borys, C., Scott, D., Conselice, C., Dickinson, M., & Mobasher, B. 2005, MNRAS, 358, 149
- Rieke et al. (2004) Rieke, G., et al. 2004, ApJS, 154, 25
- Schmitt et al. (2006) Schmitt, H. R. et al. 2006, in preparation (astro-ph/0602064)
- Serjeant et al. (2004) Serjeant, S., et al. 2004, ApJS, 154, 118
- Smail, Ivison, & Blain (1997) Smail, I., Ivison, R. J., & Blain, A. W. 1997, ApJ, 490, L5
- Smail, et al. (2004) Smail, I., Chapman, S. C., Blain, A. W., & Ivison, R. J. 2004, ApJ, 616, 71
- Stern et al. (2005) Stern, D. et al. 2005, ApJ, 631, 163
- Wang, Cowie, & Barger (2004) Wang, W.-H., Cowie, L. L., and Barger, A. J. 2004, ApJ, 655, 671
- Waskett et al. (2003) Waskett, T. J., et al. 2003, MNRAS, 341, 1217
- Webb et al. (2003) Webb, T. M. A., et al. 2003, ApJ, 597, 680
- Yun & Carilli (2002) Yun, M. S., & Carilli, C. L., 2002, ApJ, 568, 2002
![[Uncaptioned image]](/html/astro-ph/0603198/assets/x2.png)
Fig. 1. Continued.
![[Uncaptioned image]](/html/astro-ph/0603198/assets/x3.png)
Fig. 1. Continued.


| SCUBA | Candidate | F3.6 | F4.5 | F5.8 | F8.0 | F24.0 | R.A. | Decl. | OffsetaaOffsets to SCUBA positions given in parentheses where 1.4 GHz data are available. | P′ |
|---|---|---|---|---|---|---|---|---|---|---|
| Name | (Jy) | (Jy) | (Jy) | (Jy) | (Jy) | (J2000) | (arcsec) | |||
| †14.1bbCounterpart search based on 1.4 GHz detections from Eales et al. (2000). | 40.7 | 44.8 | 32.5 | 41.1 | 191 | 14 17 40.22 | 52 29 06.5 | 1.07(0.28) | 0.11 | |
| †14.2 | A | 38.5 | 45.0 | 41.5 | 27.0 | 150 | 14 17 51.33 | 52 30 24.9 | 6.55 | 0.18 |
| 14.2 | B | 2.0 | 3.3 | 5.5 | 8.6 | 14 17 51.93 | 52 30 30.8 | 2.12 | 0.45 | |
| †14.3bbCounterpart search based on 1.4 GHz detections from Eales et al. (2000). | 35.0 | 41.0 | 48.6 | 48.4 | 408 | 14 18 00.58 | 52 28 21.3 | 0.87(2.32) | 0.078 | |
| †14.4 | A | 2.7 | 3.6 | 5.2 | 27.2 | 239 | 14 17 43.43 | 52 28 05.8 | 8.71 | 0.18 |
| 14.4 | B | 52.8 | 49.2 | 40.7 | 40.9 | 14 17 42.41 | 52 28 11.6 | 9.07 | 0.11 | |
| 14.4 | C | 7.4 | 8.7 | 9.5 | 6.2 | 14 17 43.80 | 52 28 16.8 | 4.71 | 0.52 | |
| 14.6 | 1.8 | 1.8 | 5.5 | 14 17 57.02 | 52 29 14.7 | 8.50 | 0.51 | |||
| 14.7 | A | 8.4 | 10.6 | 11.7 | 12.9 | 14 18 00.95 | 52 29 50.0 | 1.68 | 0.35 | |
| †14.7 | B | 5.3 | 10.6 | 20.2 | 51.3 | 150 | 14 18 01.15 | 52 29 42.0 | 7.02 | 0.071 |
| †14.8 | A | 21.4 | 24.5 | 24.7 | 15.3 | 275 | 14 18 02.01 | 52 30 16.3 | 6.43 | 0.31 |
| 14.8 | B | 5.4 | 5.6 | 4.9 | 2.9 | 14 18 02.70 | 52 30 10.4 | 5.25 | 0.76 | |
| †14.10 | A | 50.1 | 48.4 | 34.8 | 38.3 | 307 | 14 18 03.00 | 52 29 33.2 | 9.81 | 0.12 |
| 14.10 | B | 4.3 | 3.2 | 14 18 03.98 | 52 29 40.6 | 2.20 | 0.86 | |||
| 14.11 | A | 153.6 | 99.5 | 66.7 | 36.0 | 14 17 46.89 | 52 32 36.1 | 2.69 | 0.13 | |
| 14.11 | B | 225.3 | 140.8 | 92.7 | 50.3 | 14 17 47.32 | 52 32 42.1 | 4.60 | 0.075 | |
| †14.12 | A | 3.7 | 5.7 | 8.0 | 80 | 14 18 04.70 | 52 28 56.0 | 5.48 | 0.47 | |
| 14.12 | B | 3.1 | 4.2 | 18.3 | 14 18 05.69 | 52 29 03.3 | 8.60 | 0.33 | ||
| †14.13bbCounterpart search based on 1.4 GHz detections from Eales et al. (2000). | 580.1 | 981.7 | 1448.5 | 2225.5 | 5646 | 14 17 41.88 | 52 28 23.5 | 0.67(6.46) | 0.0013 | |
| 14.14 | A | 9.9 | 8.3 | 3.4 | 6.2 | 14 18 09.06 | 52 31 00.5 | 4.78 | 0.52 | |
| †14.14 | B | 9.4 | 10.7 | 7.8 | 6.9 | 120 | 14 18 08.21 | 52 31 08.1 | 6.16 | 0.50 |
| 14.15 | A | 30.8 | 26.7 | 19.7 | 17.1 | 103 | 14 17 29.87 | 52 28 21.5 | 5.83 | 0.28 |
| †14.15 | B | 7.4 | 10.8 | 15.3 | 12.1 | 93 | 14 17 28.44 | 52 28 19.8 | 7.90 | 0.37 |
| †14.17 | 47.1 | 47.0 | 34.6 | 77.0 | 266 | 14 17 24.44 | 52 30 46.1 | 9.48 | 0.049 | |
| †14.18bbCounterpart search based on 1.4 GHz detections from Eales et al. (2000). | 159.7 | 138.1 | 143.0 | 164.7 | 1078 | 14 17 42.11 | 52 30 25.7 | 0.61(1.51) | 0.029 | |
| †14.19ccCounterpart search based on 1.4 GHz position reported by Webb et al. (2003). | 15.3 | 20.6 | 21.1 | 25.2 | 84.0 | 14 18 11.26 | 52 30 12.3 | 2.33(8.59) | 0.20 | |
| †14.20 | 18.5 | 21.2 | 18.6 | 13.9 | 14 17 50.51 | 52 30 55.2 | 8.87 | 0.34 | ||
| 14.22 | A | 29.2 | 28.1 | 19.6 | 19.1 | 14 17 55.08 | 52 32 08.4 | 7.91 | 0.25 | |
| †14.22 | B | 72.1 | 66.7 | 49.1 | 50.3 | 500 | 14 17 56.80 | 52 31 57.8 | 9.94 | 0.075 |
| †14.23 | A | 31.7 | 43.4 | 47.1 | 34.0 | 529 | 14 17 46.21 | 52 33 22.2 | 1.97 | 0.14 |
| 14.23 | B | 21.4 | 17.5 | 20.1 | 20.1 | 14 17 46.68 | 52 33 29.6 | 6.60 | 0.24 | |
Note. — The best 8 m candidates are indicated with (see text). Flux density upper limits given are 5 point source sensitivities. Positions are measured in the IRAC 8.0 m mosaic and have roughly 03 uncertainties. Units of right ascension are hours, minutes, and seconds, and units of declination are degrees, arcminutes, and arcseconds.
| Candidate | Uaafootnotemark: | Baafootnotemark: | Vaafootnotemark: | Rbbfootnotemark: | Iaafootnotemark: | zccfootnotemark: | Kddfootnotemark: | Redshift |
|---|---|---|---|---|---|---|---|---|
| 14.1 | 27.170.32 | 26.600.12 | 26.280.11 | 26.60.1 | 24.710.05 | 24.790.34 | 21.180.05 | |
| 14.2A | 28.00.6 | 25.90.1 | 26.640.07 | 24.940.06 | 25.00.05 | 21.40.1 | ||
| 14.3 | 24.710.06 | 24.550.05 | 24.060.05 | 24.970.06 | 23.200.05 | 22.780.05 | 21.230.05 | |
| 14.4A | 22.710.05 | 22.600.05 | 22.700.05 | 21.740.02 | 22.370.05 | |||
| 14.7B | 24.530.06 | 23.640.05 | 23.410.05 | 23.50.05 | 23.490.05 | 22.50.2 | ||
| 14.8A | 25.930.13 | 25.480.05 | 24.960.05 | 25.00.1 | 24.580.05 | 24.240.20 | 21.50.1 | eefootnotemark: |
| 14.10A | 27.290.34 | 26.740.13 | 27.010.23 | 25.70.1 | 24.650.05 | 23.830.14 | 20.80.1 | |
| 14.12A | 27.600.37 | 26.40.2 | 25.540.09 | |||||
| 14.13 | 23.930.05 | 23.730.05 | 22.900.05 | 22.020.02 | 20.860.05 | 20.390.05 | 18.50.1 | 1.150 |
| 14.14B | 24.800.07 | 24.320.02 | 24.020.02 | 23.760.07 | 23.530.02 | 22.990.11 | 22.00.2 | |
| 14.15B | 25.130.06 | |||||||
| 14.17 | 23.840.05 | 23.110.05 | 22.290.05 | 21.690.02 | 21.130.05 | 21.000.05 | 19.70.1 | |
| 14.18 | 22.970.05 | 22.570.05 | 21.990.05 | 21.360.02 | 20.610.05 | 20.560.05 | 19.70.1 | 0.661 |
| 14.19 | 26.570.19 | 24.950.03 | 24.360.03 | 24.10.04 | 24.080.05 | 24.100.18 | 21.70.1 | |
| 14.20 | 27.7 | 25.630.65 | 25.830.88 | 21.60.1 | eefootnotemark: | |||
| 14.22B | 24.830.07 | 23.550.1 | 20.190.1 | |||||
| 14.23A | 26.750.15 | 26.570.16 | 27.70.6 | 25.090.07 | 25.530.67 | 20.90.2 |
Note. — All magnitudes are given on the AB system. Sources of the data: a CFDF (McCracken et al. 2001); b Miyazaki (2006, private communication); c Brodwin et al. (2006); d K-band survey of Webb et al. (2003); e Chapman et al. (2005) report a spectroscopic for galaxies near but distinct from these positions.
| Sample | N | K-[3.6] | [3.6]-[4.5] | [4.5]-[5.8] | [5.8]-[8.0] | [8.0]-[24] |
|---|---|---|---|---|---|---|
| 8 m Galaxies | 726 | |||||
| 8 m Counterparts | 17 | |||||
| Counterparts Subsample | 7 |