Radio Images of 3C 58: Expansion and Motion of its Wisp
Abstract
New 1.4 GHz VLA observations of the pulsar-powered supernova remnant 3C 58 have resulted in the highest-quality radio images of this object to date. The images show filamentary structure over the body of the nebula. The present observations were combined with earlier ones from 1984 and 1991 to investigate the variability of the radio emission on a variety of time-scales. No significant changes are seen over a 110 day interval. In particular, the upper limit on the apparent projected velocity of the wisp is 0.05 . The expansion rate of the radio nebula was determined between 1984 and 2004, and is % yr-1, corresponding to a velocity of km s-1 along the major axis. If 3C 58 is the remnant of SN 1181, it must have been strongly decelerated, which is unlikely given the absence of emission from the supernova shell. Alternatively, the low expansion speed and a number of other arguments suggest that 3C 58 may be several thousand years old and not be the remnant of SN 1181.
Subject headings:
ISM: individual (3C 58) — supernova remnants1. INTRODUCTION
The supernova remnant 3C 58 (catalog ) (G130.7+3.1 (catalog )) was classified as a pulsar wind nebula (PWN, also plerion; e.g., Weiler & Panagia, 1978) long before a pulsar was known. Its pulsar, PSR J0205+6449 (catalog ), was only recently detected, first in the X-ray (Murray et al., 2002) and then in the radio (Camilo et al., 2002). 3C 58 is at a distance, , of 3.2 kpc (Roberts et al., 1993)111Note that a distance slightly larger than this is possible, and that the pulsar dispersion measure is approximately twice what is expected at that distance (Camilo et al., 2002).. 3C 58 is a bright radio source, and previous radio imaging observations of the synchrotron nebula have shown it to have a center-brightened morphology, and a size of (Weiler & Seielstad, 1971; Wilson & Weiler, 1976; Green, 1986; Reynolds & Aller, 1988; Bietenholz et al., 2001b).
The pulsar in the center of the nebula is loosing rotational energy due to magnetic braking, at a rate which can be calculated from the pulsar’s spindown rate, and is erg s-1 (assuming a neutron star moment of inertia of g cm2; Murray et al., 2002; Ransom et al., 2004). This is the third highest spindown power of any Galactic pulsar, the highest being that of PSR B0531+21 (catalog ) in the Crab Nebula (catalog ). This energy flows from the pulsar as a wind consisting of relativistic particles and magnetic field, which then powers the visible synchrotron nebula. The details of this energy flow, however, are not yet well understood. In the Crab Nebula, which is the best studied pulsar wind nebula, rapid variability has been seen throughout the region near the pulsar at radio, optical, and X-ray wavelengths. In particular, a series of features called wisps propagate outward at projected speeds of order . The Crab nebula wisps are visible in the radio (Bietenholz et al., 2001a, 2004), in the optical (e.g., Hester et al., 1996; Tanvir et al., 1997), and in the X-ray (Mori et al., 2002).
These wisps are thought to be associated with the termination shock in the pulsar’s outflow, and indeed constitute almost the only observational window on that outflow before it enters the body of the nebula. Radio features apparently associated with the pulsar outflow are visible in pulsar nebulae other than the Crab, for example in Vela (catalog ) (Bietenholz et al., 1991a; Bock et al., 2002). In particular, Frail & Moffett (1993) showed that 3C 58 also has a radio feature with a wisp-like morphology. It would clearly be of interest to determine whether 3C 58’s wisp moves as rapidly as the wisps in the Crab, and to determine whether rapidly moving wisps are a general feature of young pulsar wind nebula, or a peculiarity of the Crab.
Another outstanding question concerning 3C 58 is its expansion rate, in particular that of the synchrotron bubble. 3C 58 has often been associated with the supernova of 1181 A.D. (SN 1181; Clark & Stephenson, 1977; Stephenson & Green, 1999), implying an age of yr for the nebula. Such a young age suggests that the nebula should be expanding rapidly. The measured expansion speeds, however, of both the synchrotron bubble (Bietenholz et al., 2001b) and of the thermal filaments (Fesen, 1983; Fesen et al., 1988; van den Bergh, 1990), seem to be considerably lower than expected for an age of yr.
Such slow current expansion speeds might be observed if 3C 58’s expansion has been greatly decelerated, but this is unlikely for the following reason. The synchrotron nebula is expected to be expanding into the supernova ejecta, which are themselves expanding. The synchrotron nebula is at fairly high pressure compared to that expected in the supernova ejecta, so in order for synchrotron bubble to have decelerated, the ejecta would also have to be decelerated. If the ejecta had been decelerated, however, one would expect bright radio emission from their interaction with the surrounding material. Such emission has not been observed despite numerous searches. (For more details on this argument, see Bietenholz et al., 2001b). In addition, such deceleration of the ejecta would likely produce considerably more thermal X-ray emission than is in fact seen (Slane et al., 2004). The low measured expansion velocities suggest that 3C 58 might be several thousand years old, and therefore not be the remnant of SN 1181. An accurate determination of the expansion speed of the synchrotron bubble is therefore important to reconstructing the history of 3C 58, and determining whether it is in fact associated with SN 1181.
I obtained new radio observations of 3C 58 using the NRAO222The National Radio Astronomy Observatory, NRAO, is operated under license by Associated Universities, Inc., under cooperative agreement with National Science Foundation. Very Large Array (VLA), with the goals of addressing both the question of possible rapid motions near the pulsar, and in order to obtain an accurate measurement of the present expansion speed of the synchrotron nebula. I describe the observations in § 2, discuss the results in § 3, and discuss my findings in § 4.
2. OBSERVATIONS AND DATA REDUCTION
I observed 3C 58 using the A, B, and C configurations of the VLA at 1.4 GHz. Details of the observing runs are given in Table 1. Two separate A-configuration runs, separated by 110 d, were obtained in order to check for rapid changes at the highest resolution. To avoid bandwidth smearing, the observations were carried out in spectral line mode, with a total bandwidth of 44 MHz comprising 7 spectral channels, each of width 6.25 MHz. The data were calibrated and imaged using NRAO’s AIPS software package. The flux density scale and instrumental bandpass were determined using observations of 3C 286.
I also re-edited the data of Reynolds & Aller (1988), taken in 1984 and also using the A, B, and C array configurations at 1.4 GHz, but without using the spectral line mode and having a bandwidth of 12.5 MHz. These data were then imaged and de-convolved in a similar manner as those from 2003/2004. Finally, I also re-reduced archival A-configuration 5 GHz VLA observations of 3C 58 taken on 1991 June 30, with a bandwidth of 50 MHz (original results published by Frail & Moffett, 1993).
Obtaining high-dynamic-range images of 3C 58 presents a challenge because the field around 3C 58 contains a number of background sources, including a nearby bright extra-galactic double. To obtain the best image of 3C 58, these background sources must be included in the deconvolution, otherwise their sidelobes will degrade the image of 3C 58. Although maximum entropy deconvolution is well suited for extended emission like 3C 58, the program available in AIPS (task VTESS) is not capable of treating the multiple fields necessary to also deconvolve the background sources. Furthermore, the deconvolution of compact objects like the background sources is better carried out using CLEAN rather than maximum entropy deconvolution. I therefore used a hybrid deconvolution scheme which made use of both maximum entropy and CLEAN, with the final images made as follows. First, a CLEAN deconvolution was performed on both the 3C 58 field and of six secondary fields to include the nearby background sources. Such multi-field CLEAN images were used to fully self-calibrate the data in both amplitude and phase. For the final images of 3C 58, I subtracted the CLEAN components for all the background sources, in other words all the clean components except those for 3C 58, from the fully self-calibrated - data. The resulting - data set was then imaged and deconvolved using VTESS. The VTESS (maximum entropy) deconvolution reduces the rippling at small spatial scales which was visible in the CLEAN images of 3C 58 and is a known instability of the CLEAN algorithm.
In order to determine whether there is any rapid variability in 3C 58’s radio emission, I made separate images from my 2003 July 7 and 2003 August 9 data. Time resolved radio observations of 3C 58 with the VLA, however, present the problem that it exhibits structure at spatial scales from 10′ down to 1″. Such a wide range of spatial scales is not well sampled by any single VLA array configuration. The A array configuration at 1.4 GHz, for example, samples only spatial scales between and 12. The usual approach of recovering the large scale structure by additional observations using more compact array configurations is precluded by the fact that VLA configuration changes occur only every four months.
I used a strategy for obtaining reliable, time-resolved images of an extended object similar to that developed by Bietenholz et al. (2001a). Since a speed of represents a proper motion of only 16 per month, any rapid evolution must occur on the smaller spatial scales, which are well sampled by the A array configuration. The large scale structure as sampled by the B and C array configurations (spatial scales of ), therefore, is unlikely to change on timescales of months. I therefore made separate images of each A array session by supplying the maximum entropy deconvolution with a default image. The default image was made by imaging all the 2003/2004 data, including that from both A, and the C and D array configurations, and subsequently smoothing the image by convolving with a Gaussian of FWHM 30″. The use of the same default for both A-configuration images will also serve to minimize any spurious differences between them since any differences of each from the common default will be only such as are demanded by the data.
3. RESULTS
3.1. Images
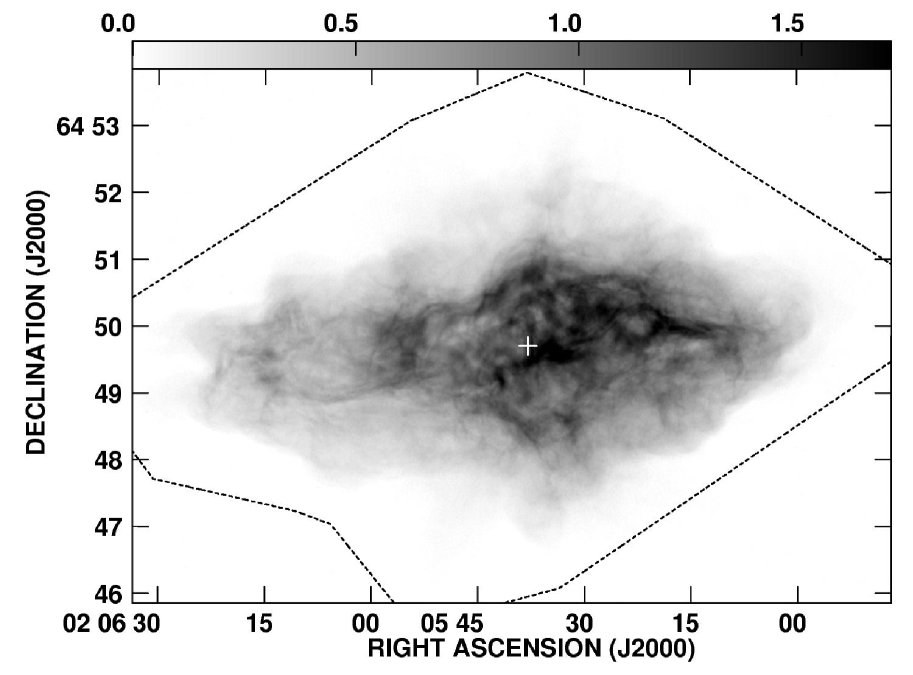
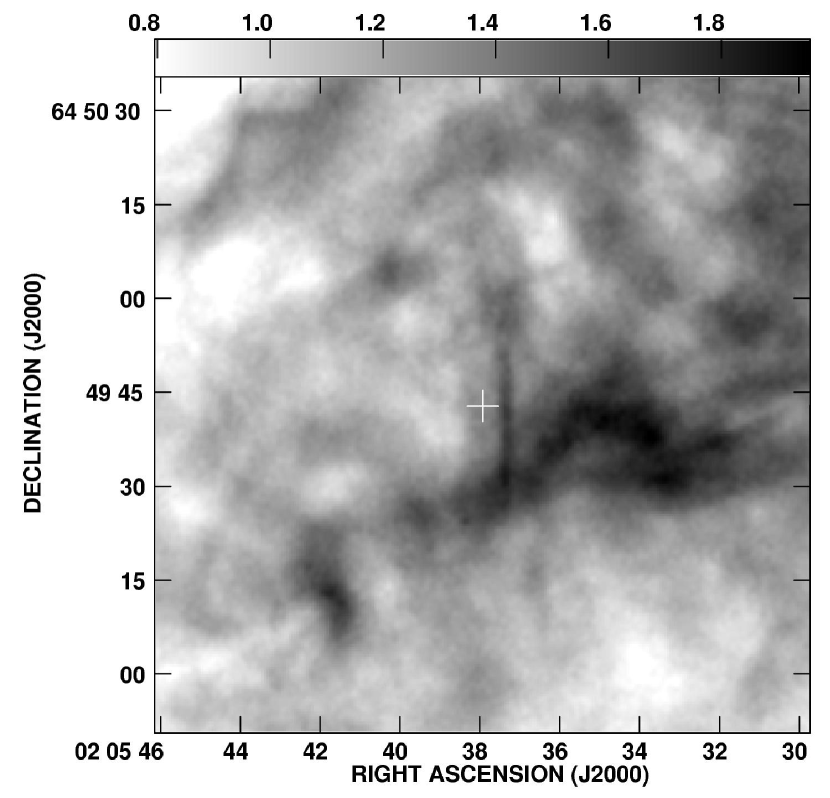
The full resolution image of 3C 58 is shown in Figure 1. This image was made by combining all the data in Table 1, including both A array configuration sessions. It therefore represents a time-average of the emission of the observing period of 2003 July to 2004 April. The position of the recently discovered pulsar, taken from Slane et al. (2002) and Camilo et al. (2002), is marked. The image was made using robust weighting, with the AIPS robustness parameter set to 0, and the Gaussian convolving beam had a FWHM of 136. In addition, Figure 2, shows a detail of the central region, including the “wisp” identified by Frail & Moffett (1993). I now turn to examining the variability of 3C 58’s radio emission on several timescales.
3.2. Expansion between 1984 and 2003
I examine first the longest timescales in order to determine the overall expansion rate. This can be most accurately determined from the pair of multi-configuration radio images from 1984 and 2003/2004333The image made from the 1991 data is not suitable for this purpose, firstly because it consists only of A-configuration data, hence does not reliably image structure larger than 1.4′, and secondly because it suffers from bandwidth smearing at distances from the phase-center (see e.g., Cotton, 1999; Bridle & Schwab, 1999). This smearing can cause small but systematic radial shifts of the position of brightness peaks due to the non-symmetrical VLA bandpass.. I use the same approach to determining the expansion as was used in Bietenholz et al. (2001b), and repeat a brief description here for the convenience of the reader. The goal is to determine the overall or average expansion speed of the radio nebula. Since there are few well-defined, compact features, the expansion is measured not by determining the proper motion of individual features, but by determining an overall scaling between a pair of images by least-squares. This was accomplished by using the MIRIAD task IMDIFF444The IMDIFF program was slightly modified so as to treat blanking correctly. which determines how to make one image most closely resemble another by calculating unbiased estimators for the scaling in size, , the scaling and the offset in flux density, and respectively, and the offsets in RA and decl., and respectively, needed to make the second image most closely resemble the first. My chief interest is in the expansion factor, , but because of uncertainties in flux calibration, absolute position, and image zero-point offsets caused by missing short spacings, all five parameters were determined. This method was originally developed by Tan & Gull (1985) and more details of its use in a similar situation are given by Bietenholz et al. (1991b). Before running IMDIFF, the 2003/2004 image was convolved to the resolution of the 1984 one, namely (FWHM) at p.a. °. The region exterior to 3C 38 was blanked so as to exclude it from the fitting. The fitting region encompassed 37.3 square arcminutes or 46,300 beam areas, and is indicated by a dotted line in Figure 1. The resulting expansion factor between the 1984 and the 2003/2004 images is 1.0027, with a formal uncertainty of .
Although the formal uncertainty in takes into account correlations of with the other parameters ( and ), it is still likely a significant underestimate because the true uncertainty will be dominated by systematic effects rather than by random noise. Systematic effects likely to influence my determination of are problems in recovering the largest scale structure in the deconvolution, bandwidth smearing, and the primary beam correction. I discuss each in turn.
There are often problems in recovering the largest scale structure from interferometric observations such as these, and such problems might bias my determination of . To eliminate this possibility, I high-pass filtered my images using a Gaussian of FHWM 30″, and obtained a marginally smaller expansion factor of 1.0022. To check whether biases are introduced by possible edge-effects, I determined using only pixels above a certain cutoff in brightness. I determined using the pixels with brightness % and % of the peak, resulting in fitting areas of 90% and 52% of the above value, and values of of 1.0021 and 1.0025 respectively. Similarly, tests show that the value of is not sensitive to whether CLEAN or VTESS deconvolution is used. I conclude that my determination of is not sensitive to deconvolution errors at a level greater than 0.0006.
I note that the total flux density of 3C 58 was found to be increasing with time at a rate of about 0.28% yr-1 (Green, 1987; Aller & Reynolds, 1985)., which would imply an increase of % in the total flux density between 1984 and 2003/2004. I find that the 5 GHz flux density of 3C 58 decreased by % between 1984 and 2003/2004 which is consistent with the earlier measured secular increase but does not confirm it.
The data of 1984 had a bandwidth of 12.5 MHz, and as a result will be subject to a small amount of bandwidth smearing at distances ″ from the image center. Bandwidth smearing will smear the image radially. Such radial smearing might possibly bias the derived value of , although to first order it preserves surface brightness (see, e.g., Cotton, 1999). As a test, I averaged the 2003/2004 data over 25 MHz in frequency (from the original channel width of 6.25 MHz). Using IMDIFF to compare this artificially bandwidth-smeared image to the unsmeared original, I find the value of to differ from unity by . As the amount of bandwidth smearing in this test was twice that in the 1984 data set, I conclude that any effect of bandwidth smearing of the 1984 data set is small (and would cause my estimate of the expansion rate to be slightly but not significantly over-estimated).
Finally, different primary beam corrections might cause an error in the determination of . I obtained my IMDIFF results from images uncorrected for the primary beam pattern of the VLA, which has the desirable result of making the noise in the image spatially uniform. If the two images were taken at a different observing frequency, the primary beam correction would differ, and a bias might be introduced. Since, however, the primary beam correction is not large, (being only % near the eastern and western edges of the nebula), and since the 1984 and 2003/2004 images are at almost the same frequency (the center frequencies differ by only 21 MHz), the difference in the primary beam correction between the 1984 and 2003/2004 images is negligible. As a test, IMDIFF was run between images made separately from the two intermediate frequencies in the 2003/2004 data set, which differ in frequency by a larger amount of 80 MHz. The resulting change in was only 0.0005.
As mentioned above, the uncertainty in is likely dominated by difficult-to-determine systematic effects. The tests performed above, however, in no case resulted in a change in the derived value of , and I will adopt this value as a conservative uncertainty in .
The value of implies 3C 58’s rate of expansion over the period 1984 to 2004 is % yr-1. This value is consistent with, but more accurate than, the one of % yr-1 obtained by Bietenholz et al. (2001b) from a variety of earlier, lower-resolution radio images. I note here that this expansion rate is much smaller than the rate of 0.124% yr-1 which would be expected for undecelerated expansion of 3C 58 since 1181 A.D.
3.3. Changes between 1991 and 2003/2004
Are there any changes in 3C 58’s morphology apart from the relatively slow expansion? The Crab Nebula shows complex brightness changes, distinct from the general expansion, which occur over a timescale of a few years (Bietenholz et al., 2004, 2001a; Bietenholz & Kronberg, 1992). Is there similar variability in 3C 58? The best pair images for addressing this question are those from 1991 and 2004, since they have the highest resolution and good signal-to-noise. In 1991, only A configuration observations are available, so only structure in size can be imaged. This is not a serious limitation because any changes will likely relatively localized. A more serious limitation is that the bandwidth of 43 MHz used in 1991 results in a considerable amount of bandwidth smearing — features far from the phase center will suffer radial smearing 45″ of the phase center (see § 3.2 above), which will limit the search for motions or changes to the region near the pulsar. The resolution of 136 and the time interval of 12.4 yr means I am sensitive to motions with projected speeds of km s-1.
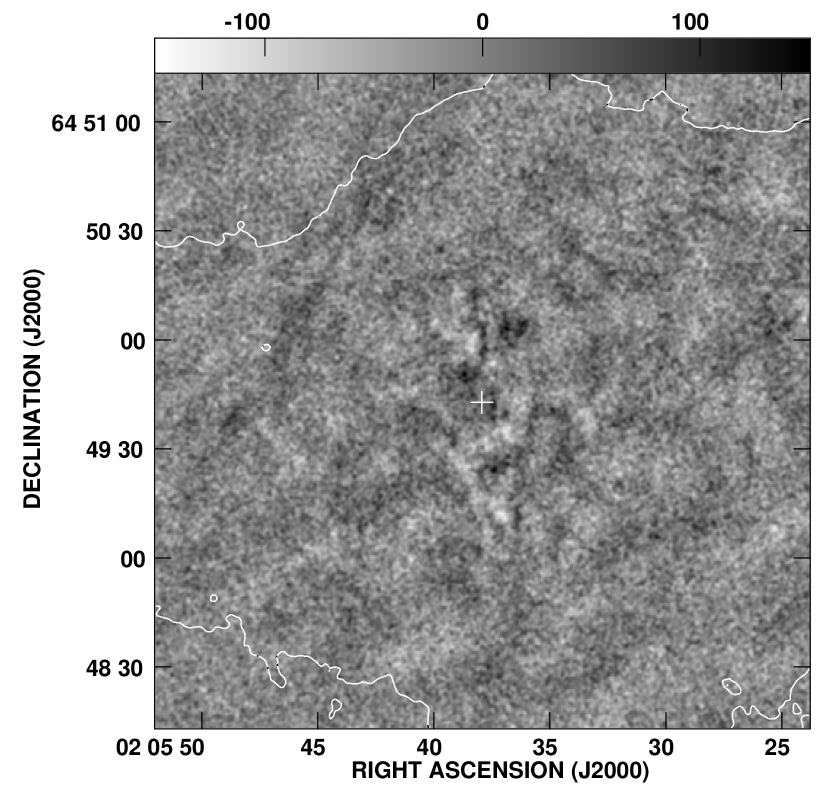
I formed a difference image by subtracting the 2003/2004 image from that of 1991. To account for any possible small shifts in nominal position or differences in the amplitude scale etc., IMDIFF was first run to determine the best-fit flux density scaling and offset and RA and decl. offsets ( and ) between 1991 and 2003/2004 images using only the portions within of the pulsar. The scaling in size () cannot be reliably determined from such a small region, so it was fixed at , arrived at by assuming the expansion rate of % yr-1 derived in § 3.2 above. After applying the relevant shifts and scalings, I formed the difference image. Because of both the IMDIFF scaling and the use of the same default image, this difference image should represent the smallest set of differences allowed by the data.
This difference image is shown in Figure 3. There is a tantalizing hint of structure in the region near the pulsar. The extrema within 20″ of the pulsar are +150 and Jy bm-1, or +8% and % of the peak brightness. These extrema represent , slightly larger than the extremes expected from a purely random variation over the whole image (which comprises beam areas). However, the distribution of image-plane noise is probably not strictly Gaussian, and the statistical significance of the extreme values in the difference image is therefore likely somewhat different than calculated from Gaussian statistics. For this reason, the evidence for brightness variations near the center of 3C 58 should be regarded as somewhat tentative.
3.4. Variability over 110 Days
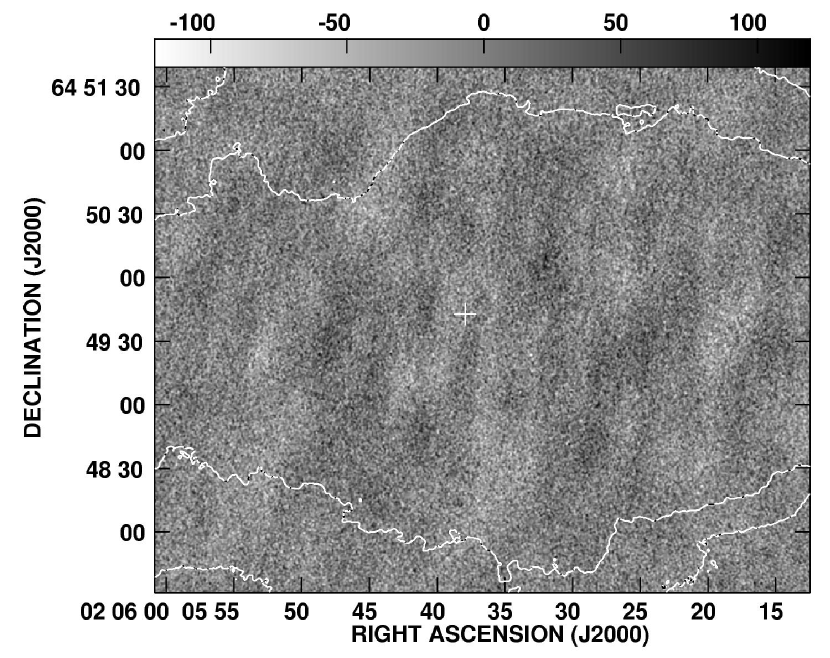
Finally, I turn to determining whether there is any variability on the short time-scales of less than 1 year. For this purpose, I examine the differences between the two images made using each of the 2003 A configuration observations separately. In Figure 4, I show a difference image formed by subtracting image from July 7 from that of August 9. No structure above the noise is visible in the difference image. Any changes in the radio morphology of 3C 58 over this period, therefore, were no larger than the noise. The rms brightness of the difference image over 3C 58 is 26 Jy bm-1, which is consistent with that expected from the background rms of the individual images. The rms brightness over the region within of the pulsar is not significantly larger. A limit of Jy bm-1, or % of the peak brightness can be set any changes over the period of 110 d555As noted earlier, the computation of the exact statistical significance based on Gaussian statistics is likely to be in error. The given limits on the brightness variation over 110 d represent times the rms in the difference image. Tests performed by adding random noise to the difference images of the Crab from Bietenholz et al. (2004) show that the real brightness variations in the Crab are clearly distinguishable from the noise at this level..
In particular, the feature identified as a “wisp” by Frail & Moffett (1993) does not show any motion over this 110 d interval. I show profiles drawn in the R.A. direction through the wisp in Figure 5. To decrease the uncertainty, the profiles were averaged over 24 in declination. Any changes between the two epochs are smaller than the profile uncertainty of Jy bm-1. In particular, the wisp moves between these two epochs, implying a projected speed of or km s-1 ( kpc).
4. DISCUSSION
I produced new radio images of the supernova remnant 3C 58. These new images are the highest quality radio images of 3C 58 so far, By comparing images made at intervals of 20 yr, 12 yr and 110 d, I was able to measure the expansion rate of the synchrotron nebula, and to establish upper limits on any variations or motions within the nebula.
The new high-resolution images show a general radio structure of 3C 58 very similar to that seen in earlier images at lower resolution and signal-to-noise (e.g., Reynolds & Aller, 1988). Filamentary structure can be seen throughout the body of 3C 58, and the general texture is very similar to both that seen in the X-ray images of 3C 58 (Slane et al., 2004) and in radio images of the Crab Nebula (e.g., Bietenholz et al., 2004). Several elongated loop-like structures are visible, particularly to the East. The narrowest filaments are likely to be unresolved at my 136 resolution, but are relatively faint. The brighter filaments seem to have widths of a few arc-seconds. The most prominent filament is one near the pulsar, oriented North-South, which was identified earlier as a wisp (Frail & Moffett, 1993). I will discuss it separately in § 4.4 below.
4.1. The Expansion Rate and Age of 3C 58
By comparing my observations to ones taken in 1984, I measured the current expansion rate of the radio nebula to be % yr-1, corresponding to speeds kpc) km s-1 along the major axis of the nebula and approximately half that along the minor axis666These speeds are calculated assuming symmetrical expansion about the center of the nebula. The observations constrain the expansion center to lie within about 1.5′ from the pulsar position. The degree of one-sided expansion is not well determined.. This measurement of the expansion rate is consistent with, but considerably more accurate than the earlier one of Bietenholz et al. (2001b). As already pointed out in that reference, the low expansion speed of the radio nebula is corroborated by the slow proper motions of optical filaments (Fesen et al., 1988; van den Bergh, 1990), and by the low radial velocities implied by the low optical line-widths (900 km s-1, Fesen, 1983).
All these measures of expansion speed of 3C 58 are much smaller than that expected if it were the undecelerated remnant of SN 1181, in which case the expansion rate would be 0.124% yr-1 or km s-1 along the major axis. Conversely, my measured expansion rate suggests an age for 3C 58 of yrs with a lower limit of 4300 yrs, which is incompatible with the usual association with SN 1181.
If 3C 58 is in fact the remnant of SN 1181, then, it must have been strongly decelerated. As argued in Bietenholz et al. (2001b), to decelerate the synchrotron nebula, whose pressure is likely higher than that in the surrounding supernova ejecta, requires the ejecta to have been even more strongly decelerated. If the ejecta indeed had been strongly decelerated, shell emission would be expected from their interaction with the interstellar medium. No shell emission, however, is seen in 3C 58 in the radio despite several searches (Bietenholz et al., 2001b; Reynolds & Aller, 1985).
The simplest way out of this dilemma is to suggest that 3C 58 is not in fact the remnant of SN 1181, but rather is the remnant of a considerably older supernova. Several other lines of evidence suggest that 3C 58 might be rather older than 820 yr (many of these points have already been discussed in Chevalier, 2004, 2005).
1. The internal energy of the pulsar nebula, estimated by the synchrotron minimum energy, is larger than the current spindown luminosity multiplied by 820 yr (Chevalier, 2004, 2005). In order to have supplied the required nebular energy, the pulsar must already have spun down significantly, which is unlikely for a pulsar only 820 yr old with a spindown age of 5380 yr.
2. An age of 820 yr implies rapid expansion of the PWN since the supernova, which requires an implausibly low density in the surrounding supernova ejecta (Chevalier, 2004, 2005). The expansion of the PWN into the supernova ejecta is driven by the spindown energy of the pulsar, which in the case of 3C 58 is 20 times lower than that of the Crab nebula. Assuming similar supernova ejecta in both remnants, one would expect 3C 58 to expand considerably more slowly than the Crab nebula, yet if 3C 58 is only yr old, then its average expansion speed is roughly double that in the Crab nebula.
5. The very sharp and rather low frequency spectral break observed in 3C 58 (Woltjer et al., 1997; Green & Scheuer, 1992) suggests an age older than years.
I note also that the X-ray observations show that the neutron star is much cooler than expected for a normal cooling curve and an age of yr, although various “non-standard” cooling mechanisms or a high-mass neutron star could likely explain this discrepancy (e.g., Page et al., 2004; Yakovlev & Pethick, 2004).
4.2. Alternative Remnants of SN 1181
If 3C 58 is not the remnant of SN 1181, an obvious question arises: where is the remnant of SN 1181? At only 820 years old, it might be expected to be fairly bright and have an angular size of ′. Why has it not been discovered? The Chinese, Korean and Japanese records place SN 1181 within 1° of the Galactic-coordinates (Stephenson, 1971; Clark & Stephenson, 1977; Stephenson & Green, 1999). All the other historical supernovae were at distances kpc, and since SN 1181 was not unusually faint, it was likely within 5 kpc.
The most sensitive radio surveys covering the region are the Canadian Galactic Plane Survey (CGPS; Taylor et al., 2003) and the NRAO VLA Sky Survey (NVSS; Condon et al., 1998). No obvious candidate with a size ′ is visible on either survey, with the limits in surface brightness at 1 GHz, , being and W m-2 Hz-1 sr-1, respectively777To facilitate inter-comparison, I cite surface brightnesses at 1 GHz, and convert measurements at different frequencies using an assumed spectral index of . For example, both the CGPS and the NVSS surveys were at 1.4 GHz. Note also that some artifacts due to the presence of 3C 58 are visible in both the CGPS and NVSS surveys, hence the present surface brightness limits are somewhat higher than the nominal values for those two surveys.. In addition, the sensitive targeted searches for 3C 58’s shell emission would be expected to have shown any emission from other remnants nearby: Reynolds & Aller (1985) and Bietenholz et al. (2001b) placed limits on of W m-2 Hz-1 sr-1. In particular, the 327 MHz observations of Bietenholz et al. (2001b) had a field of view of 1.2° and thus would be expected to have detected the remnant of SN 1181 if it were sufficiently bright.
If 3C 58 is not the remnant of SN 1181, we can therefore say that the latter’s remnant must have a radio surface brightness W m-2 Hz-1 sr-1. This surface brightness is an order of magnitude fainter than the faintest known shell remnants. Is it reasonable to suppose that the remnant of SN 1181 might be so faint?
There are two reasons to think that such a faint remnant is not improbable. Firstly, estimates of the Galactic supernova rate suggest that there were 12 to 24 Galactic supernovae in the last 1000 yr (Reed, 2005; Cappellaro, 2003; Strolger, 2003). One would therefore expect to observe the same number of supernova remnants with ages yr, which in the radio are likely to be visible anywhere in the Galaxy. Currently, despite several searches, only about 10 known remnants have ages or estimated ages yr (e.g., Green, 2004; Misanovic et al., 2002; Sramek et al., 1992; Green, 1985). The implication is that there are likely to 14 as yet undetected young remnants. It is therefore plausible that the remnant of SN 1181 is one of these as yet undetected remnants.
The second reason is to think that we may not yet have discovered the remnant of SN 1181 involves a supernova of almost the same age: SN 1054, which is one of only six known historical supernovae. The only presently known radio emission associated with SN 1054 is the Crab nebula and pulsar. The nebular radio emission can be traced entirely to the Crab pulsar, which has a very high spindown luminosity. No radio emission from the supernova shell has yet been detected: the most sensitive search to date being by Frail et al. (1995), which found no radio emission from the supernova shell with a upper limit on of W m-2 Hz-1 sr-1. This upper limit is fainter than the detection limits of the CGPS and NVSS surveys mentioned earlier. Therefore, if it were not for its energetic pulsar, the radio remnant of SN 1054 might not yet have been discovered. It is then not unreasonable to suppose that SN 1181 produced a similarly faint shell, but did not produce an energetic pulsar.
A possible, but unlikely, scenario would be that 3C 58 is the composite remnant of a binary where both stars have undergone supernova explosions, with the earlier supernova leaving the slowly expanding remnant, and the later, low energy one providing the historical supernova event in 1181 A.D. This scenario seems rather contrived, since having two supernovae within a few thousand years of one another is quite unlikely
4.3. Rapid Variability near the Pulsar
No conclusive evidence is seen for rapid variations, either motions or changes in the radio brightness, near the pulsar. The upper limits on rapid variability are % of the peak brightness over a period of 110 d. In contrast, in the case of the Crab Nebula, a distinct pattern of elliptical ripples is seen in radio difference images over similar time intervals. However the relative amplitudes of the difference ripples in the Crab is of only 6% (Bietenholz et al., 2004, 2001a), slightly lower than the upper limit on the variations occurring in 3C 58.
4.4. The Wisp
As mentioned, the feature that Frail & Moffett (1993) identified as a “wisp” is clearly seen (see Figs. 1 and 2), but does not appear to move over 110 d (projected ). Frail & Moffett (1993) interpreted the wisp as being associated with the pulsar wind termination shock. Since 3C 58’s wisp, unlike those in the Crab nebula, does not appear to move rapidly, the question arises of whether it is in fact associated with the pulsar wind termination shock.
The wisp’s morphology does not argue strongly for an association with the wind termination shock, as filaments just as narrow and in a variety of orientations are seen in the remainder of the nebula. Unlike the wisps in the Crab, 3C 58’s wisp is relatively straight and does not unambiguously suggest a circular feature seen in projection.
The spindown luminosity of the pulsar is now known to be erg s-1 (Murray et al., 2002; Ransom et al., 2004), therefore the approximate location of the termination shock can be calculated by balancing the ram pressure of the pulsar wind against the nebular pressure. Standard synchrotron arguments give a minimum pressure in the nebula of dyne cm-2, so the termination shock radius should be at a distance of cm, corresponding to 8″ for kpc, with the distance being lower if equipartition does not obtain and the pressure is higher than the synchtrotron minimum pressure.
The wisp is at an angular distance of only 35 from the pulsar, somewhat closer than the expected termination shock, although, as mentioned above, this might be due to departures from equipartition. Moreover, if the wisp is in fact a circular feature, then its inclination angle is and its radius corresponds to ″, compatible with an association with a termination shock. I note that, in this case, the space velocity of the wisp would be considerably higher than the measured projected velocity, perhaps even as high as the velocities seen in the Crab wisps.
High-resolution X-ray images of 3C 58 in fact suggest a highly inclined torus with a jet (Slane et al., 2004). The radio wisp is roughly coincident with the western edge of the X-ray torus (as has already been pointed out by Slane, 2005), although it is possibly slightly larger.
The location, orientation and relative prominence of the radio wisp and its similarity to the X-ray “torus”, therefore, argue strongly that 3C 58’s radio wisp is indeed associated with the wind termination shock despite its lack of apparent motion.
5. CONCLUSIONS
New VLA radio observations of 3C 58, and reanalysis of older observations from 1984 and 1991 indicate that:
1. A filamentary structure is present throughout the body of the nebula.
2. The radio nebula expands at a rate of % yr-1. This is much slower than expected if 3C 58 is the undecelerated remnant of supernova 1181 A.D, but suggests instead an age of several thousand years.
3. The fractional variability in brightness (other than that due to expansion) is % both over a period of 110 d and over the period 1991 to 2003/2004. There is inconclusive evidence for brightness variations of a few percent in the central portion of the nebula over the latter period of approximately a decade.
4. A linear feature, called “wisp” very near the pulsar, is likely related to the pulsar outflow.
5. The wisp does not appear to move over a period of 110 days, its projected speed being . This stands in contrast to the Crab nebula, where rapid motion of the wisps with speeds of are seen.
References
- Aller & Reynolds (1985) Aller, H. D., & Reynolds, S. P. 1985, in The Crab Nebula and Related Supernova Remnants, 75–78
- Bietenholz et al. (1991a) Bietenholz, M. F., Frail, D. A., & Hankins, T. H. 1991a, ApJ, 376, L41
- Bietenholz et al. (2001a) Bietenholz, M. F., Frail, D. A., & Hester, J. J. 2001a, ApJ, 560, 254
- Bietenholz et al. (2004) Bietenholz, M. F., Hester, J. J., Frail, D. A., & Bartel, N. 2004, ApJ, 615, 794
- Bietenholz et al. (2001b) Bietenholz, M. F., Kassim, N. E., & Weiler, K. W. 2001b, ApJ, 560, 772
- Bietenholz & Kronberg (1992) Bietenholz, M. F., & Kronberg, P. P. 1992, ApJ, 393, 206
- Bietenholz et al. (1991b) Bietenholz, M. F., Kronberg, P. P., Hogg, D. E., & Wilson, A. S. 1991b, ApJ, 373, L59
- Bocchino et al. (2001) Bocchino, F., Warwick, R. S., Marty, P., Lumb, D., Becker, W., & Pigot, C. 2001, A&A, 369, 1078
- Bock et al. (2002) Bock, D. C.-J., Sault, R. J., Milne, D. K., & Green, A. J. 2002, in ASP Conf. Ser. 271: Neutron Stars in Supernova Remnants, 187–+
- Bridle & Schwab (1999) Bridle, A. H., & Schwab, F. R. 1999, in ASP Conf. Ser. 180: Synthesis Imaging in Radio Astronomy II, 371–+
- Camilo et al. (2002) Camilo, F., Stairs, I. H., Lorimer, D. R., Backer, D. C., Ransom, S. M., Klein, B., Wielebinski, R., Kramer, M., McLaughlin, M. A., Arzoumanian, Z., & Müller, P. 2002, ApJ, 571, L41
- Cappellaro (2003) Cappellaro, E. 2003, LNP Vol. 598: Supernovae and Gamma-Ray Bursters, 598, 37
- Chevalier (2004) Chevalier, R. A. 2004, Advances in Space Research, 33, 456
- Chevalier (2005) —. 2005, ApJ, 619, 839
- Clark & Stephenson (1977) Clark, D. H., & Stephenson, F. R. 1977, The historical supernovae (Oxford [Eng.] ; New York : Pergamon Press, 1977. 1st ed.)
- Condon et al. (1998) Condon, J. J., Cotton, W. D., Greisen, E. W., Yin, Q. F., Perley, R. A., Taylor, G. B., & Broderick, J. J. 1998, AJ, 115, 1693
- Cotton (1999) Cotton, W. D. 1999, in ASP Conf. Ser. 180: Synthesis Imaging in Radio Astronomy II, 357–+
- Fesen (1983) Fesen, R. A. 1983, ApJ, 270, L53
- Fesen et al. (1988) Fesen, R. A., Kirshner, R. P., & Becker, R. H. 1988, in IAU Colloq. 101: Supernova Remnants and the Interstellar Medium, 55–+
- Frail et al. (1995) Frail, D. A., Kassim, N. E., Cornwell, T. J., & Goss, W. M. 1995, ApJ, 454, L129+
- Frail & Moffett (1993) Frail, D. A., & Moffett, D. A. 1993, ApJ, 408, 637
- Green (1985) Green, D. A. 1985, MNRAS, 216, 691
- Green (1986) —. 1986, MNRAS, 218, 533
- Green (1987) —. 1987, MNRAS, 225, 11P
- Green (2004) —. 2004, Bulletin of the Astronomical Society of India, 32, 335
- Green & Scheuer (1992) Green, D. A., & Scheuer, P. A. G. 1992, MNRAS, 258, 833
- Hester et al. (1996) Hester, J. J., Stone, J. M., Scowen, P. A., Jun, B., Gallagher, J. S., Norman, M. L., Ballester, G. E., Burrows, C. J., Casertano, S., Clarke, J. T., Crisp, D., Griffiths, R. E., Hoessel, J. G., Holtzman, J. A., Krist, J., Mould, J. R., Sankrit, R., Stapelfeldt, K. R., Trauger, J. T., Watson, A., & Westphal, J. A. 1996, ApJ, 456, 225
- Kaspi et al. (2001) Kaspi, V. M., Roberts, M. E., Vasisht, G., Gotthelf, E. V., Pivovaroff, M., & Kawai, N. 2001, ApJ, 560, 371
- Misanovic et al. (2002) Misanovic, Z., Cram, L., & Green, A. 2002, MNRAS, 335, 114
- Mori et al. (2002) Mori, K., Hester, J. J., Burrows, D. N., Pavlov, G. G., & Tsunemi, H. 2002, in ASP Conf. Ser. 271: Neutron Stars in Supernova Remnants, 157–+
- Murray et al. (2002) Murray, S. S., Slane, P. O., Seward, F. D., Ransom, S. M., & Gaensler, B. M. 2002, ApJ, 568, 226
- Page et al. (2004) Page, D., Lattimer, J. M., Prakash, M., & Steiner, A. W. 2004, ApJS, 155, 623
- Ransom et al. (2004) Ransom, S., Camilo, F., Kaspi, V., Slane, P., Gaensler, B., Gotthelf, E., & Murray, S. 2004, in AIP Conf. Proc. 714: X-ray Timing 2003: Rossi and Beyond, 350–356
- Reed (2005) Reed, B. C. 2005, AJ, 130, 1652
- Reynolds & Aller (1985) Reynolds, S. P., & Aller, H. D. 1985, AJ, 90, 2312
- Reynolds & Aller (1988) —. 1988, ApJ, 327, 845
- Roberts et al. (1993) Roberts, D. A., Goss, W. M., Kalberla, P. M. W., Herbstmeier, U., & Schwarz, U. J. 1993, A&A, 274, 427
- Slane (2005) Slane, P. 2005, Advances in Space Research, 35, 1092
- Slane et al. (2004) Slane, P., Helfand, D. J., van der Swaluw, E., & Murray, S. S. 2004, ApJ, 616, 403
- Slane et al. (2002) Slane, P. O., Helfand, D. J., & Murray, S. S. 2002, ApJ, 571, L45
- Sramek et al. (1992) Sramek, R. A., Cowan, J. J., Roberts, D. A., Goss, W. M., & Ekers, R. D. 1992, AJ, 104, 704
- Stephenson (1971) Stephenson, F. R. 1971, QJRAS, 12, 10
- Stephenson & Green (1999) Stephenson, F. R., & Green, D. A. 1999, Astronomy and Geophysics, 40, 27
- Strolger (2003) Strolger, L.-G. 2003, Ph.D. Thesis
- Tan & Gull (1985) Tan, S. M., & Gull, S. F. 1985, MNRAS, 216, 949
- Tanvir et al. (1997) Tanvir, N. R., Thomson, R. C., & Tsikarishvili, E. G. 1997, New Astronomy, 1, 311
- Taylor et al. (2003) Taylor, A. R., Gibson, S. J., Peracaula, M., Martin, P. G., Landecker, T. L., Brunt, C. M., Dewdney, P. E., Dougherty, S. M., Gray, A. D., Higgs, L. A., Kerton, C. R., Knee, L. B. G., Kothes, R., Purton, C. R., Uyaniker, B., Wallace, B. J., Willis, A. G., & Durand, D. 2003, AJ, 125, 3145
- van den Bergh (1990) van den Bergh, S. 1990, ApJ, 357, 138
- Weiler & Panagia (1978) Weiler, K. W., & Panagia, N. 1978, A&A, 70, 419
- Weiler & Seielstad (1971) Weiler, K. W., & Seielstad, G. A. 1971, ApJ, 163, 455
- Wilson & Weiler (1976) Wilson, A. S., & Weiler, K. W. 1976, A&A, 49, 357
- Woltjer et al. (1997) Woltjer, L., Salvati, M., Pacini, F., & Bandiera, R. 1997, A&A, 325, 295
- Yakovlev & Pethick (2004) Yakovlev, D. G., & Pethick, C. J. 2004, ARA&A, 42, 169
| Date | Array Configuration | Observing TimebbThe total observing time, including calibrator observations |
|---|---|---|
| (hrs) | ||
| 2003 Jul 7 | A | 12 |
| 2003 Aug 9 | A | 12 |
| 2003 Dec 30 | B | 4.5 |
| 2004 Apr 19 | C | 3.5 |