Simulating Diffuse Light in Galaxy Clusters
Abstract
Using -body simulations, we have modeled the production and evolution of low surface brightness, diffuse intra-cluster light (ICL) in galaxy clusters. By creating simulated observations of the clusters we have measured the evolution of the ICL luminosity throughout the dynamical history of the clusters. We find that ICL production tends to occur in short, discrete events, which correlate very strongly with strong, small-scale interactions and accretions between groups within the clusters.
1 Simulated Deep Imaging of Galaxy Clusters
Diffuse, intra-cluster starlight (ICL) has been observed in numerous galaxy clusters in the local universe (see rud:mihos for more on ICL observations). As the product of tidal interactions between cluster galaxies, this very low surface brightness material has the potential to reveal a great deal about the nature of dynamical interactions within the cluster. In order to better understand the processes which create the observed ICL, we have created -body simulations of the evolution of luminous galaxies in clusters, in the context of a universe (see rud:rudick2006 for more information on our simulation techniques). We have modeled three such clusters, each approximately (referred to as clusters C1, C2, and C3 respectively, henceforth).
In order to examine the evolution of the ICL in our clusters, we have created simulated deep photometric images of the clusters evolving from to . First, we smoothed the distribution of discrete particles into a continuous mass distribution. This was done by first projecting the three-dimensional particle positions onto a two-dimensional plane, then smoothing the particles using an adaptive two-dimensional Gaussian smoothing kernel.
We obtained luminosity distributions of the clusters by applying a mass-to-light ratio () to the smoothed mass distribution. Our -body simulations, however, have not modeled gas physics, and therefore star formation and stellar evolution, in any way. We have therefore chosen to adopt a global of in the -band, a value characteristic of older stellar populations in the local universe, such as we expect to dominate in the dense cluster environments we have simulated. This has been applied to all images at all evolutionary times. While it is certainly unphysical to expect to see similar stellar populations at and , this method has several advantages which aid in the interpreting dynamical changes within the cluster. Most importantly, the global means that all changes seen in the luminosity distribution as the cluster evolves are the direct result of gravitational dynamics alone. Secondly, we are not attempting to simulate cosmological observations of the clusters at distant redshifts, but rather observing the clusters in their given dynamical state as they would appear in the local universe.
2 Evolution of the ICL
2.1 Defining ICL
Most previous theoretical work has defined ICL as stellar particles which are bound to the cluster potential, but unbound to any individual galaxy in the cluster (e.g. rud:willman2004 ,rud:sommerlarsen2005 ). In general, however, the specific binding energy of individual stars is not a readily observable feature of the ICL. We have therefore adopted a more observationally tractable quantity as our definition of ICL: luminosity which is at surface brightness fainter than 26.5 mag/sq.arcsec. We chose mag/sq.arcsec specifically as our surface brightness cutoff because in both our simulated images and in direct observations (rud:feldmeier2002 , rud:mihos2005 ) this appeared to be approximately the surface brightness limit where the isophotal contours no longer simply outlined those of higher galaxian surface brightness, but seemed to take on a distinct morphology.
2.2 Changes in ICL Luminosity
Using our observational definition of ICL, we have calculated the fraction of each cluster’s luminosity which is at ICL surface brightness () as a function of time 111The units of time used are such that is the current age of the universe., as shown on the top row of Fig. 1. The most immediately obvious feature of this analysis is that, in general, the fraction of ICL luminosity increases as a function of time in each of the clusters. However, it is apparent that this increasing ICL fraction is far from smooth or monotonic, including several examples of large increases in on short timescales, as well as significant, extended decreases.

In order to better understand the changing ICL luminosity fraction, we have calculated the fractional change in per unit time (), plotted as a function of time on the bottom row of Fig. 1. This plot shows even more clearly that increases in the ICL luminosity fraction tend to come in short, discrete events, often preceded by significant decreases.
By following the evolution of our clusters using the simulated images, shown in Fig. 2, we see that large increases in the ICL luminosity fraction are highly correlated with small scale interactions and accretion events between groups within the clusters. Additionally, decreases are the result of temporary increases in the projected density of luminous material which are a part of the accretion process. The following sections show a representative example of this behavior from each cluster.
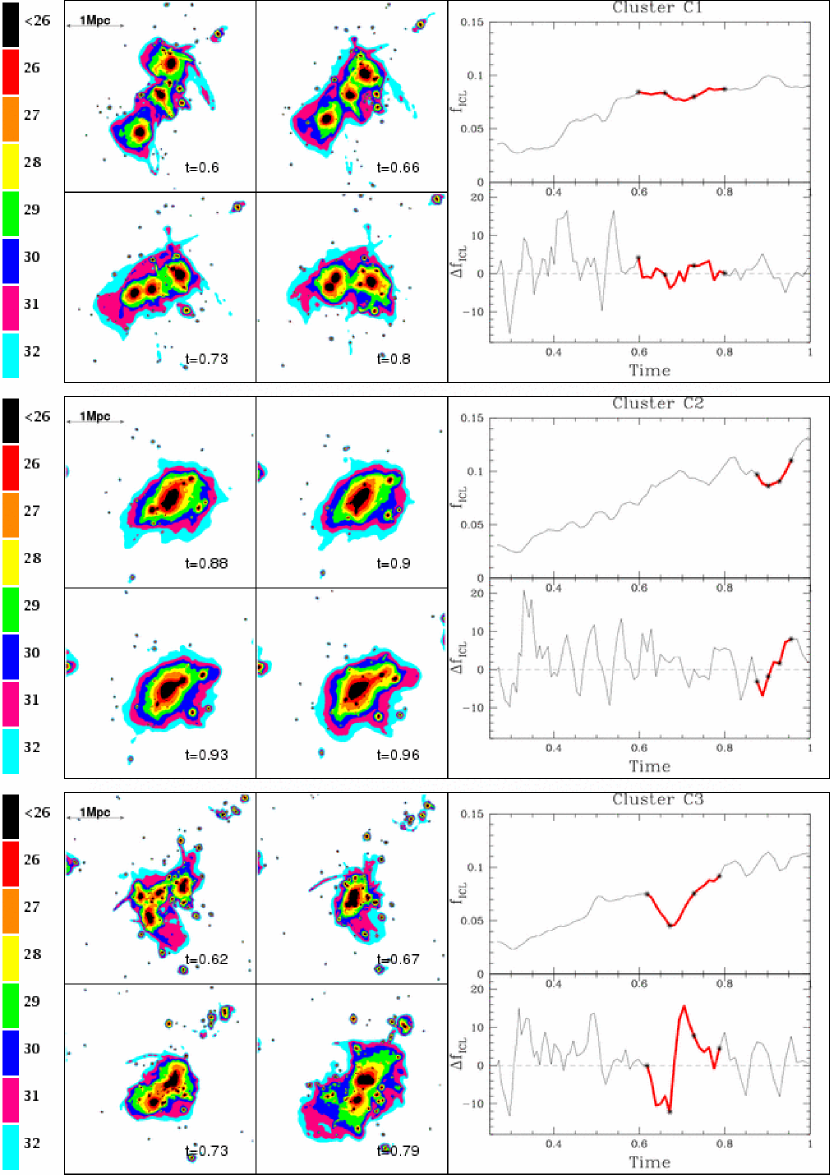
Cluster C1
The top row of Fig. 2 shows simulated images of a short segment of the evolution of cluster C1, along with the and functions during this time period. At , the cluster consists of three distinct galaxy groups. However, at these same three groups still exist within the cluster, relatively unaltered. The groups simply orbit one another, resulting in little accretion or strong inter-group interactions. During this period, the fraction of the cluster’s luminosity at ICL surface brightness remains roughly constant.
Cluster C2
The middle of Fig. 2 shows a segment of the evolution of cluster C2. Here, we see a significant increase in the ICL luminosity fraction over a very short time period. The small group which is below and to the left of the cluster core at plunges through the central mass concentration, emerging to the upper right. As the group enters the core, the projected luminous density increases temporarily, thus creating the drop in ICL luminosity. However, as the group exits the cluster core, the tidal field strips material from the group, thus moving it to lower surface brightness, increasing the ICL luminosity fraction
Cluster C3
In cluster C3, we see our most dramatic example of an ICL production event, shown at the bottom Fig. 2. At the cluster consists of no less than four distinct galaxy groups. At all of these groups have collapsed together, resulting in a very large loss in the ICL luminosity fraction. As the groups separate again, huge amounts of material are stripped from the groups, resulting in the single largest ICL production event observed in any of these three clusters.
3 Conclusions
By modeling the dynamical evolution of luminous cluster galaxies, we have been able to trace the evolution of the clusters’ diffuse ICL using simulated broadband images of clusters. We find that not only does the fraction of cluster luminosity at ICL surface brightness increase with dynamical time, but that the ICL evolution is tightly linked to the specific dynamical histories of the clusters. Major increases in ICL luminosity are highly correlated with small scale interactions and accretions between groups within the clusters. Because the features of ICL production observed in these simulations are so tightly correlated with specific evolutionary events within the clusters, observations of this low surface brightness material has the potential to reveal a great deal of hitherto inaccessible information about the dynamical history of galaxy clusters.
This research has been supported by the National Science Foundation, Research Corporation, and the Jason J. Nassau Graduate Fellowship Fund.
References
- (1) J. C. Mihos: this volume
- (2) C. S. Rudick, J. C. Mihos, C. McBride: in press
- (3) B. Willman, F. Governato, J. Wadsley, & T. Quinn: MNRAS 355, 159 (2004)
- (4) J. Sommer-Larsen, D. A. Romeo, & L. Portinari: MNRAS 357, 478 (2005)
- (5) J. J. Feldmeier, J. C. Mihos, H. L. Morrison, S. A. Rodney, & P.H. Harding: ApJ 575, 779 (2002)
- (6) J. C. Mihos, P. H. Harding, J. J. Feldmeier, & H. L. Morrison: ApJ 631, L41 (2005)