GALEX Observations of “Passive Spirals” in the Cluster Cl 0024+17: Clues to the Formation of S0 Galaxies
Abstract
We present new results from deep GALEX UV imaging of the cluster Cl 0024+17 at . Rest-frame far UV emission is detected from a large fraction of so-called “passive spiral galaxies” –a significant population which exhibits spiral morphology with little or no spectroscopic evidence for ongoing star formation. This population is thought to represent infalling galaxies whose star formation has been somehow truncated by environmental processes, possibly in morphological transition to S0 galaxies. Compared to normal cluster spirals, we find that passive spirals are redder in FUV–optical color, while exhibiting much stronger UV emission than cluster E/S0s - as expected for recently-truncated star formation. By modeling the different temporal sensitivities of UV and spectroscopic data to recent activity, we show that star formation in passive spirals decayed on timescales of less than 1 Gyr, consistent with ‘gas starvation’ - a process where the cluster environment prevents cold gas from accreting onto the spiral disk. Intriguingly, the fraction of spirals currently observed in the passive phase is consistent with the longer period expected for the morphological transformation and the subsequent build-up of cluster S0s observed since 0.4.
Subject headings:
galaxies: clusters: individual (Cl 0024+1654) — galaxies: spiral — galaxies: evolution — galaxies: stellar content — ultraviolet: galaxies1. INTRODUCTION
In normal spiral galaxies, the ultraviolet (UV) luminosity depends sensitively on the presence of two components: young, hot stars and dust. UV continuum observations are sensitive to star formation on timescales of few 100 Myr and can thus place strong constraints on both current and recent activity, particularly if independent estimates of dust extinction are available. Due to its wide field of view, the Galaxy Evolution Explorer (GALEX) satellite allows an efficient census of the UV content of galaxies (Martin et al., 2005). Here we use GALEX imaging to address a key issue in galaxy evolution: the search for objects in morphological transition in intermediate redshift clusters.
It has been known for many years that galaxies in rich clusters are generally bluer and more active at intermediate redshift (Butcher & Oemler, 1978, 1984). With the aid of Hubble Space Telescope (HST) imaging, recent quantitative studies of the evolving morphology-density relation (Dressler et al., 1997; Smith et al., 2005; Postman et al., 2005) lend support to the suggestion that blue star-forming cluster spirals have been somehow transformed into red S0s (Couch & Sharples, 1987). In order to understand how such transformations might occur, several spectroscopic and photometric surveys of intermediate redshift clusters have sought to pinpoint samples of galaxies which are in the (presumed short-lived) transitional phase (e.g. Couch et al., 1998; Poggianti et al., 1999; Balogh et al., 1999).
Several candidate object classes have been identified from spectroscopic data utilizing the combination of [O II] emission and Balmer absorption, which are respectively sensitive to ongoing star formation and recent star formation on timescales of 1 Gyr. These include the “E+A” or “k+a” galaxies that exhibit a deep Balmer H line (Dressler & Gunn, 1983, 1992), and the “e(a)” galaxies that combine [O II] emission with strong Balmer absorption (Poggianti et al., 1999). Recent studies indicate that e(a) spectra are largely associated with dusty starburst galaxies (Poggianti & Wu, 2000), and that (k+a)s are associated with the post-starburst remnants of a merger or close encounter (Goto 2005; Tran et al. 2003–but see also Poggianti et al. 2004). However, there are few intermediate redshift S0 galaxies with e(a) or post-starburst spectral signatures (Poggianti et al., 1999). Indeed Moran et al. (2005) found no difference between the stellar populations of Es and S0s at - an unexpected result if S0s were recently created from starbursting systems. Clearly, our understanding of the evolutionary link between e(a)/k+a galaxies and S0s remains incomplete.
Recently, a further interesting class has been identified - the so-called “passive spirals” (Couch et al., 1998; Dressler et al., 1999; Poggianti et al., 1999; Goto et al., 2003). These objects exhibit spiral morphology in HST images, but reveal weak or no [O II] emission. Some authors have suggested that these are spiral-to-S0 transition objects where cessation of star formation occurs on a faster timescale than the transformation of spiral morphology. Such a delay in the morphological transformation would naturally explain the older stellar populations inferred from optical spectra of S0s (Poggianti et al., 1999; Moran et al., 2005). Theoretical models by Bekki, Couch & Shioya (2002) have shown that this scenario is consistent with gas “starvation”, an interaction with the intra-cluster medium that serves to inhibit star formation by halting the accretion of cold halo gas onto the galaxy disk (see Larson, Tinsley, & Caldwell, 1980; Quilis, Moore, & Bower, 2000; Treu et al., 2003). Without further gas accretion, Bekki et al. (2002) found that the spiral arms fade within 3 Gyr.
Goto et al. (2003) find that passive spirals in the SDSS reside preferentially in intermediate density environments, confirming this is a cluster-related phenomenon. Balmer H absorption is weaker in passive spirals than in the overall spiral population (Goto et al., 2003; Poggianti et al., 1999), suggesting their stellar populations already resemble the older populations found in E+S0 (“early-type”) galaxies. To date, however, little else is known about the detailed star formation histories of passive spirals.
In this paper, we combine GALEX UV imaging of Cl 0024+17, a rich cluster at , with extensive HST imaging and Keck spectroscopy to constrain the recent and ongoing star formation rates (SFRs) of passive spirals. We compare our measurements of UV–optical colors and key spectral lines with model star formation histories. This combination of diagnostics allows us for the first time to distinguish between several explanations for the nature of the passive spirals.
2. OBSERVATIONS AND SAMPLE SELECTION
2.1. Data
We make use of HST imaging and Keck spectroscopy of Cl 0024+17 from the comprehensive wide-field survey fully described in Treu et al. (2003) and Moran et al. (2005). Briefly, the survey builds on a sparsely-sampled mosaic of 39 WFPC2 images taken in the F814W filter ( band), providing coverage to a projected radius Mpc. Treu et al. (2003) reported reliable morphological classifications to and we combine these classifications with Keck spectroscopy in order to define three samples of cluster members: passive spiral, “active” or star-forming spiral, and E+S0.
Cl 0024+17 was observed for 13.3ksec with GALEX in 2004 October (GO-22; Cycle 1; PI Treu) in both near (NUV) and far ultraviolet (FUV) filters (Martin et al., 2005; Morrissey et al., 2005). As GALEX’s field of view is , the images readily cover the full HST mosaic. The NUV band closely matches the rest-frame FUV at 0.4 (), so we focus on that band. Galaxy fluxes were measured within circular apertures, centered on the optical position, and comparable to our measured NUV FWHM of . Such a fixed-size aperture makes the detection limits easier to interpret. We apply a fixed 20% aperture correction for agreement with SExtractor-derived total magnitudes (MAG_AUTO), and for comparison to MAG_AUTO magnitudes in F814W (Bertin & Arnouts, 1996). The kcorrect software v.4_1_2 (Blanton et al., 2003) was used to convert observed NUV and F814W fluxes to rest-frame FUV and V luminosities. A Galactic extinction of E(B–V)=0.056 (Schlegel et al., 1998) was assumed.
Observations with the DEIMOS spectrograph on Keck II from October 2001 to October 2005 secured spectra for over members of Cl 0024+17 (300 with HST imaging). Details are provided in Treu et al. (2003), Moran et al. (2005), and Moran et al. (2006, in prep). We augment our sample with cluster members derived from the CFHT survey of Czoske et al. (2001), who reported the strengths of (or the absence of) several spectral lines including [OII]. For both the Keck and CFHT spectra, we use Lick-style indices which are measured as described in Moran et al. (2005) and references therein.
2.2. Sample Selection
As faint emission line objects are easier to robustly identify than those without emission, there is a potential bias against identifying “passive” objects. To minimize this effect, we adopt a bright magnitude limit , where the sample is nearly unbiased (Moran et al., 2005). Reliable visual morphologies are available to the same limit(Treu et al., 2003).
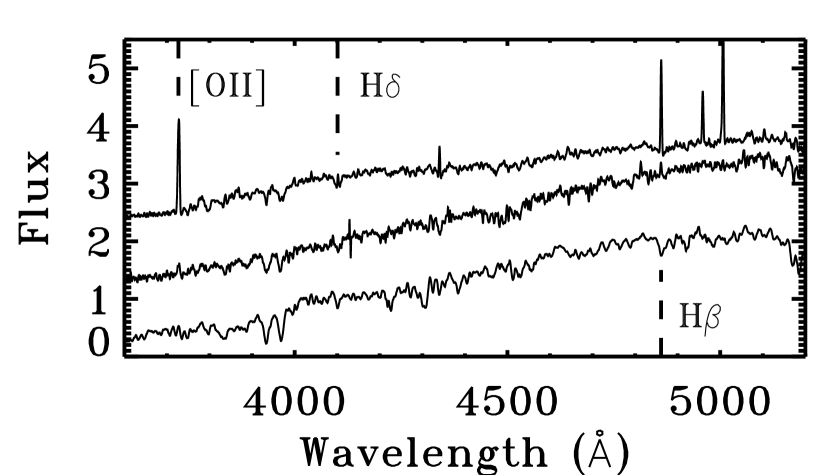
We define as “passive” any Sa–Sd spirals which have EW([OII]) (Dressler et al., 1999; Poggianti et al., 1999), with “active” spirals having EW([OII]) ; a more stringent limit is precluded by signal to noise considerations. While this definition does not exclude (k+a) or e(a) spirals as separate classes, our Cl 0024 sample contains only two spirals with EW(H)H, both with [OII] emission. To be consistent in comparing passive spirals with E+S0 galaxies, we likewise exclude all early-types with EW([OII]) (). We manually examined all optical and UV galaxy images to ensure correct associations. We removed from the sample all galaxies where the UV flux is centered on a neighbor, or is otherwise contaminated; this reduced the total sample by . Adopting these procedures, we obtained a sample of 68 cluster spirals, of which 24 are passive and 44 active. The comparison sample of passive E+S0s contains 75 objects. In Figure 1, we show the coadded, normalized spectra of E+S0s, passive spirals, and active spirals.
3. UV EMISSION IN PASSIVE CLUSTER SPIRALS
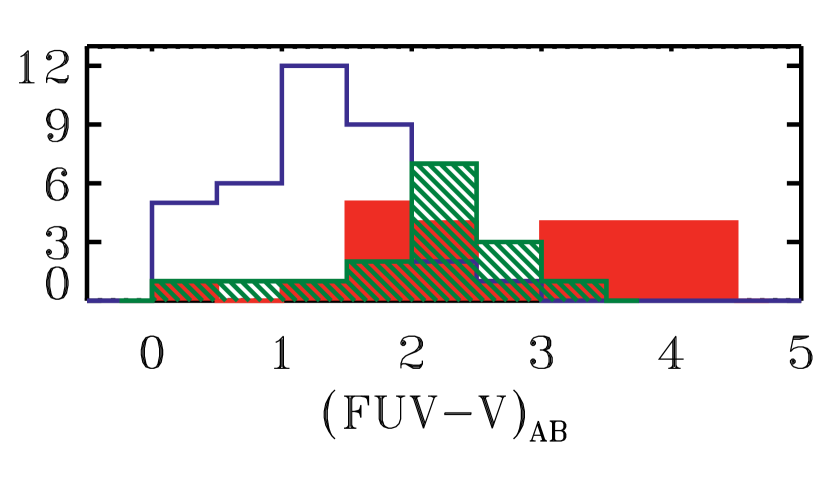
While the optical spectra of passive spirals are noteworthy for their resemblance to those of red early-types (Figure 1, Dressler et al., 1999), their FUV properties reveal a very different picture. A large fraction of passive spirals in Cl 0024 emit vigorously in the FUV. The fraction of UV-detected passive spirals () is , not significantly different from that of active spirals (). However, only of the early-type galaxies are similarly detected in the UV, clearly indicating that the stellar populations of passive spirals differ from those of the early type galaxies.
Moreover, Figure 2 shows that the UV-detected passive spirals have FUV – V colors intermediate between the bluer active spirals and the early-types, which span a wide range extending the furthest to the red. A K-S test confirms that the FUV – V colors of passive spirals differ from those of E+S0s with confidence. These intermediate colors strongly suggest that passive spirals bridge the gap between the blue and red galaxy sequences. Below, we evaluate this suggestion by considering model star formation histories.
4. MODEL STAR FORMATION HISTORIES
The detection of strong FUV emission from passive spirals is perhaps surprising in a simple picture where the UV light and optical emission lines are generated simultaneously from the same star forming regions. Here, we explore possible explanations. The key to understanding the observation lies in the hierarchy of lifetimes of the stars responsible for the strong H absorption (109 yrs), FUV flux (107-108 yrs) and hard ionizing photons (107 yrs).
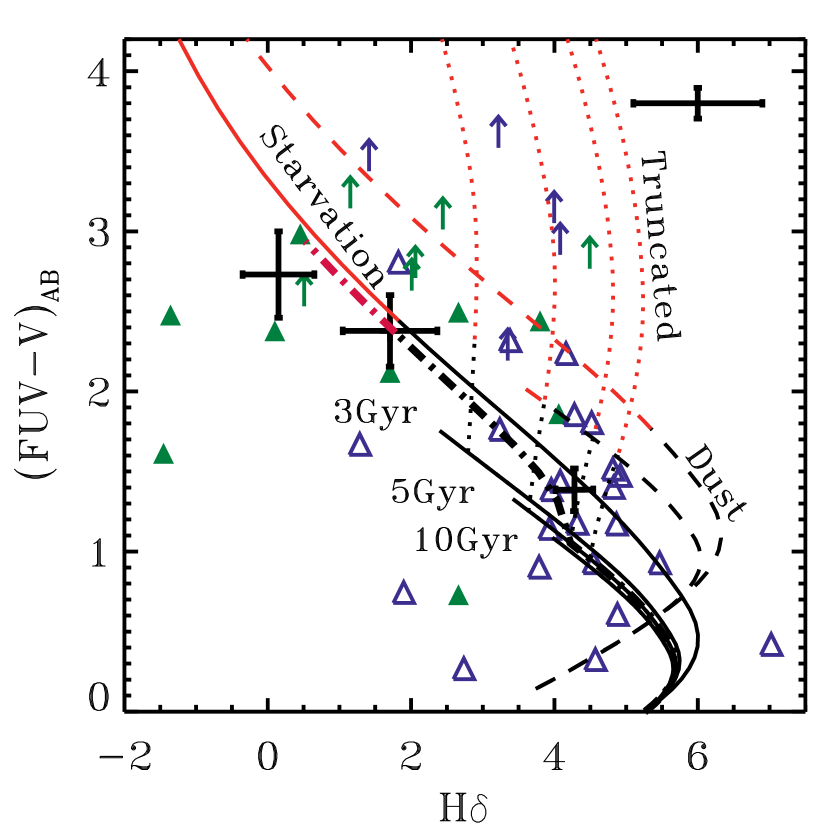
It is useful at this point to introduce the FUV – V vs H diagram, which we will use as our main diagnostic tool. Firstly, by comparing signatures of star formation over different timescales, this diagram allows us to explore the recent star formation history of active and passive spirals and to assess whether they can be connected in an evolutionary sequence. Secondly – since FUV – V is sensitive to dust extinction while H is not (e.g. MacArthur, 2005; Sato & Martin, 2006) – this diagram allows us to explore whether the redder FUV – V colors of passive spirals with respect to active spirals could be due to dust instead of differences in the recent star formation history.
Figure 3 shows the location of passive and active spirals in the FUV – V vs H diagram. Active spirals (open blue triangles) are clustered at a blue FUV – V color with moderately strong Balmer absorption (H), whereas the passive spirals (solid green triangles) extend to redder FUV – V colors with weaker H. The mean location of each population is marked as an error-barred point; errors indicate uncertainty in the mean. The error-barred point with the weakest H is a composite of 13 passive spirals that cannot be plotted individually, either due to lack of reliable H or contamination of FUV flux. We coadded available spectra for these galaxies to measure H, and we adopt the mean of available FUV – V. This composite lies near the locus of individually plotted passive spirals at low H and red FUV – V.
Evolutionary tracks from the population synthesis code of Bruzual & Charlot (2003) are overlayed in Figure 3 We consider only solar metallicity, and only plot model points reached in less than the time between formation at and observation at ( Gyrs). Tracks are in red for regimes where EW([OII]); we use SFRs and from the Bruzual & Charlot (2003) models to estimate EW([OII]) according to the relation in Barbaro & Poggianti (1997). We calculate [OII] attenuation by dust following Calzetti et al. (1994), with nebular emission extincted more strongly than the stellar continuum (), but caution that this is only a representative model. We subtract from H for all model tracks to account for infilling by nebular emission, as estimated from Barbaro & Poggianti (1997).
Solid lines represent exponentially-declining SFRs. Those marked with characteristic timescales Gyr have been found to reproduce the optical spectra of Sa, Sb, and Sc–type galaxies (“active” spirals), respectively (Poggianti & Barbaro, 1996). Dashed lines include dust extinction of , corresponding to the mean difference in FUV – V between the passive and active spirals, for a Cardelli et al. (1989) extinction law with RV=3.1. The lower dashed line is a representative Gyr model with dust. The uppermost dashed and solid lines represent a Gyr SFR (with and without dust) and will be discussed below. Active spirals largely occupy the region in between tracks with zero and moderate extinction.
While adding extinction to the active spiral models can serve to reproduce the lack of emission lines and the redder FUV – V colors of the passive spirals, as expected it has very little effect on the H values. Thus, while a model with extincted star formation is sufficient to explain those passive spirals with higher H, it is unable to account for the bulk of the population observed with weaker H. Conceivably, more complex dust screens could account for this deficiency, but we will explore a more straightforward explanation where the SFR is suppressed as a result of environmental processes.
We first consider “truncated” star formation: in Figure 3, we plot (as dotted lines) several representative Gyr models where SFR instantaneously falls to zero at an age between Gyr, representing a range of initial formation ages. Such models eventually generate both lower H values and redder FUV – V colors after star formation is turned off, but the UV emission decays too rapidly, falling below our GALEX detection limit well before low H values are reached.
Only models with a relatively fast exponential decline in SFR ( Gyr, upper solid and dashed lines in Figure 3) can match the FUV – V and H of the bulk of passive spirals. Alternatively, any of the active spiral models with Gyr can migrate toward the Gyr track if its star formation begins to decline at a much steeper exponential rate (thick dash-dotted line in Figure 3), entering into a spectroscopically passive phase. The two scenarios are essentially equivalent, differing only in the age of the galaxy when it enters the passive phase, and the amount of dust extinction applied.
5. Discussion
Remarkably, the star formation histories with a sharp decline in SFR resemble those expected for spirals affected by “starvation” (Bekki, Couch & Shioya, 2002; Larson, Tinsley, & Caldwell, 1980; Quilis, Moore, & Bower, 2000). As the accretion of gas is rapidly cut off, star formation decays on a short timescale as the remaining disk gas is used up ( Gyr Gyr, according to Larson et al. 1980). More generally, we might expect that any “gentle” physical mechanism that inhibits star formation without immediately affecting the spiral morphology would behave similarly. A gentle mechanism is also easier to reconcile with the observed homogeneity of the stellar population and dynamical properties of S0 galaxies (Treu et al., 2003; Moran et al., 2005). Models with no explicit break in SFR, but with low values of (), reproduce the passive spiral data as well as the starvation model, and seem not to require the action of any physical mechanism. Yet passive spirals seem to be most prevalent in clusters (Goto et al., 2003), suggesting that a cluster-related mechanism contributes to their formation.
Since few passive spirals are observed with an FUV upper limit (8/24), we might expect that any morphological transition occurs soon after a passive spiral fades below our FUV limiting magnitude. For the model starvation track plotted as a thick dash-dotted line in Figure 3, the total lifetime from the halt of gas accretion to the point where the FUV luminosity fades below our detection limit is Gyrs, in good agreement with the morphological transformation timescale predicted by Bekki, Couch & Shioya (2002).
This particular evolutionary track spends Gyr in a phase with EW([O II]) and detectable FUV (for the mean ). The fraction of all bright spirals in this UV-detected, spectroscopically passive phase is in Cl 0024, though some contamination is likely from galaxies undergoing dust-obscured star formation. These statistics enable us to consider whether the fraction of passive spirals observed is consistent with the buildup of the S0 fraction from to .
Following Smith et al. (2005), we define the ratio of S0 to ellipticals today, , in terms of the passive spiral fraction and S0 fraction at :
| (1) |
where is the lookback time to , 4 Gyr, and is the passive spiral lifetime of 1.5 Gyr. The last term accounts for the buildup of ellipticals through other means, which we set equal to 1 for this simple analysis. Taking (Dressler et al., 1997) and 111According to Dressler et al. (1997), the ratio of ellipticals to spirals is nearly unity in Cl 0024, so , we calculate , in rough agreement with from Dressler et al. (1997). This shows that passive spirals undergoing starvation can evolve into present day S0s, consistently with the observed evolution of the morphology density relation.
While starved spirals cannot build up the entire population of local S0s due to differences in the stellar mass functions of local S0s and spirals (Kodama & Smail, 2001), our result provides strong evidence that the abundant passive spiral population at intermediate redshift is an important transition population which contributes to the present-day cluster S0 population. By combining the different post-burst timescales probed by GALEX UV imaging and optical spectroscopy, we have delineated a duty-cycle of gradual decline in activity consistent with the recent growth in the S0 population.
References
- Balogh et al. (1999) Balogh, M. L., Morris, S. L., Yee, H. K. C., Carlberg, R.G., Ellingson, E. 1999, ApJ, 527, 54
- Barbaro & Poggianti (1997) Barbaro, G. & Poggianti, B. M., 1997, A& A, 324, 490
- Blanton et al. (2003) Blanton, M. R. et al. 2003, AJ, 125, 2348
- Bekki, Couch & Shioya (2002) Bekki, K., Couch, W. J., & Shioya, Y., 2002, ApJ, 577, 651
- Bertin & Arnouts (1996) Bertin, E. & Arnouts, S. 1996, A&AS, 117, 393
- Bruzual & Charlot (2003) Bruzual, G., & Charlot, S. 2003, MNRAS, 344, 1000
- Butcher & Oemler (1978) Butcher, H., & Oemler, J., Jr., 1978, ApJ, 226, 559
- Butcher & Oemler (1984) Butcher, H., & Oemler, J., Jr. 1984, ApJ, 285, 426
- Cardelli, Clayton,& Mathis (1989) Cardelli, J. A., Clayton, G. C., & Mathis, J. S. 1989, ApJ, 345, 245
- Calzetti et al. (1994) Calzetti, D., Kinney, A. L. & Storchi-Bergmann, T., 1994, ApJ, 429, 582
- Couch & Sharples (1987) Couch, W. J., & Sharples, R. M. 1987, MNRAS, 229, 423
- Couch et al. (1998) Couch, W. J., Barger, A. J., Smail, I., Ellis, R. S., & Sharples, R. M. 1998, ApJ, 497, 188
- Czoske et al. (2001) Czoske, O., Kneib, J.-P., Soucail, G., Bridges, T. J., Mellier, Y., Cuillandre, J.-C. 2001, A& A, 372, 391
- Dressler & Gunn (1983) Dressler, A. & Gunn, J. E. 1983, ApJ, 270, 7
- Dressler & Gunn (1992) Dressler, A. & Gunn, J. E. 1992, ApJS, 78, 1
- Dressler et al. (1997) Dressler, A., et al. 1997, ApJ, 490, 577
- Dressler et al. (1999) Dressler, A., Smail, I., Poggianti, B., Butcher, H., Couch, W. J., Ellis, R. S., & Oemler, A., Jr. 1999, ApJS, 122, 51
- Goto (2005) Goto, T. 2005, MNRAS, 357, 937
- Goto et al. (2003) Goto, T. et al. 2003, PASJ, 55, 771
- Kodama & Smail (2001) Kodama, T. & Smail, I., 2001, MNRAS, 326, 637
- Larson, Tinsley, & Caldwell (1980) Larson, R. B., Tinsley, B. M., Caldwell, C. N., 1980, ApJ, 237, 692
- MacArthur (2005) MacArthur, L. A., 2005, ApJ, 623, 795
- Martin et al. (2005) Martin, D. C. et al. 2005, ApJL, 619, 1
- Moran et al. (2005) Moran, S. M., Ellis, R. S., Treu, T., Smith, G. P., Smail, I., Dressler, A., Coil, A. L. 2005, ApJ, 634, 977
- Morrissey et al. (2005) Morrissey, P. et al., 2005, ApJL, 619, 7
- Poggianti et al. (2004) Poggianit, B. M., Bridges, T. J., Komiyama, Y., Yagi, M., Carter, D., Mobasher, B., Okamura, S., & Kashikawa, N., 2004, ApJ, 601, 197
- Poggianti & Wu (2000) Poggianti, B.M. & Wu, H., 2000, ApJ, 529, 157
- Poggianti et al. (1999) Poggianti, B. M., Smail, I., Dressler, A., Couch W. J., Barger, A. J., Burtcher, H., Ellis, R. S., & Oemler, A., Jr. 1999, ApJ, 518, 576
- Poggianti & Barbaro (1996) Poggianti, B. & Barbaro, G., 1996, A& A, 314, 379
- Postman et al. (2005) Postman, M. et al. 2005, ApJ 623, 721
- Quilis, Moore, & Bower (2000) Quilis, V., Moore, B. & Bower, R. 2000, Science, 288, 1617
- Sato & Martin (2006) Sato, T. & Martin, C.L., 2006, ApJ submitted
- Schlegel et al. (1998) Schlegel, D.J., Finkbeiner, D. P., & Davis, M. 1998, ApJ, 500, 525
- Smith et al. (2005) Smith, G. P., Treu, T., Ellis, R. S., Moran, S. M., Dressler, A. 2005, ApJ, 620, 78
- Tran et al. (2003) Tran, K. H., Franx, M., Illingworth, G., Kelson, D. D., & van Dokkum, P. 2003, ApJ, 599, 865
- Treu et al. (2003) Treu, T., Ellis, R. S., Kneib, J. et al. 2003, ApJ, 591, 53