High Quality Early Time Light Curves of GRB 060206: Implications for Gamma Ray Burst Environments and Energetics
Abstract
The 2-m robotic Liverpool Telescope (LT) reacted promptly to the high-redshift () gamma–ray burst GRB 060206. The afterglow was identified automatically and multicolor imaging program was triggered without human intervention. Combining our data with those obtained from later follow-ups provides a well-sampled optical light-curve from 5 minutes to 2d after the gamma event. The light-curve is highly structured with at least three bumps evident in the first 75 minutes, including a major rebrightening ( at ), interpreted as late energy injection. At early time (), we find evidence for fast () variability, indicating on-going internal-engine activity. We emphasise that a low redshift GRB () with similar intrinsic properties would have been interpreted completely differently due to undersampling of the light curve in the rest frame at early times; the light-curve behaviour of GRB 060206 should therefore not be considered peculiar. Finally, although the observed late-time steepening of the optical light curve resembles a jet break if taken in isolation, the lack of a corresponding change in the X-ray slope rules out a jet-break interpretation. Traditionally, GRB jet breaks have been inferred from optical data in the absence of simultaneous X-ray data. We suggest therefore that current estimates of the jet opening angle distribution might be biased by events like GRB 060206. Consequently, the GRB explosion energy distribution and event rates may have to be revised.
Subject headings:
gamma rays: bursts - cosmology: observations1. Introduction
The Swift satellite (Gehrels et al., 2004), launched in November 2004 and specifically designed to study Gamma Ray Bursts, is providing an overall rate of about 100 real-time gamma localizations per year. A considerable fraction () are reobserved within minutes by the on-board X-ray (XRT) and UV-optical (UVOT) narrow field-of-view instruments, whilst an increasing number of ground-based robotic facilities are participating actively in the worldwide follow-up program by responding rapidly to satellite alerts. As a result, the number of GRBs with early-time light curves and spectroscopically determined redshift has increased dramatically over the last 18 months. Thus, in addition to important recent results such as the detection of short burst afterglows and the observation of the most distant (z6) GRB observed to date (Haislip et al., 2005; Antonelli at al., 2005)), the following facts are emerging: a) a higher mean redshift () for Swift GRBs (Jakobsson et al., 2006) compared with those detected in the pre-Swift era ( (Berger et al., 2005)); b) 990123-like (Akerlof et al., 1999) prompt flashes are on average weaker and less frequent than expected; c) a population of faint bursts (truly dark only in absence of an early, deep follow-up) providing useful constraints on existing optical suppression models (Roming et al., 2005; Oates et al., 2006); d) huge, rapidly rising and decaying flares observed in the X-ray light-curves, indicating probable late-time activity of the inner engine (Burrows et al., 2005). The growing evidence for continued activity of the central engine, the detailed physics of which remains elusive, and the opportunity to probe the interaction of expanding shells with the circumburst/interstellar medium, particularly at high redshift, demand dedicated prompt followup observing programs. Large robotic telescopes such as the 2-m Liverpool Telescope are optimised for such followup and are proving effective (Guidorzi et al., 2005, 2006).
Early afterglow light curves exhibit a considerable variety and rebrightenings (hereafter called bumps) are becoming more frequently observed. GRB 021004 (Bersier et al., 2003; Matheson et al., 2003; Holland et al., 2003) remains one of the best studied events () and a number of different models have been invoked to explain its temporal behaviour: variable density profile (Lazzati et al., 2002), passage of the break frequency (Kobayashi & Zhang, 2003), refreshed shocks (Nakar et al., 2003; Björnsson et al., 2004; de Ugarte Postigo et al., 2005) , angular dependence of the energy profile on the jet structure (Nakar et al., 2003). Another interesting case is GRB 030329 (), preferably modeled according to the refreshed shocks (late energy-injections) scenario (Huang et al., 2006). In this case, initially slower shells catch up with the external shock front, which, in the meantime, is decelerating due to the interaction with the surrounding medium. The early afterglow of GRB 050502a () exhibited a smooth decay, well-fitted by a power-law with index (), followed by a an achromatic bump emerging at that has been interpreted by Guidorzi et al. (2005) as due to density clumps in a uniform medium. More recently, an increasing number of events, in particular at high-z, exhibit rebrightenings (Rykoff et al., 2006; Stanek et al., 2006). These observations support the hypothesis such behaviour might not be unusual. We report here multicolor robotic observations of GRB 060206 carried out by the Liverpool Telescope (LT) and revealing a structured behaviour of the early lightcurve. The 2-m aperture of the LT, the optimal observing conditions and a precise SDSS pre-burst field calibration (Cool et al., 2006) contributed to the remarkable quality of the dataset. Timely later photometry from RAPTOR (Wozniak et al., 2006) and MDM (Stanek et al., 2006) allowed us to compile an exceptionally information-rich light-curve catching the different phases of the early afterglow.
2. Observations and Analysis
On 2006 Feb 06, 04:46:53 UT111t=0 throughout the paper. Swift-BAT detected GRB 060206 (trigger 180455) at Galactic Coordinates l=78.07deg, b=78.28deg222According to Schlegel et al. (1998) . The estimated extinction, from Cardelli et al. (1989) curve, is , and . (3 arc-min 90% containment radius). In the band the prompt gamma profile is well described by a single quasi-gaussian peak with duration . Swift-XRT began observing 65s after the BAT trigger time and entered the South Atlantic Anomaly soon afterwards (Morris et al., 2006). UVOT started the on-target monitoring practically at the same time. As usual, a number of ground-based facilities were activated to follow-up the event. The redshift has been spectroscopically measured to be (Fynbo et al., 2006). Robotically triggered photometric observations with the Liverpool Telescope began at after the GRB, at an airmass of . A sequence of exposures, named detection mode, aims at finding potential afterglow candidates and automatically triggers the best suitable early follow-up observing program. Details of the procedure are reported elsewhere by Guidorzi et al. (2006). In the GRB 060206 case, a repeated sequence of 120s exposures was initiated. The afterglow is detected with high S/N in all the single exposures. Calibration was facilitated and greatly improved by the availability of SDSS pre-burst photometry (Cool et al., 2006). We adopted 5 calibrated star-like PSF field objects to adjust the zero-point of the single images. The zero points were stable throughout the observation sequence, and consistent with nominal LT values333Confirmed also by the CMT in La Palma. Nightly averaged atmospheric extinction: r’=0.076. http://www.ast.cam.ac.uk/dwe/SRF/camc_extinction.html. Photometry was carried out independently using the Starlink/GAIA and DoPHOT programs. The datasets are in complete agreement with each other, and the results have been combined to further reduce the systematics. Magnitudes are converted into flux densities (mJy) following Fukugita et al. (1996). Results are summarized in Table 1.
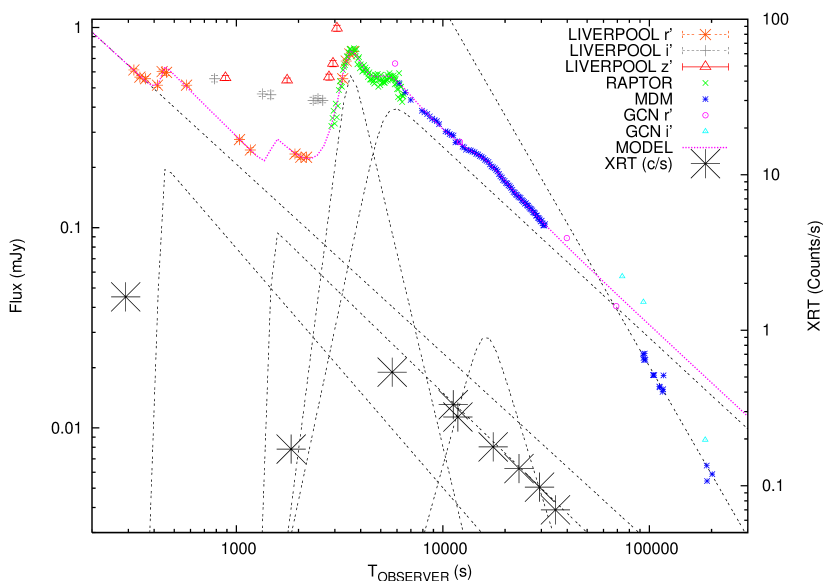
Figure 1 shows the complete lightcurve of GRB 060206. 100 RAPTOR (Wozniak et al., 2006) and 101 MDM (Stanek et al., 2006) photometric points have been included together with selected GCNs. The RAPTOR unfiltered values, calibrated with respect to USNOB1.0-R2 magnitudes (Wozniak et al., 2006), have been flux-recalibrated with respect to the earlier LT data. This is equivalent of shifting the RAPTOR data by +0.3 magnitudes. This approach relies on a relatively stable colour. At a first glance this assumption might look uncertain since we are actually presenting evidence of a spectral evolution across the bump. However, by assuming a realistic , a rather small is estimated. This systematic correction has been added to the synthetic late photometry data. In any case this isn’t in any way affecting our conclusions. The MDM data, as in Stanek et al. (2006), have been shifted by +0.22 magnitudes with respect to RAPTOR and accordingly converted into physical units. XRT data have been processed with the ftool ’xrtpipeline’ to produce cleaned level II event files, applying default screening constraints. We select only events with grade 0 for both PC (Photon Counting) and WT (Windowed Timing) modes. For PC mode, we initially considered a 20 pixel-radius circle centred on the source. From the PSF profile, it was clear the data were partially affected by pile-up; following Vaughan et al. (2006), we corrected for this by excluding photons within a 5-pixel radius inner circle and then renormalised the resulting light curve for the fraction of the PSF profile considered. Background spectrum and light curve have been taken from four 50-pixel radius circles with no sources. No significant pile-up was found to affect WT data, following the procedure described in Romano et al. (2006). We adopted empirical ancillary files for the spectra created with the ftool ’xrtmkarf’. We used the latest spectral response matrices in the Calibration Database (CALDB 2.3).
2.1. r’ Lightcurve Fit
The analytical model adopted for the fit, up to the break at , is:
| (1) |
This is the sum of a number of smoothly connected broken power-laws
(Beuermann et al., 1999). and depend on j and are the
exponents at and and the bump (break)
time. When and , a bump is produced. A
typical light-curve break, on the other hand, is obtained when
and . The constant
controls the smoothness of the transitions, but has a relatively small
influence in this context (see Table 2). is the
individual flux contribution at the bump (break) time. In the case of
GRB 060206 the index runs from 0 to 5 (see Figure 1). The segment is, by
definition, associated with and is therefore a simple
power-law fitting the earliest LT photometric points. The
segment accounts for the sharp, earliest bump occurring at
and the subsequent decay. The next segment describes
three r’ points lying at . However, this fit at 2000s
is not unique as one may also fit the flattening of the curve around
this time with , beginning immediately after
. Although this scenario may seem simpler than introducing a
bump component via , assuming an achromatic flattening in the
band curve for (constrained by sampling)
would in turn imply a rebrightening in and . This confirms
that a bump is required in this time interval. In our analytical model
the bump time is arbitrarily fixed to , and the shape fixed
by the earliest case template. The only variable is the peak flux
that is in any case non significantly affected by .
In other words, a small rebrightening at is necessary
because it is not possible to fit the light curve in all 3 colors ()
without including a bump at that time.
The next segments, provide a good fit to the biggest double-peaked
bump (, ). Most importantly, the
cosmological time dilation implies that the intense activity
described so far took place in less than 15 minutes in the rest frame.
The last feature before the final break, possibly associated to a density variation,
takes place at and is well described by the term.
In absence of a systematic photometric sampling close to the late break
(), we fitted the MDM points with a simple,
independent power-law.
The analytical model validity is thus limited to , before the
occurrence of the inferred break.
The result is a steepening from () to
().
We note that these values differ slightly from those found by Stanek et al. (2006)
who derived to . The difference is to be attributed
probably to the bump that is recognized as a separate feature in our view, but
included in the general pre-bump slope in Stanek et al. (2006).
That late break nature is discussed in more detail in the next Section.
The analytical model fit was performed separately in three different time ranges:
( Degrees Of Freedom), ( ) and
( ). Since the fit parameters are common, the
procedure is iterated to let them converge to the same values in the
three intervals. Convergence is achieved after iterations,
and the result is then stable indicating that a true global minimum
has been reached. A summary of the parameters resulting from the fit
is reported in Table 2. In Figure 1 the
single components are shown together with the resultant fitted curve.
2.2. Multi-epoch Spectral Energy Distribution Analysis
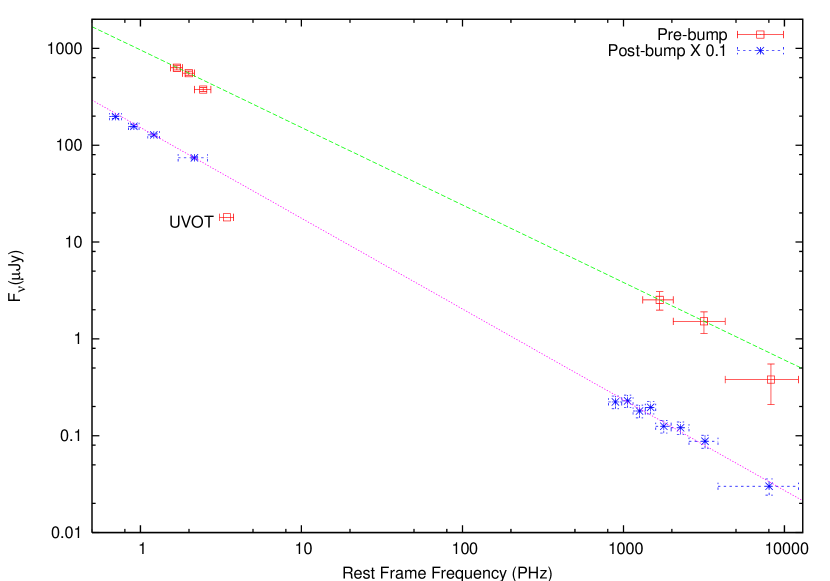
Figure 2 shows the pre-bump rest–frame SED interpolated at , where the lightcurve is relatively smooth, from LT and XRT data. The XRT spectral shape at this epoch have been assumed coincident with the PC early template (). The X-ray flux at , is derived from an (Table 2) power-law extrapolation. This seems a quite reasonable assumption (see Figure 1). Further, no significant differences are seen between the XRT spectra extracted from PC and WT modes. An extrapolated UVOT-B point has been added to provide important qualitative constraints. The average time behaviour of the B light-curve is assumed to follow the well-sampled case. An integral is performed over the UVOT time span (, Boyd et al. (2006)). The averaged is directly compared to . The following simple ratio relation provides an estimate of corresponding to the pre-bump epoch of interest:
| (2) |
At the four optical points are not reconcilable with a single power-law. The flux is slightly affected, according to Fynbo et al. (2006), by the deep Damped Lyman Alpha DLA absorption feature. The and values, on the other hand, can be very well extrapolated up to following a rather typical slope (). The point qualitatively confirms the pronounced absorption and is not included in the fitting procedure. Even if sparsely sampled, the positions of the and photometric points in the time interval clearly indicate either a SED evolution or an additional unresolved activity (or both combined). A rigid shift444The multiplicative factors for and are determined according to the earliest epoch and are respectively and . of the light-curve, interpreted either with the bump or the flattening, indicate that the and fluxes are significantly higher than expected. According to the photometric errors, the disagreement significance has been estimated in in the bump scenario (, for ). Analogous results assuming an achromatic flattening ( and ). We suggest that the SED evolution scenario is more conservative, but caution that a generally accepted quantitative picture would require better sampling of the light curves. As an additional note, we remark that the simple rescaling described in footnote is again able to account for the points calculated during the big bump rising slope. This might be a possible indication, even if not conclusive, that the SED is already relaxed before the bump reaches its peak.
In Figure 2 we show the post-bump SED at based on the PAIRITIEL
JHK detections (Alatalo et al., 2006) () and on the earliest MDM
point555We adopted the original Stanek et al. (2006) flux
instead of the estimated . The is thus completely unaffected by the
LT-to-RAPTOR conversion systematics described in detail in the text..
Both are back-extrapolated according to an temporal slope (table 2).
At this late time, already on the smooth side of the afterglow, the IR-X fluxes ()
are well fitted by a common power-law (). However, a broken
power-law with fixed indices , is not ruled out
(). The latter is considered in the light of the interpretative model discussed
later.
Post-break IR photometry (Terada et al., 2006) and MDM late observations give .
A summary of the spectral results is given in Table 3.
3. Discussion
3.1. Re-Brightening
After the remarkable rebrightening at hr and before the break around s, the optical flux is described by a single power law with , except small wiggles. This indicates that the blast wave radiating the afterglow had a significant transition from one Blandford-McKee (BM; Blandford&McKee 1976) solution to another BM solution around hr. Since blast wave solutions depend only on two parameters (explosion energy and ambient density) possible scenarios are energy injection (Rees& Mészáros 1998; Kumar& Piran 2000; Sari & Mészáros 2000) and a density-jump medium (Ramirez-Ruiz et al. 2001; Dai & Lu 2002). The degeneracy is broken by the X-ray observations. Since there is no signature of the cooling break in the decay phase of the X-ray afterglow (Morris et 2006), the X-ray band is likely to be located above the cooling frequency at hr. This implies a high ambient density, consistent with spectroscopic determinations (Fynbo et al., 2006). The late time break in the optical light curve also favors at hr as we will discuss below. If the X-ray band is above the cooling frequency, the flux does not depend on the ambient density (Freedman & Waxman, 2001). We can conclude that the X-ray rebrightening is not due to a jump in the ambient density.
According to Kumar & Piran (2000), in the absence of a density enhancement, the flux depends on the explosion energy as:
| (3) | |||||
| (4) |
Since the optical flux increased by a factor of , the rebrightening indicates there was a huge impulsive energy injection at hr where is the blast wave energy right before the rebrightening. A typical p=2.3 value is assumed for the power-law distribution of electrons energies. Consistently with observations (Figure 1), the X-ray flux is expected to increase by a factor of 3. A rather smooth transition from one solution to the other at most wavelengths is expected. However, this is not the case at frequencies for which there is significant emission from the reverse shock (Kumar & Piran 2000; Kobayashi & Sari 2000). The sharp rise of the rebrightening implies that the typical frequency of the reverse shock is close to the optical band. The small wiggles before or after the major rebrightening can be explained by additional minor energy injection or density clumps in the ambient medium.
The energy injection is probably due to a decrease in the Lorentz factor of the outflow toward the end of the prompt GRB. This slow outflow collides with a blast wave when the blast wave have slowed down as a result of sweeping up the ambient material. Energy injection could also be caused by a long lasting activity of the central engine (Burrows et al. 2005). The energy in the blast wave at late times () is larger than that at the deceleration time by more than a factor of . This requires the prompt gamma-ray emission process (internal shocks) to be more efficient than previously considered (Ioka et al., 2005; Nousek et al., 2006; Zhang et al., 2006; Granot, Königl & Piran, 2006).
3.2. Jet Break?
The optical light curve of GRB 060206 steepened from to around s. Although this steepening resembles a jet break, the X-ray light curve from s to s remains consistent with a single unbroken power law decay with (Morris et al 2006). This clearly contradicts the monochromatic break predication by the jet model. In the wind model (Chevalier & Li, 1999), the cooling frequency increases as a function of time . The passage of the cooling frequency can produce a steepening of in the optical band first and in the X-ray later. The observed steepening gives . The cooling frequency rapidly increases as , and it will cross the X-ray band around s. The observed unbroken power law X-ray light curve up to s is consistent. However, this scenario does not account for the difference of the decay indices between the pre-break optical () and the X-ray () light curves, which should be on the same spectral segment and the decay rates should be identical to be consistent with the scenario.
A possible solution is that a blast wave initially propagates into a constant density medium , and around s it breaks out in a wind-type medium. Using the isotropic gamma-ray energy about ergs (Palmer et al. 2006), the transition radius is estimated in equation (5) in which and protons cm-3:
| (5) |
Although a large amount of energy is injected to the fireball after the prompt emission, the energy dependence of is rather weak. In this scenario, the order of the break and observational frequencies remains as after the major re-brightening hr. During the constant medium phase, the time and frequency dependences of the optical and X-ray flux are given by Equations (6) and (7) respectively (Sari, Piran & Narayan 1998):
| (6) | |||||
| (7) |
With the standard value of these give reasonable fits to the observational decay indices, while the estimated optical spectral index is slightly shallower than the observations . Moreover, a spectral break is not directly inferred between optical and X-ray that seem to lie on a single slope. However, as explained in the previous Section, the predicted value is not significantly ruled out when a broken power-law is invoked. When the blast wave propagates into a wind medium, as the ambient density decreases, the optical flux drops as where
| (8) |
for p=2.3 and s=2.5. Since the X-ray band is above the cooling frequency, its flux does not depend on the ambient density, and the X-ray decay index does not change before and after the break-out. Considering the scaling between the observer time and blast wave radius , the steep segment of the optical light curve requires that the ambient density should behave as between and . The steepening from to in the optical light curve looks like a typical jet break. The X-ray light-curve, however, shows no sign of a change in decay slope. This conflicts with the jet break potential interpretation based on the optical light-curve. In most previous events, X-ray data are not available at the “jet breaks”, and the breaks are interpreted based on optical data. The current estimate on the jet opening angle distribution might be biased by events like GRB 060206. Consequently, the GRB explosion energy distribution and the event rates may need to be reviewed.
4. Conclusions
We presented a comprehensive study of the high redshift GRB 060206 based on early robotic observations, later published photometry, GCN circulars and Swift public data. The composite monochromatic light-curve is exceptionally well sampled and extremely structured. An early, rebrightening suggests internal engine activity (internal shocks) continuing well beyond the gamma prompt emission. Later on, a high-significance SED evolution is inferred from multi–color photometry carried out by the Liverpool Telescope; this is probably associated with another pre-bump rebrightening. One hour after the GRB a significant, steep double-peaked rebrightening occurred, increasing the flux by a factor with respect to the pre-bump values. We interpret the cause of this rebrightening to be due to a late-time energy injection. The energy in the blast wave at late time () is a factor of 2.8 larger than that at the deceleration time, implying a higher internal shock efficiency than previously considered. Following the big bump, a rather typical spectral/temporal afterglow behaviour is observed, with a possible density variation feature superimposed on the smooth power-law decay. We interpret the fact that the steepening in the optical light-curve observed at post-burst is not matched by similar behaviour in the X-ray as due to a transition in the density distribution of the ambient medium, likely from a constant density medium to a wind medium. In the absence of X-ray data the observed optical steepening would have been interpreted as a typical jet-break. Since most of the so far observed jet-breaks lack corresponding X-ray confirmation, we suggest that current estimate on the jet opening angle distribution might be biased by events like GRB 060206. The GRB explosion energy distribution and the event rates are thus potentially affected.
References
- Akerlof et al. (1999) Akerlof, C., et al. 1999, Nature, 398, 400
- Alatalo et al. (2006) Alatalo, K., et al. 2006, GCN Circ. 4702
- Antonelli at al. (2005) Antonelli, L. A., Grazian, A., et al.2005, GCN Circ. 3924
- Aoki et al. (2006) Aoki, K. et al. 2006, GCN Circ. 4703
- Berger et al. (2005) Berger, E., et al. 2004, ApJ, 634, 501
- Bersier et al. (2003) Bersier, D., et al. 2003, ApJ, 584, L43
- Beuermann et al. (1999) Beuermann, K., Hessmann, F.V. et al. 1999, A&A, 352, L26
- Björnsson et al. (2004) Björnsson, G., Gudmundsson, E. H., & Jóhannesson, G. 2004, ApJ, 615, L77
- Blandford & McKee (1976) Blandford,R.D. & McKee,C.F. 1976, Phys. of Fluids, 19, 1130
- Boyd et al. (2006) Boyd, P., et al. 2006, GCN Circ. 4722
- Burrows et al. (2005) Burrows, D. N. 2005, http://arxiv.org/astro-ph/0511039
- Burrows et al. (2005b) Burrows,D. et al. 2005, Science, 309, 1833
- Cardelli et al. (1989) Cardelli, J. A., Clayton, G. C., & Mathis, J. S. 1989, ApJ, 345, 245
- Chevalier & Li (1999) Chevalier, R. A., & Li, Z.-Y. 1999, ApJ, 520, L29
- Cool et al. (2006) Cool, R. J., 2006, GCN Circ. 4695
- Dai & Lu (2002) Dai,Z.G.& Lu,T. 2002, ApJ, 565, L87
- de Ugarte Postigo et al. (2005) de Ugarte Postigo, A. et al. 2005, A&A, in press, preprint (astro-ph/0506544)
- Fukugita et al. (1996) Fukugita, M., et al. 1996, AJ, 111 Number 4, 1748
- Freedman & Waxman (2001) Freedman, D.L. & Waxman, E. 2001, ApJ, 547, 922
- Fynbo et al. (2006) Fynbo, P. U., Dai, X. et al. 2006, astro-ph/0602444
- Gehrels et al. (2004) Gehrels, N., et al. 2004, ApJ, 611, 1005
- Granot, Königl & Piran (2006) Granot, J., Königl, A. & Piran, T. 2006, submitted to MNRAS, astro-ph/0601056
- Guidorzi et al. (2005) Guidorzi, C., et al. 2005, ApJ, 630 Issue 2, L121
- Guidorzi et al. (2006) Guidorzi, C., et al. 2006, PASP, 118 N.840, 288
- Haislip et al. (2005) Haislip, J., et al. 2005, GCN Circ. 3915
- Haislip et al. (2006) Haislip, J., et al. 2006, GCN Circ. 4709
- Holland et al. (2003) Holland, S., et al. 2003, ApJ, 582, L5
- Huang et al. (2006) Huang, Y.F., Cheng, K.S., Gao, T.T. 2006, ApJ, 637, 873
- Ioka et al. (2005) Ioka,K., Toma,K., Yamazaki, R.& Nakamura, T. 2005, astro-ph/0511749
- Jakobsson et al. (2006) Jakobsson, P. et al. 2006, A&A, 447, 897
- Kobayashi & Sari (2000) Kobayashi, S.& Sari, R. 2000, ApJ, 542, 819
- Kobayashi & Zhang (2003) Kobayashi, S. & Zhang, B. 2003 ApJ, 582, L75
- Kumar & Piran (2000) Kumar, P. & Piran, T. 2000 ApJ, 532, 286
- Lazzati et al. (2002) Lazzati, D., Rossi, E., Covino, S., Ghisellini, G., & Malesani, D. 2002, A&A, 396, L5
- Malesani et al. (2006) Malesani, D. et al. 2006, GCN Circ. 4706
- Matheson et al. (2003) Matheson, T., et al. 2003, AJ, 125, 2291
- Morris et al. (2006) Morris, D. et al. 2006, GCN Circ. 4694
- Morris et al. (2006) Morris, D. et al. 2006, GCN Circ. 4764
- Nakar et al. (2003) Nakar, E., Piran, T., Granot, J. 2003, New Astronomy, 8, 495
- Nousek et al. (2006) Nousek,J.A. et. al. 2006, ApJ, in press, astro-ph/0508332
- Oates et al. (2006) Oates, S., Mundell, C.G. et al. 2006, MNRAS, in preparation
- Palmer et al. (2006) Palmer, D. et al. 2006, GCN Circ. 4697
- Ramirez-Ruiz et al. (2001) Ramirez-Ruiz, E., Dray,L.M., Madau,P. & Tout,C.A. 2001, MNRAS, 327, 829
- Rees et al. (1998) Rees,M. & Mészáros,P. 1998, ApJ, 496,L1
- Reichart et al. (2006) Reichart, D. et al. 2006, GCN Circ. 4768
- Roming et al. (2005) Roming, P. et al., 2005, astro-ph/0509273
- Rykoff et al. (2006) Rykoff, E. S., Mangano, V. et al. 2006, ApJ, 638 Issue 1, L5
- Romano et al. (2006) Romano, P. et al. 2006, A&A, submitted (astro-ph/0602497)
- Sari & Mészáros (2000) Sari,R. & Mészáros,P. 2000, ApJ, 535,L33
- Sari et al. (1998b) Sari,R., Piran,T. & Narayan,R. 1998, ApJ497, L17
- Schlegel et al. (1998) Schlegel, D. J., Finkbeiner, D. P., & Davis, M. 1998, ApJ, 500, 525
- Smith et al. (2002) Smith, J. A. et al. 2002, AJ, 123, 2121
- Stanek et al. (2006) Stanek, K. Z., Dai, X. et al. 2006, astro-ph/0602495
- Terada et al. (2006) Terada, H., et al. 2006, GCN Circ. 4716
- Vaughan et al. (2006) Vaughan, S. et al. 2006, ApJ, 638, 920
- Wozniak et al. (2006) Wozniak, P. R., Vestrand, J.A., Wren, J.A., White, R.R., Evans, S.M., Casperson, D. 2006, astro-ph/0602403
- Zhang et al. (2006) Zhang.B. et al. 2006, in preparation
| Filter | Epoch aaTime delay with respect to the GRB trigger time, UT. | Exposure | Magnitude | Flux |
|---|---|---|---|---|
| (s) | (s) | (mJy) | ||
| 319 | 10 | |||
| 341 | 10 | |||
| 363 | 10 | |||
| 415 | 10 | |||
| 437 | 10 | |||
| 459 | 10 | |||
| 574 | 30 | |||
| 785 | 120 | |||
| 885 | 120 | |||
| 1036 | 120 | |||
| 1169 | 120 | |||
| 1336 | 120 | |||
| 1487 | 120 | |||
| 1762 | 120 | |||
| 1921 | 120 | |||
| 2052 | 120 | |||
| 2185 | 120 | |||
| 2355 | 120 | |||
| 2487 | 120 | |||
| 2619 | 120 | |||
| 2807 | 120 | |||
| 2939 | 120 | |||
| 3071 | 120 | |||
| 3273 | 120 | |||
| 3405 | 120 | |||
| 3538 | 120 | |||
| 3670 | 120 |
.
| Segment | Comment | ||||
|---|---|---|---|---|---|
| (mJy) | (s) | ||||
| 0 | n.d. | n.d. | 0 | =early slope | |
| 1 | (fixed) | ||||
| 2 | (fixed) | (fixed) | (fixed) | ||
| 3 | big bump | ||||
| 4 | =post-bump slope | ||||
| 5 | density bump | ||||
| 6 | n.d. | n.d. | = slope after final break |
| Comments | ||||
|---|---|---|---|---|
| aaExcluding B (UVOT) value affected by HI absorption | bbAssumed fromXRT spectrum in . See text | |||
| ccCalculated from points interpolated according the additional bump hypothesis (model-dependent) | bbAssumed fromXRT spectrum in . See text | |||
| ddFrom back-extrapolations in (PAIRITIEL) and (MDM) | ||||
| eeSUBARU-IR & MDM-R |