3D Models for High Velocity Features in Type Ia Supernovae
Abstract
Spectral synthesis in 3-dimensional (3D) space for the earliest spectra of Type Ia supernovae (SNe Ia) is presented. In particular, the high velocity absorption features that are commonly seen at the earliest epochs ( days before maximum light) are investigated by means of a 3D Monte Carlo spectral synthesis code. The increasing number of early spectra available allows statistical study of the geometry of the ejecta. The observed diversity in strength of the high velocity features (HVFs) can be explained in terms of a “covering factor”, which represents the fraction of the projected photosphere that is concealed by high velocity material. Various geometrical models involving high velocity material with a clumpy structure or a thick torus can naturally account for the observed statistics of HVFs. HVFs may be formed by a combination of density and abundance enhancements. Such enhancements may be produced in the explosion itself or may be the result of interaction with circumstellar material or an accretion disk. Models with 1 or 2 blobs, as well as a thin torus or disk-like enhancement are unlikely as a standard situation.
1 Introduction
Type Ia supernovae (SNe Ia) have found use in cosmology after it has been established that the maximum luminosity can be calibrated via an empirical relation between it and the shape of the light curve (LC, Phillips 1993; Riess, Press & Kirshner 1996). The origin of this empirical relation is however not fully understood (e.g., Mazzali et al. 2001), mainly because of uncertainties regarding the properties of the explosion mechanism.
A one-parameter ordering scheme similar to the one found for the LC was also proposed for the spectra (Nugent et al. 1995). In this scheme temperature is the driving parameter characterizing the spectra. While this relation may apply near maximum, detailed observations of SNe Ia with extended early time spectral coverage indicate that SNe Ia with similar LCs may have different absorption line velocities. In particular, the absorptions of Si II 6355, S II 5640, Ca II H & K and Ca II IR triplet have been investigated by several authors (e.g., Patat et al. 1996; Hatano et al. 2000; Kotak et al. 2005; Benetti et al. 2005).
Simultaneously, the number of polarization observations has increased (SN 1996X, Wang et al. 1997; SN 1999by, Howell et al. 2001; SN 2001el, Wang et al. 2003; SN 2004dt, Wang et al. 2004) and it has become possible to infer asphericity by means of spectropolarimetry. These results suggest that some SNe Ia have a somewhat aspherical geometry of the photosphere (% for SN 2001el or % for SN 1999by, assuming a ellipsoidal geometry). Even larger degree of asphericity is inferred for the distribution of intermediate mass elements (at the level of %; see Wang et al. 2003). Multi-dimensional numerical simulations have also suggested that the explosion is aspherical, mainly owing to the nature of the deflagration flame in 3D numerical simulations (Reinecke, Hillebrandt & Niemeyer 2002; Gamezo et al. 2003; Röpke & Hillebrandt 2005).
Recently, high velocity features (HVFs) in the Ca II IR triplet have been the subject of interest: SN 1994D (Hatano et al. 1999), SN 1999ee (Mazzali et al. 2005a), SN 2000cx (Thomas et al. 2004), SN 2001el (Wang et al. 2003), SN 2003du (Gerardy et al. 2004), SN2005cg (Quimby et al. 2006). Here, HVFs are defined as absorptions with velocities much higher than the photospheric component, which has a typical velocity 15,000 km s-1 at week before maximum. HVFs are often seen detached from the photospheric component, at velocities of 17,000–29,000 km s-1. The above papers discuss the possible origin of HVFs including primordial metallicity (Lentz et al. 2000), a property of the explosion and interaction of the SN ejecta with circumstellar matter (CSM). Whatever their origin, understanding HVFs can cast light on the explosion mechanism.
Mazzali et al. (2005a) tried to fit the HVFs of SN 1999ee using abundance or density enhancements. Their results suggest that it is impossible to reproduce HVFs by abundance enhancement only and of additional material is required if only the density enhancement is assumed. Gerardy et al. (2004) and Quimby et al. (2006) discussed how HVFs may result from interaction with a CSM. They obtained good agreement for several features including Mg II, and found and of the CSM are needed for SN 2003du and SN 2005cg, respectively. It should be noted that the explosion model (i.e., abundance distribution and the density structure) and the way to introduce additional material are not identical with each other. Recently, Mazzali et al. (2005b) have shown that almost all SNe Ia have Ca II IR triplet HVFs at the earliest epochs. These HVFs have velocities ranging from 17,000 km s-1 to 29,000 km s-1 in different supernovae. The ubiquity of HVFs may indicate that they do not come from an extreme environment. Probably, the combination of different phenomena results in the observed HVFs.
The geometry of the ejecta has been studied in multi-dimensional space. Kasen et al. (2003) analyzed both spectroscopy and spectropolarimetry of SN 2001el and showed that both an aspherical photosphere and a single high velocity blob can reproduce the observations. Thomas et al. (2004) derived a similar geometry for the Ca II HVFs of SN 2000cx.
Although all previous studies performed modeling for each SN, no systematic study has been made of the 3D properties of the geometry. We present here synthetic spectra computed in 3D space for various geometries and show how HVFs are affected by different geometrical configurations and line-of-sight effects. The increasing number of early spectra available enables us to investigate the statistical properties of HVFs, and to constrain the geometry of the ejecta and possibly the nature of the explosion.
In §2 we discuss how HVFs are formed and suggest a possible parametrized description. In §3 we present the method of calculation for the spectra and our models. In §4 the results and some properties of 3D computations are presented. In §5 the probable geometries that can reproduce the observed trend are discussed. Finally, conclusions including considerations on the origin of the high velocity material and on the asphericity of the explosion are made in §6.
2 Properties of the HVFs
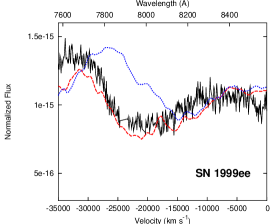
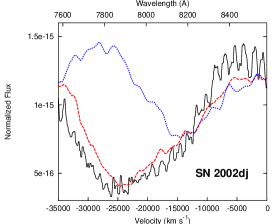
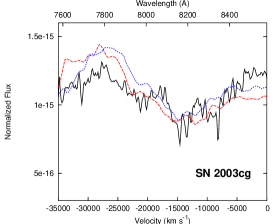
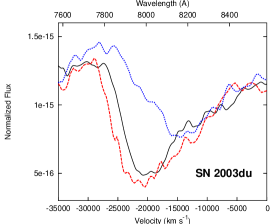
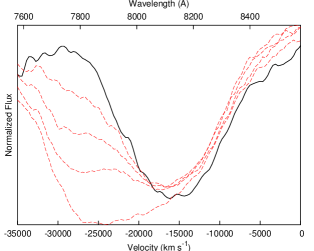
HVFs come in different forms. Figure 3D Models for High Velocity Features in Type Ia Supernovae shows the CaII IR triplet in the earliest spectra of SN 1999ee ( days before B maximum), SN 2002dj ( days), SN 2003cg ( days), and SN 2003du ( days). At that epoch, the photospheric velocity is km s-1. The photospheric component of the CaII IR triplet has km s-1 in all SNe Ia, as suggested by the data of Mazzali et al. (2005b). This is slightly higher than the photospheric velocity, since the CaII IR triplet is stronger than SiII or SII, and forms above the photosphere. However, the velocities of the absorption minima in SN 1999ee ( km s-1), SN 2002dj ( km s-1) and SN 2003du ( km s-1) are much higher, suggesting that these lines form well above the photosphere. Therefore the HVFs are expected to have a different origin that the photospheric absorption. Comparing SN 2002dj and SN 2003du, which were observed at the same epoch, it can be noticed that their HVFs have different strength and velocity range. The same is true for SN 1999ee and SN 2003du, although their spectra were not taken at exactly the same epoch. At very early epochs, even a small difference in epoch can strongly affect the strength of the photospheric component. However, judging from a number of early spectra we can safely conclude that there are real variations in the strength of the HVFs. Therefore we examine a parameterization of the properties of the HVFs based on their velocity range (), their strength () and on the strength of the photospheric component ().
We performed numerical tests to verify what governs the properties of the HVFs. The Monte Carlo SN spectrum synthesis code described in Mazzali & Lucy (1993), Lucy (1999) and Mazzali (2000) was used. The code computes a synthetic spectrum based on the luminosity, the position of the photosphere, the time since the explosion, the density structure and the abundance distribution. The density structure of the standard deflagration model W7 (Nomoto, Thieleman & Yokoi 1984) was used in all the calculations presented in this section. Photospheric velocity (km s-1), epoch (8 days since the explosion assuming a risetime of 19 days) and luminosity (erg s-1) were fixed for simplicity.
First we consider the case where and are fixed and parameterize through the line optical depth of the CaII IR triplet. We assume that the high velocity region lies at km s-1. In this region, the line optical depth is imposed irrespective of the value computed consistently with the W7 structure in order to simplify the investigation of the behavior of HVFs. For example, if line optical depth is taken as , about half the photons that come into resonance with the CaII IR triplet are scattered. Figure 3D Models for High Velocity Features in Type Ia Supernovae shows HVFs with various line optical depths . With this approximation the depth of the HVFs depends almost linearly on . The origin of the observed diversity in strength is investigated in 3-dimensional space in §3 and §4.
Next we show how the strength of the photospheric component affects the absorption feature. Here is parameterized through the abundance of Ca. In the calculation, a homogeneous abundance distribution is used, which is a reasonable assumption because the region used in the computation is only km s-1. Figure 3D Models for High Velocity Features in Type Ia Supernovae shows the CaII IR triplet with various strengths of the photospheric component. The mass fraction of Ca is , and 0.04, respectively. The photospheric absorption depth does not change linear with the abundance, and the line becomes saturated if the abundance is more than %. Since in this calculation the line optical depth at high velocity is fixed as and the velocity separation is large, the HVFs are not affected by the photospheric component.
Using only the abundance of Ca to change the strength of the photospheric component is not completely realistic because the line strength also depends strongly on temperature and ionization state. Ca is mostly CaIII at the typical temperature of SNe Ia before maximum (K) and only a small fraction is CaII and CaIV. The strength of the CaII IR triplet is proportional to temperature because of the behavior of the ionization. We tested models with different luminosities, which yield different temperature structures. We found that even with the highest Ca abundance , when the luminosity is increased by a factor of , the strength of the CaII IR triplet becomes weaker than in the original model with the lowest Ca abundance, . An inverse correlation between the strength of the photospheric component and the luminosity at these early epochs might therefore be expected. To verify this, more observations are needed and it is necessary to fit these individually to determine the exact photospheric velocity and temperature. This is beyond the scope of this work, and will be the subject of a separate investigation. (M. Tanaka et al., in preparation).
The results of the tests we performed by changing and (Figures 3D Models for High Velocity Features in Type Ia Supernovae and 3D Models for High Velocity Features in Type Ia Supernovae) show clearly that changing these two parameters is not enough to reproduce all the observed HVFs. As seen between SN 2002dj and SN 2003du in Figure 3D Models for High Velocity Features in Type Ia Supernovae (and see Figure 4 in Quimby et al. 2006), the width of the high velocity absorption is not identical among SNe that have a similar depth of the HVFs. No combination of and , however, can account for such a difference. Therefore we conclude that the additional parameter is also needed. One might think that this is because of our assumption of spherical symmetry. However, we obtain the same results in 3D geometry (§4). Figure 1 shows how the three parameters ( and ) work. Their combination determines the depth and shape of the absorption and the position of the absorption minimum. Although the luminosity and the photospheric velocity are not fine-tuned, the shape of the absorption feature is reproduced well.
The numerical tests presented here may be somewhat unrealistic because we assumed a detached spherical shell that is optically thick to the the CaII line and it is probably more realistic to consider 3D structures. The explosion may be aspherical and has fragmentations (yielding a clumpy structure), or interaction between the SN ejecta and a circumstellar disk may occur (yielding a torus-like structure). In the next section, we use 3D models to see what the three parameters used in this section (i.e., , and ) physically mean.
3 Method and Models in 3D space
3.1 3D Monte Carlo Code
To investigate 3D effects on the HVFs, synthetic spectra are calculated assuming various geometries (§3.2). We have developed a 3-dimensional Monte Carlo radiative transfer code based on the 1D Monte Carlo code described in Mazzali & Lucy (1993), Lucy (1999), and Mazzali (2000). The code assumes the Sobolev approximation and a sharply defined photosphere above which there is no energy deposition. Spherical coordinates are used in the code in order to treat the photosphere precisely. The number of meshes depends on the model and is typically for and , respectively. The path of the energy packets is traced in 3D space, and the effect of back scattering into the photosphere is included. Line treatment is free from the approximation of resonance scattering, i.e., photon branching is considered correctly as outlined by Lucy (1999). The free parameters are the luminosity , the photospheric velocity and the epoch since the explosion , all of which are defined as in the 1D code. Though angle dependent and can be used in the code, here we assume them to be uniform for simplicity. We again assume km s-1, days since the explosion and erg s-1as typical values for the earliest spectra of SNe Ia. With these parameters, the temperature structure, excitation and ionization are computed in all zones using a modified nebular approximation (Mazzali & Lucy 1993). This assumes that there is no net exchange of energy between matter and radiation. Photon flux is collected by recording energy packets at the outer boundaries of the ejecta and is binned into a solid angle mesh. Since the path of each packet is affected by the density and temperature structure, the emergent spectrum depends on the orientation.
3.2 Models
Our models are based on the spherical deflagration model W7 (Nomoto et al. 1984). We introduced additional material in the outer layers of the ejecta to produce HVFs. We are not concerned here with the origin of this material, which may come from fluctuations of the explosion or from interaction with CSM or an accretion disk. Abundance enhancements are not considered because they have been shown not to be suitable for reproducing HVFs (Mazzali et al. 2005a). The velocity range and the degree of density enhancement are determined by fitting one of the strongest CaII HVF, that of SN 2002dj, with the 1D code. As a result, of material at km s-1 is added in a shell.
We fixed this degree of density enhancement in our 3D computations. We used a density enhancement rather than an artificial line strength, which was used in the previous section, because we want to explore the cause of HVFs. In fact, a spherical density enhancement has the same effect on the CaII IR triplet profile as the artificial line strength. However, other lines, such as SiII 6355, are also affected when using a density enhancement. If the observed behavior of both the CaII IR triplet and SiII 6355 is reproduced consistently with a density enhancement, we may conclude that HVFs are due to density enhancements. Additionally, the mass invoked in HVFs should be reduced in 3D space. In Mazzali et al. (2005a), a large amount of material ( in the case of density enhancement only) was required to produce HVFs, and this was a serious concern in the hypothesis that HVFs come from either the explosion or CSM interaction. Although Gerardy et al. (2004) and Quimby et al. (2006) found only and are enough for the HVF of SN 2003du and SN 2005cg, respectively, the HVF that has a higher velocity and a deeper absorption has been observed like SN 2002dj (see Fig. 3D Models for High Velocity Features in Type Ia Supernovae). We will give an estimate of the amount of material needed in a 3D calculation.
We mapped the density enhancement into 3D space conserving the radial velocity range and the degree of enhancement derived in the 1D calculations. We tested various morphologies that may be realistic, including one or two large blobs, a small number of discrete blobs, a crowded clumpy structure, and tori of various opening angles.
4 Results
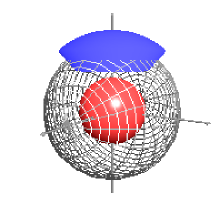
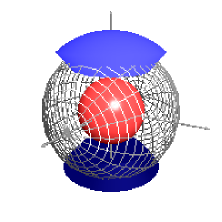
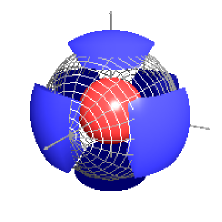
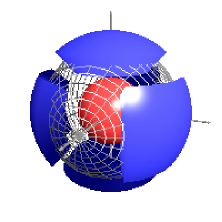
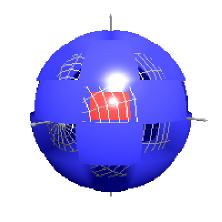
First we describe the general behavior of HVFs in 3D models taking a model with a large blob (Model B1) as an example. Figure 2 shows the geometry (left) and the synthetic line profile (right). In the left panel, the red sphere shows the photosphere and the blue region shows the density enhancement. The depth of HVFs in the synthetic spectra is different for different lines-of-sight. Seen on the z-axis, which is defined as the direction of the blob, the absorption at high velocity is deepest. If we move toward the equatorial plane, the high velocity absorption becomes shallower and shallower and it disappears when the line-of-sight reaches the edge of the blob. Note that having the blob on one side has only a small effect on the emission profile, because the volume occupied by the blob is small. The range of profiles in the right panel of Figure 2 is qualitatively very similar to Figure 3D Models for High Velocity Features in Type Ia Supernovae, which shows that our 1D parametrization captures the role of the blobs.If the blob is optically thick, the depth of the HVFs is determined by the fraction of the projected photosphere that is concealed by the dense blob for each line-of-sight. We define as the “covering factor” and denote it as .
Figure 3D Models for High Velocity Features in Type Ia Supernovae shows that the HVFs obtained using different covering factors in 3D models resemble those obtained with 1D synthetic spectra for different values of . The values are not exactly the same because our 3D blobs are not infinitely optically thick. In fact, given a typical optical depth in the blobs, one expects a relation , where is the line optical depth introduced in the 1D computation. Thus if . Since has a finite value, , which is smaller than the value in an infinitely thick case. Figure 3D Models for High Velocity Features in Type Ia Supernovae clearly indicates this. Comparing the value of and that yield similar spectra shows that the effective of the 3D blob decreases with increasing angle. This is probably because the average length of a segment crossing the blob is smaller for larger angles, as there are more grazing trajectories.
If such a blob exists, the variation of the strength of the HVFs () can be reproduced along various lines-of-sight without introducing unknown parameters such as line optical depth in §2. We roughly classify the HVFs by their strength into three groups, strong HVFs (), medium HVFs () and weak HVFs (). For example, SN 2002dj and SN 2003du have “strong” HVFs, SN 1999ee has a “medium” HVF, and SN 2003cg is “weak” (see Fig 3D Models for High Velocity Features in Type Ia Supernovae).
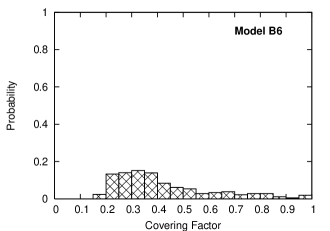
However, we have to consider the statistical properties of HVFs. Recent observations suggest that a considerable fraction of the earliest spectra have high velocity absorption. On the contrary, Model B1 suggests that strong HVF will be observed only % in all SNe. Figure 3D Models for High Velocity Features in Type Ia Supernovae is a histogram of the covering factor . It clearly indicates that only very few orientations can produce strong HVFs and about 90% of the observations () should show only the photospheric absorption. Figure 3D Models for High Velocity Features in Type Ia Supernovae shows the observed frequency of the HVF’s strength made from Mazzali et al. (2005a and 2005b) by distributing 8 SNe into 4 bins. The observed depth of the HVF is converted to the covering factor thorough the numerical fit as in Figure 4. It should be noted that the number of the sample is not enough in Figure 8 but the ubiquity of the HVFs is not overthrown even if we consider other SNe (Mazzali et al. 2005b). The clear differences between the histogram of Model B1 (Fig. 3D Models for High Velocity Features in Type Ia Supernovae) and the observation (Fig. 3D Models for High Velocity Features in Type Ia Supernovae) are seen at (too much in Model B1) and (too small in Model B1). Although it is of course not necessarily required that all observations are reproduced with a single geometry, a general geometry may be inferred if a certain model can reproduce the observed trend. We investigate several geometrical models in the following subsections and compare the distribution of synthetic properties to the observed trend.
4.1 Blob Models
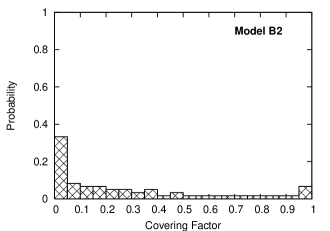
We showed that a model with one blob is unlikely as a general geometry of SNe Ia. We therefore vary both the size of the blobs and their number. We show the expected statistical properties of each model by means of the distribution of covering factors, since we have shown that there is a direct correspondence between and HVF strength. Figure 3 shows the distribution of covering factors in a model with two blobs (Model B2). As expected, the fraction of lines of sight with large covering factor doubles and the fraction of small factors decreases. This is however still not consistent with the fact that most spectra have high velocity absorption. Although we tested various blob sizes, most lines-of-sight have because of the large space between the two blobs. We then increase the number of blobs adjusting their size so that the photosphere is not completely covered.
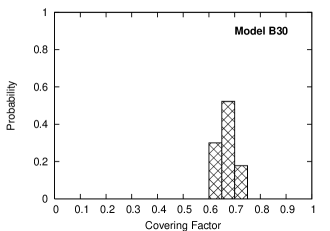
Next we consider a case with several blobs. Figure 4 shows the distribution of covering factors for a model with 6 blobs with opening angle degrees (top panel; Model B6), a model with 5 blobs of degrees (middle panel; Model B5) and a model with several blobs of degrees (bottom panel; Model B30). From top to bottom, the space between the blobs becomes smaller. Synthetic spectra show that the correlation between and the depth of the HVF remains even when the blobs are crowded as in Model B30. Model B6 still has a large space between the blobs, making the fraction of small large. In addition, this model is very unlikely to produce the deep absorption required to reproduce the objects like SN 2002dj and SN 2003du (see, Fig 3D Models for High Velocity Features in Type Ia Supernovae and Fig 1), which needs .
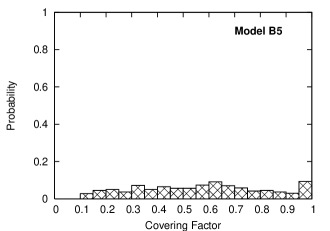
Model B5 (Fig 4, middle) has smaller intervals between the blobs and a large dispersion in the covering factor. This model has a 15% probability of showing a deep absorption () while the fraction of lower is smaller than in any of the models discussed before. The fact that HVFs exist in almost all early spectra may suggest that a clumpy structure like Model B5 is a possible average geometry.
If we cram more blobs (Model B30; Fig 4, bottom), the effect of different lines-of-sight is averaged and the variation disappears. This result is similar to that of the 1D test with . Therefore we can conclude that this geometry is not typical of the majority of SNe Ia, although it may exist.
4.2 Torus Models
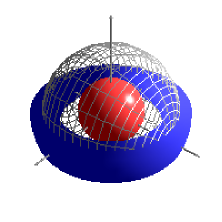
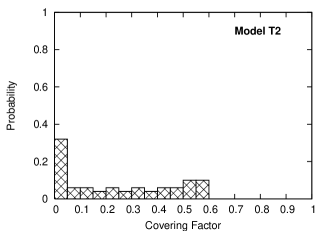
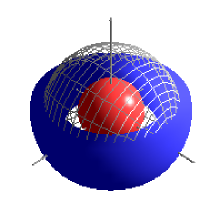
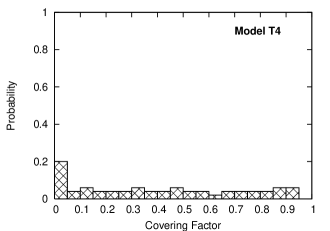
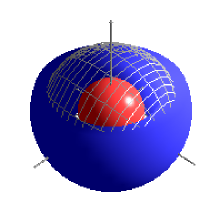
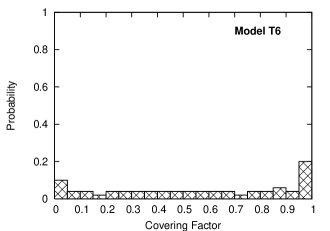
We distinguish a model that has a torus-like density enhancement from blob models because the origin of the enhancement is expected to be interaction with CSM or an accretion disk in this case. The main problem with the hypothesis that HVFs come from CSM interaction is the fact that extremely high mass loss rates are required to place the material just outside the explosion. One expects that this may be solved if the progenitor WD is surrounded by an accretion disk and the ejecta collide with the disk, leading to density enhancements on the plane of the disk. Figure 5 shows the distribution of covering factors of models with torus-like enhancements (Model T2, T4 and T6). These models have a disk-like enhanced region with opening angles of and , respectively. As shown in the left panels of Figure 5, the disk has a thickness comparable to the diameter of the photosphere.
In Model T2 the disk is too thin for the covering factor ever to become large (top panels in Fig. 5). If the thickness increases to (Model T4; middle panels in Fig. 5), the fraction of “weak” HVFs decreases while those of “strong” and “middle” HVFs increase. If the the disk is thick enough for the photosphere to be totally concealed, the fraction of “strong” HVFs increases (Model T6; bottom panels in Fig. 5) and the distribution of covering factors becomes broad. Only Model T6 may produce the observed distribution of HVF strength.
This implies that a very thick disk is required, with thickness comparable to the diameter of the WD. The material in the disk should be swept by the SN ejecta in a radial direction leaving an imprint of the disk’s angular size after the explosion. While this may be a realistic model, the absence of hydrogen lines in the early spectra remains the strongest argument against the disk origin of the HVFs. This problem can be overcome by assuming low temperature () at the shocked ejecta (Gerardy et al. 2004), where the hydrogen lines are less active than metal lines. And see the consideration made in Mazzali et al. (2005a) on the role of hydrogen in making the CaII IR triplet broad. They estimate M(H) in spherical symmetry.
5 Discussion
The strength of the HVFs () was parameterized via the line optical depth of the CaII IR triplet in §2. The observed range of HVFs can be reproduced using only geometrical effects if we assume that the optically thick region distributes discretely. The covering factor that represents how the photosphere is concealed by the optically thick region acts exactly as in §2. Among the various geometries discussed in the previous section, Models B1 and B2 have a very large fraction of lines-of-sight with , which makes almost no HVFs. Since observations suggest that a considerable fraction of the earliest spectra show HVFs, these models can be ruled out as a standard configuration.
As the interval between the blobs becomes smaller, the fraction of lines-of-sight with decreases (e.g., from Model B6 to Model B30). However, too crowded structures like Model B30 do not give rise to a variation in the covering factor and so the strength of HVF is constant. Model B5 has a wide range of covering factors from to . If such a structure is formed from the explosion, it can explain the observed variety naturally.
It should be noted that models with a hole can be tuned to give the observed distribution of HVF more easily than models with “blobs” by changing the covering factor, i.e., the size of the hole. How such geometries might be produced is however unclear, as they still require a dense high velocity region and a line of sight that is never far from the hole, because otherwise most SNe would show strong HVFs.
A torus model may reproduce the observed distribution of HVF if the disk is geometrically thick (). Such a thick disk-like enhancement could be produced if the accretion disk is thick enough to surround the WD before the explosion. The opening angle of the accretion disk is likely to be reflected on the angular size of a density enhancement.
A torus in Model T2 or T4 is so thin that it provides a large fraction of “weak” features, which are not frequently observed. However, it may be possible to reduce the fraction of if the interaction with CSM resulting from spherical or bipolar WD wind occurs. Although many additional parameters should be introduced to investigate the possibility of this scenario, this scenario seems to work qualitatively.
When the optically thick region at high velocity is introduced as a density enhancement, other features are also affected. The SiII 6355 line is the most notable line, and its behavior has been thoroughly examined (e.g., Benetti et al. 2005). Figure 3D Models for High Velocity Features in Type Ia Supernovae shows spectra around SiII 6355. If the photosphere is totally covered by dense blobs, the absorption minimum becomes km s-1. Such high velocity features have not been observed. Also, the velocity of SiII 6355 is not always correlated with that of the CaII IR triplet in the observed spectra. For example, SN 2002bo has a higher SiII 6355 velocity km s-1(at -8 days after the maximum) than that of SN SN 2003kf km s-1(at -9 days) but the CaII HVF of SN 2002bo (km s-1) is slower than that of SN 2003kf (km s-1). Therefore the assumption that HVFs in the CaII IR triplet are due only to density enhancements may not be correct. However there are some SNe that have an extended blue wing in SiII 6355. This may indicate some degree of density enhancement also occurs. The combination of density enhancement and abundance enhancement may provide a proper correlation. Such a study, however, is beyond the scope of this work. It is worth noting that the mass of additional material is reduced from in the spherical case to in Models B5, B6 and B30.
The velocity range of HVFs () is found to be the same in all the models and all the lines-of-sight as long as the position of the enhancements is fixed. If the covering factor is identical, one might expect that the position of the absorption minimum depends on the line-of-sight. However, we found that this effect is very slight. The strength of the photospheric absorption is not correlated with the covering factor and it is not affected even if the line-of-sight is varied.
6 Conclusions
We tested the properties of HVFs of CaII IR triplet through 1D and 3D modeling. Parameterized 1D simulations were used to extract the main features that determine the HVF. We defined three parameters that govern the HVFs. These are the strength of the HVF , its velocity range , and the strength of the photospheric component . As for , it was shown that geometrical effects on models based on high velocity blobs or a thick torus can provide enough variety to cover all the observations. On the contrary, is not affected by line-of-sight effects. Therefore we speculate there may be a number of blobs that have different velocities. This might be possible if the WD rotates and the clumpy structure formed by the deflagration flame has different properties depending on direction. Such a variety is not produced in a torus model. However, it may be possible that different disks lead to different enhancements from SN to SN since the degree of density enhancement and its velocity range depend strongly on the density, the total mass and radial extent of the disk.
The strength of the photospheric absorption () may be influenced by the temperature and the abundance. Although we changed this value by changing the abundance in this paper, it should be studied whether there is any correlation between the temperature and . This requires knowing the exact temperature and photospheric velocity by fitting observed spectra, which will be the subject of future work (M. Tanaka et al. in preparation).
The models that best explain the statistics of the observed strength of the HVFs are a blob model (B5) with blobs of and a thick torus of opening angle . While a torus model sounds appealing, the main argument against it is the absence of hydrogen lines (but see Gerardy et al. 2004, and Mazzali et al. 2005a) and the variation of the HVF velocity. A blob model may result from the explosion if the mushroom structure of the deflagration is not completely washed away in a delayed detonation (Gamezo et al. 2005). Although this does not mean that all the SNe have a single geometry, the average structure may have a distribution of high velocity material similar to that of Model B5. To verify this conclusion, more early phase observations before maximum are needed. A statistical study can constrain the structure more accurately.
Model B5 is different from the 3D structure that was obtained for SN 2001el by Kasen et al. (2003). Their model has one large blob and an aspherical photosphere, and is able to reproduce the observed polarization flux. Our results suggest that such a geometry cannot be standard (see Model B1 in §4). It is completely unknown whether only polarized SNe Ia have such a geometry, consisting of one or two blobs in the outermost region. Rotation of the WD may lead to such a configuration. Although a statistical study of polarization is not available yet, it is potentially useful to verify the geometry, including the abundance distribution. In addition, the statistical study of polarization may be able to distinguish the torus models and the blob models because the torus-like enhancement tend to produce a large polarization (Kasen et al. 2003).
Detailed hydrodynamic calculations of 3D deflagration flames suffer from shortage of high velocity material. It is unknown whether such a result indicates our ignorance about the deflagration flame or the existence of a transition from a deflagration to a detonation. It is therefore quite important to define a suitable explosion mechanism from the observational data. This will be achieved via a statistical study presented in this paper when larger number of early spectra are available. The importance of early observations of SNe Ia cannot be understated.
References
- (1) Benetti, S., Cappellaro, E., Mazzali, P.A., Turatto, M., Altavilla, G., Bufano, F., Elias-Rosa, N., Kotak, R., Pignata, G., Salvo, M., & Stanishev, V. 2005, ApJ, 623, 1011
- (2) Gamezo, V.N., Khokhlov, A., Oran, E.S., Chtchelkanova, A.Y., & Rosenberg, R.O. 2003, Science, 299, 77
- (3) Gamezo, V.N., Khokhlov, A. M., & Oran, E. S. 2005, ApJ, 623, 337
- (4) Gerardy, C. L., Höflich, P., Fesen, R. A., Marion, G. H., Nomoto, K., Quimby, R., Schaefer, B. E., Wang, L., & Wheeler, J. C. 2004, ApJ, 607, 391
- (5) Hatano, K., Branch, D., Fisher, A., Baron, E., & Filippenko, A.V. 1999, ApJ, 525, 881
- (6) Hatano, K., Branch, D., Lentz, E.J., Baron, E., Filippenko, A.V., & Garnavich, P.M. 2000, ApJ, 543, L49
- (7) Howell, D.A., Höflich, P., Wang, L., & Wheeler, J.C. 2001, ApJ, 556, 302
- (8) Kasen, D., Nugent, P., Wang, L., Howell, D. A., Wheeler, J. C., Höflich, P., Baade, D., Baron, E., & Hauschildt, P. H. 2003, ApJ, 593, 788
- (9) Kotak, R., Meikle, W.P.S., Pignata, G., Stehle, M., Smartt, S.J., Benetti, S., Hillebrandt, W., Lennon, D.J., Mazzali, P.A., Patat, F., & Turatto, M. 2005, A& A, 436, 1021
- (10) Lentz, E. J., Baron, E., Branch, D., Hauschildt, P. H., & Nugent, P. E. 2000, ApJ, 530, 966
- (11) Lucy, L.B. 1999, A&A, 345, 211
- (12) Mazzali, P.A., & Lucy, L.B. 1993, A&A, 279, 447
- (13) Mazzali, P.A. 2000, A&A, 363, 705
- (14) Mazzali, P.A., Nomoto, K., Cappellaro, E., Nakamura, T., Umeda, H, & Iwamoto, K., 2001, ApJ 547, 988
- (15) Mazzali, P.A., Benetti, S., Stehle, M., Branch, D., Deng, J., Maeda, K., Nomoto, K., & Hamuy, M. 2005a, MNRAS, 357, 200
- (16) Mazzali, P.A., Benetti, S., Altavilla, G., Blanc, G., Cappellaro, E., Elias-Rosa, N., Garavini, G., Goobar, A., Harutyunyan, A., Kotak, R., Leibundgut, B., Lundqvist, P., Mattila, S., Mendez, J., Nobili, S., Pain, R., Pastorello, A., Patat, F., Pignata, G., Podsiadlowski, Ph., Ruiz-Lapuente, P., Salvo, M., Schmidt, B.P., Sollerman, J., Stanishev, V., Stehle, M., Tout, C., Turatto, M., & Hillebrandt, W. 2005b, ApJ, 623, L37
- (17) Nomoto, K., Thielemann, F.-K., & Yokoi, K. 1984, ApJ, 286, 644
- (18) Nugent, P., Phillips, M., Baron, E., Branch, D., & Hauschildt, P. 1995, ApJ, 455, L147
- (19) Patat, F., Benetti, S., Cappellaro, E., Dazinger, I. J., Della Valle, M., Mazzali, P.A., & Turatto, M. 1996, MNRAS, 278, 111
- (20) Phillips, M.M. 1993, ApJ, 413, L105
- (21) Quimby, R., Hoeflich, P., Kannappan S.J., Rykoff E., Rujopakarn W., Akerlof C.W., Gerardy C.L., & Wheeler J.C. 2006, ApJ, 636, 400
- (22) Reinecke, M., Hillebrandt, W., & Niemeyer, J. C., 2002, A& A, 391, 1167
- (23) Riess, A. G., Press, W. H., & Kirshner, R. P. 1996, ApJ, 473, 88
- (24) Röpke, F., K., & Hillebrandt, W. 2005, A& A, 431, 635
- (25) Thomas, R. C., Branch, D., Baron, E., Nomoto, K., Li, W., & Filippenko, A. V. 2004, ApJ, 601, 1019
- (26) Wang, L., Wheeler, J.G., & Höflich, P. 1997, ApJ, 476, L27
- (27) Wang, L., Baade, D., Höflich, P., Khokhlov, A., Wheeler, J.C., Kasen, D., Nugent, P.E., Perlmutter, S., Fransson, C., & Lundqvist, P. 2003, ApJ, 591, 1110
- (28) Wang, L., Baade, D., Höflich, P., Kawabata, K., Khokhlov, A., Nomoto, K., & Patat, F. 2004, submitted (astro-ph/0409593)
![[Uncaptioned image]](/html/astro-ph/0603184/assets/x1.png)
Line profiles of the CaII IR triplet in the early spectra of 4 SNe. Shown are SN 1999ee (9 days before maximum, Hamuy et al. 2002, red); SN 2002dj 11 days before maximum, Kotak et al. 2005, green); SN 2003cg (8 days before maximum, Elias-Rosa et al., in preparation, blue); and SN 2003du (11 days before maximum, Stanishev et al., in preparation, pink). The flux was adjusted to have the same continuum flux at Å by multiplying by a constant. While the HVFs in SN 2002dj and SN 2003du are deep, that of SN 1999ee is weak. SN 2003cg has almost no high velocity absorption.
![[Uncaptioned image]](/html/astro-ph/0603184/assets/x2.png)
The effect of a variation in the strength of high velocity absorption on the CaII IR triplet profile. The line optical depth is parametrized as . The various profiles, going from deeper to shallower absorption, have and , respectively, at km s-1. A variation of these parameters does not affect the photospheric absorption at all.
![[Uncaptioned image]](/html/astro-ph/0603184/assets/x3.png)
The effect of a variation in the strength of photospheric absorption on the CaII IR triplet profile. The strength is changed through the abundance of Ca. The various profiles, going from deeper to shallower, correspond to a mass fraction and , respectively. The high velocity absorption is not affected at all because we fix the value of and the velocity separation between the photospheric component and the HVF is too large.
 |
 |
 |
 |
 |
 |
![[Uncaptioned image]](/html/astro-ph/0603184/assets/x10.png)
3D synthetic spectra computed from Model B1 (red) compared with the 1D results of Figure 2 (blue). While the 1D results have been obtained for shells with different opacities, the 3D spectra correspond to the same model viewed from different angles, and therefore differ by the covering factor . The black line is the model without high velocity enhancement, or in 3D. The 1D spectra have and , from deeper to shallower. The 3D spectra have covering factor and , from deeper to shallower. 1D and 3D results are related. The difference between the values of and comes from the fact that the blob in the 3D model is not infinitely thick (see §4).
![[Uncaptioned image]](/html/astro-ph/0603184/assets/x11.png)
Probability distribution of the covering factor in Model B1. The horizontal axis shows the covering factor and the vertical axis shows the frequency of the covering factor if we see this model from various lines-of-sight.
![[Uncaptioned image]](/html/astro-ph/0603184/assets/x12.png)
Probability distribution of the observed HVFs. 8 SNe from Mazzali et al. (2005 and 2005b) are distributed to 4 bins by fitting the depth of the HVFs. Note the number of the bin is not identical with the other histogram of the covering factor .
 |
 |
 |
 |
 |
 |
 |
 |
 |
 |
 |
 |
 |
 |
![[Uncaptioned image]](/html/astro-ph/0603184/assets/x27.png)
Synthetic spectra around SiII 6355. The thick line is a 1D spectrum without any enhancement. Dashed lines are 3D spectra with covering factor and from deeper to shallower. If the photosphere is totally hidden (), the feature forms at a high velocity that has never been observed in any SN.