X-RAY EMITTING YOUNG STARS IN THE CARINA NEBULA
Abstract
We present a multiwavelength study of the central part of the Carina Nebula, including Trumpler 16 and part of Trumpler 14. Analysis of the Chandra X-ray Observatory archival data led to the identification of nearly 450 X-ray sources. These were then cross-identified with optical photometric and spectroscopic information available from literature, and with deep near-infrared () imaging observations. A total of 38 known OB stars are found to be X-ray emitters. All the O stars and early B stars show the nominal relation between the X-ray and bolometric luminosities, . A few mid- to late-type B stars are found to be associated with X-ray emission, likely attributable to T Tauri companions. We discovered 17 OB star candidates which suffer large extinction in the optical wavebands. Some 300 sources have X-ray and infrared characteristics of late-type pre-main sequence stars. Our sample presents the most comprehensive census of the young stellar population in the Carina Nebula and will be useful for the study of the star-formation history of this massive star-forming region. We also report the finding of a compact () group of 7 X-ray sources, all of which highly reddened in near-infrared and most X-ray bright. The group is spatially coincident with the dark ’V’ shaped dust lane bisecting the Carina Nebula, and may be part of an embedded association. The distribution of the young stellar groups surrounding the H II region associated with Trumpler 16 is consistent with a triggering process of star formation by the collect-and-collapse scenario.
1 INTRODUCTION
Massive stars have a profound influence on neighboring molecular clouds. On the one hand, the powerful stellar radiation and wind from even a single such star would sweep away nearby clouds and henceforth prevent subsequent star formation. On the other hand, the massive star may provide “just the touch” to prompt the collapse of a molecular cloud which otherwise may not contract spontaneously. Whether massive stars play a destructive or a promotive role in cluster formation conceivably depends on the availability of cloud material within the range of action, though the details have not been fully understood. If massive stars by and large suppress star formation, low-mass stars could exist in the immediate surroundings only if the low-mass stars predated massive star formation. In both the Orion and Lacerta OB associations, Lee et al. (2005) and Lee & Chen (2005) have found an evidence of triggered star formation by massive stars. The UV photons from massive stars appear to have ionized adjacent molecular clouds and the implosive pressure then compresses the clouds to form next-generation stars of various masses, often in groups, with high star formation efficiencies. The process is self-sustaining and an entire OB association may be formed as a result.
The Carina Nebula, also known as NGC 3372, is a remarkable star-forming region where the most massive stars known in the Milky-Way Galaxy co-exist. The Nebula, which occupies about 4 square degree area on the sky, contains at least a dozen known star clusters (Feinstein, 1995). The clusters with photometric and spectroscopic data are : Bochum (Bo) 10 and 11, Trumpler (Tr) 14, 15 and 16, Collinder (Cr) 228, NGC 3293 and NGC 3324. Tr 14 and Tr 16 are the most populous and youngest star clusters and located in the central region of the Nebula. The distance modulus for Tr 16, quoted from the literature, ranges from 11.8 (Levato et al., 1981) to 12.55 (Massey & Johnson, 1993, MJ93 hereafter) and for Tr 14, from 12.20 (Feinstein, 1983) to 12.99 (Morrell et al., 1988). Walborn (1995) derived a distance of kpc for Tr 16 using . Crowther et al. (1995) derived a distance of kpc for Tr 14. Walborn (1973) and Morrell et al. (1988) concluded that the two clusters are at slightly different distance, whereas Turner & Moffat (1980) and Massey & Johnson (1993) concluded the two clusters are at the same distance. A distance of 2.5 kpc is adopted for our study. All the clusters listed above, contain a total of 64 known O-type stars, the largest number for any region in the Milky Way (Feinstein, 1995). Tr 14 and Tr 16 include six exceedingly rare main-sequence O3 stars. The presence of these very young stars indicates that the two clusters are extremely young. The two clusters also contain two Wolf-Rayet stars which are believed to be evolved from even more massive progenitors than the O3 stars (MJ93). Furthermore Tr 16 is the parent cluster to the famous luminous blue variable (LBV), Carinae, which is arguably the most massive star of our Galaxy (MJ93). With such a plethora of unusually massive stars, the Carina Nebula is a unique laboratory to study the massive star formation process, and the interplay among massive stars, interstellar media and low-mass star formation.
In recent years, X-ray surveys have been very successful in defining the pre-main sequence population of young star clusters (Feigelson et al., 2002). X-ray emission has been detected from deeply embedded class I Young Stellar Objects (YSOs) to low-mass pre-main sequence (PMS) stars of T Tauri types, and intermediate-mass pre-main sequence stars of Herbig Ae/Be types to the zero-age main-sequence stars. For late type main-sequence stars, starting from late A to K and M dwarfs, the X rays are produced in the very high temperature gas in the corona, which is thought to be heated due to the dynamo magnetic fields (Maggio et al., 1987). Massive stars, of O and early B types, on the other hand emit X rays which are produced in the shocks due to hydrodynamic instabilities in their radiatively driven strong stellar winds (Lucy, 1982). The X-ray emission from the classical T Tauri stars (CTTSs) or weak-lined T Tauri stars (WTTSs) is believed to be thermal emission from the gas rapidly heated to temperatures of the order K due to magnetic reconnection events similar to the solar magnetic flares, but elevated by a factor of – (Feigelson & Montmerle, 1999). A recent work by Preibisch et al. (2005) presents the correlation of the X-ray properties with different stellar parameters, for a nearly complete sample of late-type PMS stars in the Orion Nebula Cluster. They concluded that the origin of X-ray emission in T Tauri stars seems to be either a turbulent dynamo working in stellar convection zone, or a solar like - dynamo at the base of the convection zone if T Tauri stars are not fully convective. Among the existing methods to identify the young stellar populations in a young star cluster, the use of X-ray emission, which is nearly independent of the amount of circumstellar material around the young stars (Feigelson et al., 2002), is the least biased, especially in selection of weak-lined T Tauri stars which lack the standard signatures of pre-main sequence stars such as the infrared excess or strong emission lines.
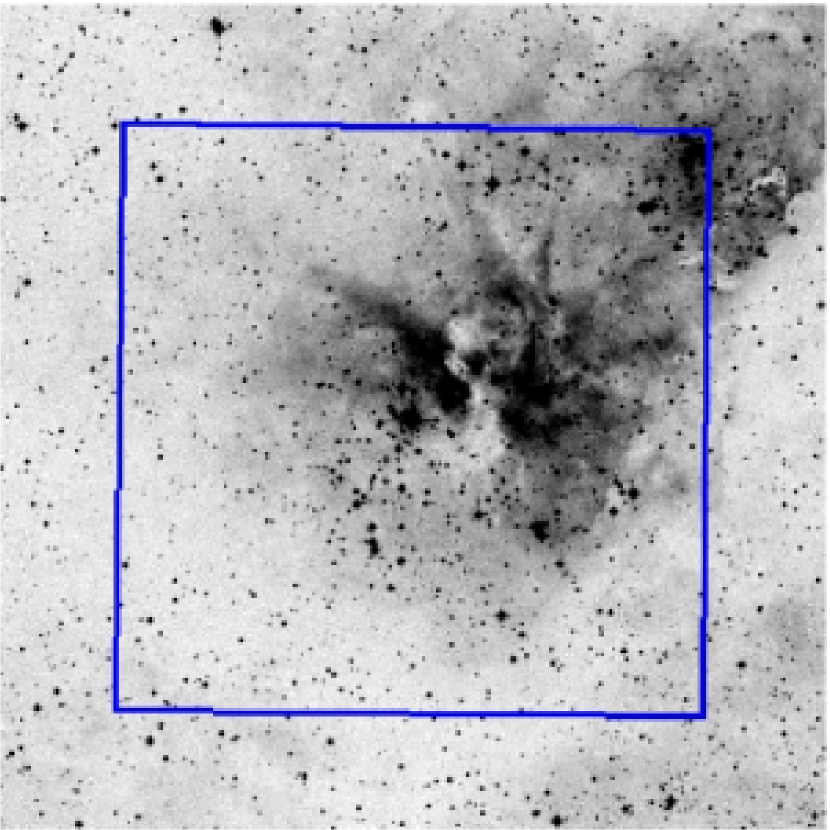
In this paper we used the Chandra X-ray Observatory archival data of the Carina Nebula to select the young stellar populations of the region. We then made use of the optical photometric and spectroscopic information available in the literature to identify the counterparts of the X-ray sources. We found that more than 2/3 of the X-ray sources do not have any optical counterparts. To characterize these sources further, we used the Simultaneous InfraRed Imager for Unbiased Survey (SIRIUS) camera, mounted on the Infrared Survey Facility, South Africa to carry out , , and band imaging observations. Figure 1111Figures with better resolution can be obtained from http://cepheus.astro.ncu.edu.tw/kaushar.html shows the optical image of the Nebula from Digitized Sky Survey ( 25′ 25′), with the field marked by a square centered on Tr 16 and covering part of Tr 14, which is in the north west of Tr 16. The field observed in the near infrared is about the same as the field of the optical DSS image. We discuss the X-ray and NIR properties of the known OB stars of the region. We discovered 17 massive star candidates on the basis of their NIR and X-ray properties similar to those of the known OB stars in the region. These candidate OB stars probably escaped previous detection because of their large extinction in the optical wavelengths. Furthermore, we identified some 300 CTTSs and WTTSs candidates, again on the basis of their X-ray and NIR properties. Our study therefore produces the most comprehensive young star sample in the Carina Nebula, which allows us to delineate the star formation history in this seemingly devastating environment. In particular we report the discovery of an embedded ( mag) young stellar group located to the south-east of Tr 16, and sandwiched between two dense molecular clouds. Similar patterns of newly formed stars in between clouds seem to encompass the Carina Nebula, a manifestation of the triggered star formation by the collect-and-collapse process (Deharveng, Zavagno & Caplan, 2005).
The paper is organized as follows. §2 describes the and the NIR observations and the data analysis. In §3, we present the cross-identification of sources with the optical spectroscopic information (available in the literature) and with our NIR sample. We discuss the results and implication of our study in §4. §5 summarizes our results.
2 OBSERVATIONS AND DATA REDUCTION
2.1 X-ray data —
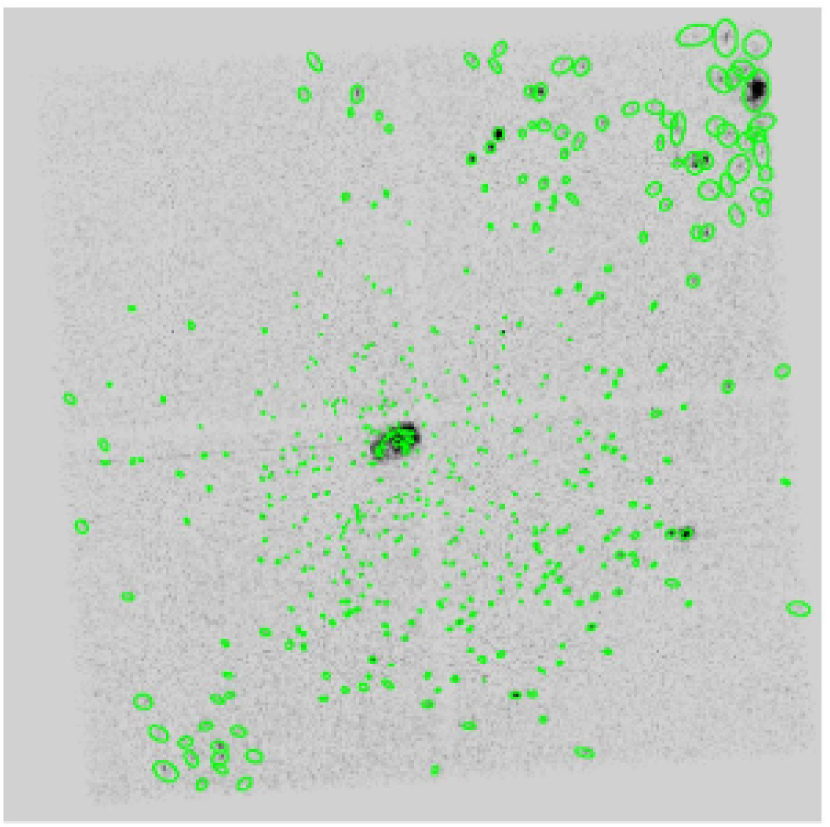
The Carina Nebula was observed by the ACISI detector of Chandra X-ray Observatory. There were two observations in 1999 September 6, observation ID 50 and 1249 (Table 1). We began our data analysis with the Level 1 processed event and filtered cosmic-ray afterglows, hot pixels, grades (0, 2, 3, 4, 6) and status bits. Charge transfer inefficiency (CTI) and time-dependent gain corrections were not applied, because the focal plane temperature of these two observations was not -120 C. Because of the background flaring at the beginning of observation of obs ID 50, we used a reduced exposure time of 8.5 ks. Therefore, the total exposure time of the two combined observations is 18120 s. The filtering process was done using the Interactive Analysis of Observations (CIAO) package and following the Science Threads from X-Ray Center. We also restricted the energy range from 0.4 to 6.0 keV. This would optimize the detection of the PMS stars and reduce spurious detections. Finally, we merged two observations to one image (Figure 2), which was used for source detection.
WAVDETECT program within CIAO was utilized to detect sources in the merged image. We ran wavelet scales ranging from 1 to 16 pixels in steps of with a source significance threshold of 310-6. Removing some spurious detections, e.g. some sources around partial shell of X-ray emission surrounding Carinae (Seward et al., 2001) and along the trailed line due to Carinae itself, we got 454 sources eventually. By using the merged image for source detection, we detected more than double the number of sources than reported by Evans et al. (2003).
We extracted the count of each source from the circular region centered on the WAVDETECT source position with a 95% encircled energy radii ((95%EE)) (Feigelson et al., 2002). For the background determination, an annulus around each source between 1.2 and 1.5 (95%EE) was used. Before extracting the source counts from each observation, exposure and background maps were created. An exposure map was computed to take into account vignetting and chip gaps, and an energy range of 1.2 keV was used for generating the exposure map. To avoid any sources within the background annuli for a given source, a background map was created excluding the sources in (95%EE). This background map was used to obtain the source counts. We utilized DMEXTRACT tool of CIAO to extract source counts for each of the two observations. The total count of each source was then computed by combining the two observations. Finally the count rates were calculated for a total exposure time of 18120 s. The typical background count across the field had a 3- error of count.
2.2 Near-Infrared Data — SIRIUS
We carried out near-infrared imaging observations toward the Carina Nebula using the SIRIUS (Simultaneous InfraRed Imager for Unbiased Survey) camera mounted on the Infrared Survey Facility (IRSF) 1.4 m telescope, in Sutherland, South Africa. The SIRIUS camera (Nagayama et al., 2003) is equipped with three HAWAII arrays of pixels and provides simultaneous observations in the three bands, (1.25 ), (1.63 ) and (2.14 ) using dichroic mirrors. It offers a field of view of with a plate scale of . In April 2003 nine pointings () were observed covering effectively and including the field. The central coordinates of the observed fields are and . For each pointing, 30 dithered frames were observed, with an integration time of 30 s each, giving a total integration time of 900 s. Two pointings (#5 and #6) of the April 2003 data which suffered weather fluctuations were re-observed in January 2005, for which 45 dithered frames were observed with an integration time of 20 s, yielding a total integration time of 900 s for each pointing. The typical seeing during our observations ranged from – and the airmass from 1.2 to 1.5. The standard stars No. 9144 and 9146 from Persson et al. (1998) were observed for photometric calibration.
We used the IRAF (NOAO’s Image Reduction and Analysis Facility) package to reduce the SIRIUS data. The standard procedures for image reduction, including dark current subtraction, sky subtraction and flat field correction were applied. The images in each band were then average-combined for each pointing to achieve a higher signal-to-noise ratio. We performed photometry on the reduced images using IRAF’s DAOPHOT package (Stetson, 1987). Since the field is crowded, we performed PSF (point spread function) photometry in order to avoid source confusion. To construct the PSF for a given image, we chose about 15 bright stars, well isolated from neighboring stars, located away from the nebulosity and not on the edge of the image. The ALLSTAR task of DAOPHOT was then used to apply the average PSF of the 15 PSF stars to all the stars in the image, from which the instrumental magnitude of each star was derived. The instrumental magnitudes were then calibrated against the standard stars observed on each night.
3 X-RAY SOURCES AND STELLAR COUNTERPARTS
The optical spectroscopy of the stars in Tr 14 and Tr 16 has been done by several groups, eg., Walborn (1973, 1982); Levato et al. (1981); FitzGerald & Mehta (1987). The latest work by MJ93 lists the brightest and the bluest stars of the two clusters. We have used this list (Table 4 in MJ93) to find the counterparts of our X-ray sources. Within a search radius, our cross-identification resulted in 30 OB stars from MJ93 as counterparts of our X-ray sources. Apart from MJ93, we also checked for any possible counterparts using SIMBAD222http://simbad.u-strasbg.fr/sim-fid.pl. This resulted into another 8 OB stars of the region (Tapia et al., 1988), the spectral types of which were determined by the photometric Q method (Johnson & Morgan, 1953).
We also used our NIR data to search for the counterparts of the X-ray sources. Again with a search radius, we found counterparts for 432 sources. Thus, more than 95% of the X-ray sources have NIR counterparts. For 51 cases out of 432 sources, the NIR photometric errors are larger than 0.1 mag in one or more bands. Most of these large photometric error cases are for stars located in pointing 5, which is the Tr 16 region. The NIR photometry in this pointing is affected because of a large number of bright stars and nebulosity around Carinae. Since we are using the NIR colors of the sources to delineate their young stellar nature, an uncertainty larger than 0.1 mag cannot serve the purpose. Hence, in our analysis we consider only those cases for which the photometric uncertainties are smaller than 0.1 mag in all the three bands, which leaves us with 384 sources. For our analysis, we have converted the NIR photometry into California Institute of Technology (CIT) system using the color transformations between the SIRIUS and CIT systems as given in Nakajima et al. (2005).
4 RESULTS AND DISCUSSION
4.1 Known OB stars
Table 2 lists the X-ray sources cross-identified with known OB stars. The coordinates of each X-ray source are listed in columns (1) and (2), followed by the identifier of the optical counterpart of the X-ray source, listed in column (3). The optical , and magnitudes, and the spectral type, listed in columns (4)–(6), were adopted in most cases from MJ93 and in others from Tapia et al. (1988). The color excess of each source, , given in column (7), was also taken from MJ93, in which photometry and spectroscopy were used to estimate the intrinsic stellar (FitzGerald, 1970). The bolometric magnitude, , in column (8), was taken from Massey et al. (2001). For a small number of cases, where the spectral types were taken from (Tapia et al., 1988), the color excesses as well as the bolometric magnitudes were estimated using their spectral types. Columns (9)–(11) list the IRSF NIR , and magnitudes of the counterpart. Column (12) lists the X-ray counts of the sources derived by the DMEXTRACT tool of the CIAO software, as described in §3. We used the WebPIMMS333http://http://heasarc.gsfc.nasa.gov/Tools/w3pimms.html to derive the unabsorbed X-ray flux of the sources. To convert an X-ray count to the flux, the Raymond Smith Plasma model with temperature , equivalent to , was adopted. For the extinction correction, the color excess, of each source was used to estimate the neutral hydrogen column density, . The X-ray flux is given in column (13), and the X-ray luminosity, computed by adopting a distance of 2.5 kpc, is in column (14). The last column (15) contains the logarithmic ratio of the X-ray luminosity to the stellar bolometric luminosity, where the latter was derived from the bolometric magnitude, i.e., column (8).
Figure 3 shows the distribution of X-ray luminosities of the known OB stars in our field. Most OB stars have with the distribution peaking . The Wolf-Rayet star (HD 93162) is the brightest X-ray source in the sample, with . This star has been known to be unusually bright in X rays as compared to other W-R stars in the region (Evans et al., 2003). Though it has been thought to be a single star, a recent W-R catalog by van der Hucht (2001) lists it as a possible binary (see discussions in Evans et al. (2003)).
Among the 38 X-ray OB stars, there are 3 B3-type, 3 B5-type and 1 B7-type stars. Mid- to late-B type stars are supposed to be X-ray quiet as they have neither strong enough stellar winds as in the case of O or early B stars, nor the convective zones to power the chromospheric/coronal activities as in the case of late-type stars. However, mid- to late-B type stars have been found to be X-ray emitters in earlier studies, e.g., Cohen et al. (1997). The X-ray luminosities of the mid- to late-type B stars in our sample are comparable to those of T Tauri candidates in the same sample. Although this seems to provide circumstantial evidence of CTTS or Herbig Ae/Be companions to account for the X-ray emission, it does not rule out the possibility of a so far unknown emission mechanism intrinsic to mid- to late-B stars.
The X-ray luminosities of the OB stars are known to satisfy the relation with the stellar bolometric luminosities, namely, . All but a few stars in our sample satisfy this relation (Fig. 4). Among the outliers, labeled on the figure by their spectral types, only HD 93162 (a W-R star), and Tr 1622 (an O8.5V star) are early type stars and hence their high is unusual. Tr 1622 is among the brightest X-ray sources in our sample, with ergs s-1. It is brighter in X rays by a factor of 5–20 compared to other O8.5V stars and even brighter than the two O3 stars in the sample. Evans et al. (2003) present a list of known binaries among the massive stars and discuss the X-ray luminosities against their single or binary status. A massive companion may enhance the X-ray production by colliding winds. No binary companion is known to exist for either HD 93162 or Tr 1622 (Evans et al., 2003) to account for their high X-ray luminosities and high ratios. The rest of the X-ray sources which do not satisfy the correlation are mid-B or late-B type stars. A study by Berghoefer et al. (1998) about the X-ray properties of OB stars using the database showed that the relation extends to as early as the spectral type B1.5, and inferred this as a possibly different X-ray emission mechanism for the mid- or late-B type stars as compared to the O or early-B stars. In our sample, there are 3 B3 type stars which seem to satisfy this relation and all the stars later than B3 deviate significantly from the mean value of ratio for O and early-B stars.
4.2 Candidate OB stars
There are 17 anonymous stars in our sample which have similar NIR and X-ray properties as the known OB stars in the region. These stars appear to be massive stars of O or B types, but we could not find their spectral type information in the literature, e.g., MJ93 or SIMBAD. These candidate OB stars, with their optical and NIR magnitudes along with their X-ray counts and X-ray luminosities are listed in Table 3. To determine their X-ray fluxes from counts, we made use of WebPIIMS. For extinction correction, we used an average based on the Table 4 of MJ93, as we did not have the spectral class information to determine their individual color excesses. Other parameters to obtain the X-ray fluxes from the X-ray counts remain the same as for the known OB stars. We found that the use of an average value of , rather than the individual values, in case of the known OB stars would make a difference of a factor of two or less in the derived X-ray luminosities. Likewise for the temperature, using a between 6.4 to 7.1 also would make a difference of a factor of two or less in the X-ray luminosities. Hence the use of an average color excess for candidate OB stars should not affect much our results.
Figure 5 shows the NIR color-color diagram of the known OB stars and the candidate OB stars. The solid curve represents the dwarf and giant loci (Bessell & Brett, 1988), and the parallel dashed lines represent the reddening vectors, with , , and (Rieke & Lebofsky, 1985). The dotted line indicates the locus for dereddened classical T Tauri stars (Meyer et al., 1997). It can be seen that the candidate OB stars are either intermixed with or redder than the known OB stars. Figure 6 shows the NIR color-magnitude diagram of the known and candidate OB stars. The solid line represents the unreddened main sequence (Koornneef, 1983) at 2.5 kpc. Some candidate OB stars are very bright in NIR, with a few even brighter than mag. In contrast, the candidate OB stars are fainter and redder than the known OB stars in the optical wavelengths (Figure 7), indicative of the effect of dust extinction, while both samples show a comparable range in X-ray luminosities (compare Figure 8 with Figure 2). Thus, it appears that these candidate OB stars have escaped earlier optical spectroscopic studies because of their large optical extinction. Addition of these massive stars expands substantially the known list of luminous stars and thus contributes significantly to the stellar energy budget of the region.
4.3 PMS candidates
Figures 9 and 10 show the NIR color-color and color-magnitude diagrams of all the 380 X-ray sources with NIR photometric errors less than 0.1 mag. By using the criteria given in Meyer et al. (1997), we find about 180 stars as CTTS candidates. Apart from the CTTS candidates, the NIR colors suggest quite a many possible weak-lined T Tauri star (WTTS) candidates. The X-ray and NIR data together hence turn up a large population of low-mass pre-main sequence candidates. The T Tauri candidates in our sample (CTTS plus WTTS) should be a fairly secure T Tauri population, given their X-ray emission and their NIR color characteristics. Although much work has been done on the massive stellar content in Tr 14 and Tr 16, a comprehensive sample of the T Tauri population has not been obtained so far. Tapia et al. (2003) presented photometry of Tr 14, Tr 16 and two other clusters in the region, Tr 15 and Cr 232, and noticed some stars with NIR excess in Tr 14 and Tr 16. They estimated the ages of Tr 14 and Tr 16 to be 1–6 million years. To our knowledge, our sample represents the most comprehensive sample of the young stellar population in Tr 14 and Tr 16. The distribution of X-ray luminosities of the CTTS candidates is shown in Figure 11. Comparison with Figure 2 shows that the X-ray luminosities of the T Tauri candidates are on the average lower and hence consistent with the notion that late-type stars have weaker X-ray emission.
Feigelson & Getman (2005) pointed out that the X-ray luminosity functions (XLFs) of young stellar clusters show two remarkable characteristics. First, the shapes of the XLFs of different young stellar clusters are very similar to each other after the tail of the high luminosity O stars is omitted. Secondly, the shape of this ’universal’ XLF in the 0.5–8.0 keV energy range resembles a lognormal distribution with the mean, and the standard deviation (see Figure 2 in Feigelson & Getman (2005)).
The observations we used in this work include only part of Tr 14. For Tr 16, we can make an estimate of the total stellar population in reference to the XLF of the Orion Nebula Cluster (ONC) derived from the Orion Ultradeep Project (Getman et al., 2005). The limiting X-ray luminosity of our sample is . Excluding the high X-ray luminosity tail, i.e., , which includes about 30 known OB stars and candidate OB stars described earlier, the slope of the Tr 16 XLF is consistent with that of the ONC in the X-ray luminosity range of our sample. This suggests that our sample represents about 20% of the X-ray members in the cluster. We hence estimate that the total stellar population of Tr 16 should be 1000–1300. Furthermore, the X-ray luminosities are known to be correlated with stellar masses, as found in the data (Feigelson et al., 1993) and also in the studies of the ONC (Flaccomio et al., 2003; Preibisch et al., 2005). Comparing the XLF of Tr 16 with the ONC XLF versus stellar mass (Figure 5 in Feigelson et al. (2005)), we infer that our sample is about 60% complete for the stars with masses larger than 1 , and 40% complete between 0.3–1 . Our deep NIR data covering clusters Tr 14, Tr 16 and Cr 232 would probe even lower mass end of the stellar population. The analysis of the complete NIR results will be presented elsewhere.
4.4 A compact embedded X-ray group
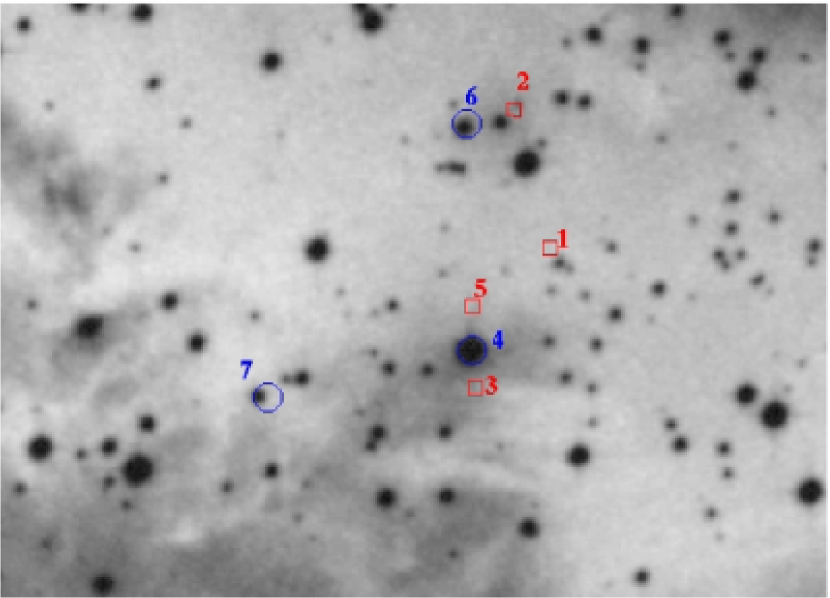
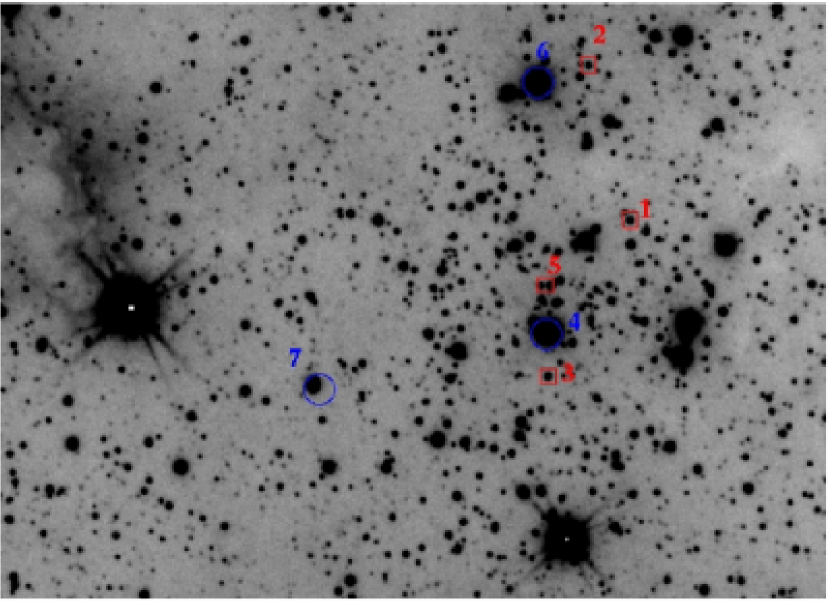
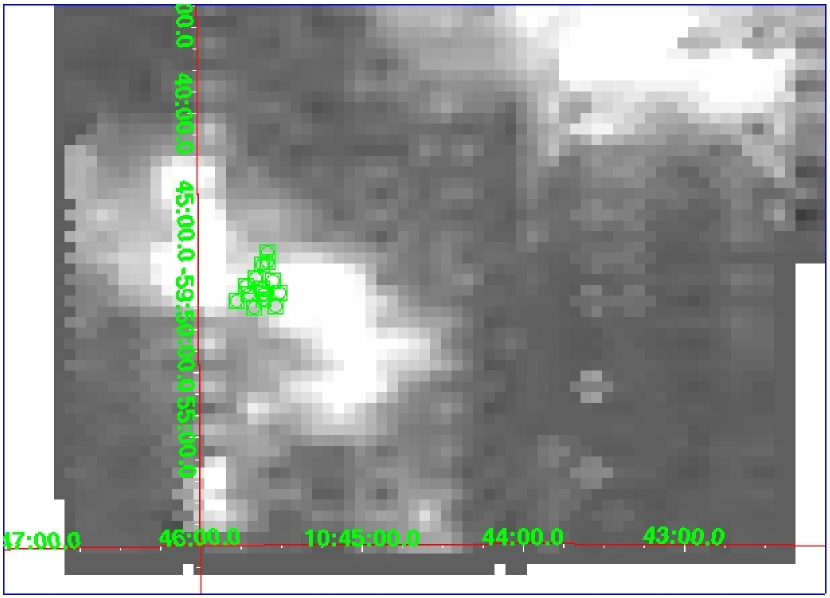
We notice a group of 7 X-ray sources concentrated in a field of 5′ 4′, located south-east of Tr 16 and coincident with the prominent dark ’V’ shaped dust lane which bisects the Carina Nebula. Adopting a distance of 2.5 kpc, the physical size of this star group is about 4 pc. Each of these 7 sources has an NIR counterpart, listed in Table 6 with their coordinates, , , and magnitudes and X-ray counts. We use the star identification number in column 1 of Table 6 in further discussion. The NIR colors have been used to estimate the neutral hydrogen column density. Stars in this group are bright and suffer large amounts of reddening, as seen in the NIR color-color and color-magnitude diagrams (Figures 12 and 13). The brightest sources (stars 4, 6 and 7) in NIR, with 8.5–10.5 mag, are also X-ray bright, with . Star 4 is a known O4 star (Smith et al., 1987). Our NIR magnitudes for this star match with those reported by Smith et al. (1987). Apart from star 4, we could not find any optical photometric or spectroscopic information in the literature for the others sources. The bright NIR and X-ray stars 4, 5, and 6 can be clearly seen in the optical Digitized Sky Survey (DSS) image (Figure 14), whereas the other sources which are highly extincted even in NIR are not visible at all. Figure 15 shows the IRSF image with the sources marked. Stars 1 and 5 are peculiar because they are highly extincted ( 15–25 mag estimated from their NIR colors), yet both are X-ray bright with . What could be the nature of these sources? Their NIR fluxes and colors, along with their non-detection in the DSS image, imply that they could be reddened T Tauri or class I objects. But their X-ray luminosities are much higher than observed in typical T Tauri stars (). One possibility is that they are heavily embedded massive stars. The rest two sources of the group, stars 2 and 3 are relatively faint in both NIR and X rays, thus appear to be reddened T Tauri stars.
It is worth noting that the above mentioned group is spatially close, , to the deeply embedded object, IRAS 104305931. With and observations, Megeath et al. (1996) found this source associated with a bright-rimmed globule with a mass of . They also found sources with NIR excess around this IRAS object and provided the first indication of star-formation activity in the Carina region. More recently, a mid-infrared study by Smith et al. (2000) discovered several clumps along the edge of the dark cloud east of Carinae, including the clump associated with IRAS 104305931. They noted that each of these clumps is a potential site of triggered star-formation due to their location at the periphery of the Nebula behind the ionization fronts. We compared the spatial distribution of this group with the observations by Brooks et al. (1998) in Figure 16. The group of young stars is ’sandwiched’ between two cloud peaks. It is not clear whether the group is continuation of Tr 16 but obstructed by the dark dust lane, or is a separate OB group/association still embedded in the cloud.
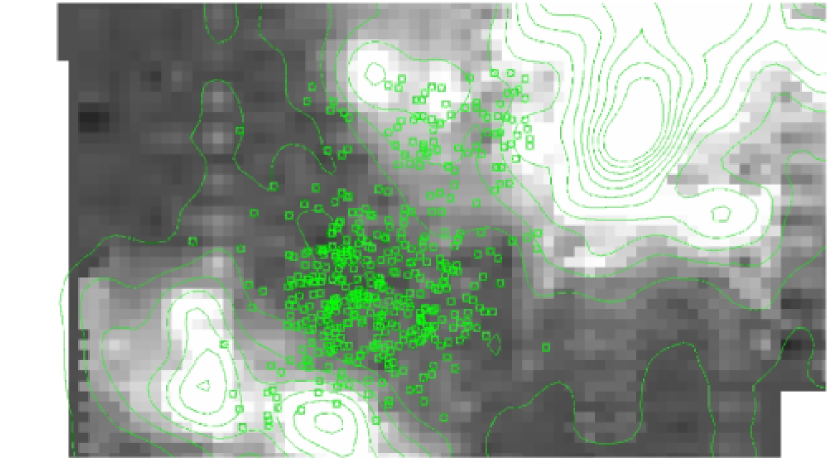
Figure 17 shows all the X-ray sources overlaid with the image (Brooks et al., 1998). One sees immediately a general paucity of stars with respect to molecular clouds. Tr 16 is “sandwiched” between the north-west and south-east cloud complexes. All the X-ray sources (i.e., young stars) associated with these clouds in turn are seen either intervening between clouds or situated near the cloud surfaces facing Tr 16. The morphology of young stellar groups and molecular clouds peripheral to an H II region (i.e., Tr 16) fits well the description of the collect-and-collapse mechanism for massive star formation, first proposed by Elmegreen & Lada (1977) and recently demonstrated observationally by Deharveng, Zavagno & Caplan (2005); Zavagno et al. (2006). The expanding ionization fronts from an H II region compress the outer layer of a nearby cloud until the gas and dust accumulate to reach the critical density for gravitational collapse to form next-generation stars, which subsequently cast out their own cavities. This collect-collapse-clear process may continue as long as massive stars are produced in the sequence and there is sufficient cloud material in the vicinity.
5 SUMMARY
We detected 454 X-ray sources in the image of the Carina Nebula observed in September 1999. About 1/3 of the X-ray sources have optical counterparts in the literature, including 38 known OB stars in the region. In comparison our NIR observations detect counterparts for more than 95% of the X-ray sources. The X-ray luminosities of the known OB stars range in –, with the Wolf-Rayet star, HD 93162, being the strongest X-ray source with . The W-R star also has a very high ratio, . The only other early-type star with a high ratio is an O8.5V type star, Tr 1622, which also has a very high X-ray luminosity of for its spectral type. All other O and early B (up to B3 type) stars satisfy the canonical relation, . There are several mid- to late-B type stars emitting X rays with X-ray luminosities comparable with those typical for T Tauri stars. Hence, it is possible that the X-ray emission from these mid- and late-B stars is coming from T Tauri companions. We discovered 17 candidate OB stars which have escaped detection in previous optical studies because of the larger dust extinction they suffer. These candidate OB stars have the same characteristics as known OB stars in terms of X-ray luminosities and NIR fluxes and colors. If most of them turn out to be bona fide OB stars, this will be already half the number of the known OB stars found as X-ray emitters in the region and would add significantly to the stellar energy budget of the region. The NIR colors of the X-ray counterparts show a large population of low-mass pre-main sequence stars of the classical T Tauri type or the weak-lined T Tauri type. Some 180 classical T Tauri candidates are identified, whose X-ray luminosities range between to , lower than those for OB stars. Comparison of the X-ray luminosity function of Tr 16—which is about 60% complete for stars with masses 1–3 and 40% complete for 0.3–1 —with that of typical young star clusters suggests a total stellar population 1000–1300 in Tr 16. A compact group of highly reddened, X-ray bright and NIR bright sources is found to the south-east of Tr 16. The group is associated with an source and coincident with the dust lane where many mid-IR sources have been predicted to be the potential sites of triggered star-formation. This star group is “sandwiched” between two peaks of the emission. Such star-cloud morphology is also seen in the peripheries of the H II complex in Tr 16, a manifestation of the collect-and-collapse triggering process to account for the formation of massive stars.
References
- Bessell & Brett (1988) Bessell, M. S. & Brett, J. M. 1988, PASP, 100, 1134
- Berghoefer et al. (1998) Berghofer, T. W., Schmitt, J.
- Brooks et al. (1998) Brooks, K., Whiteoak, J. B., & Storey, J. W. V. 1998, PASA, 15, 202
- Cohen et al. (1997) Cohen, D. et al. 1997, ApJ, 487, 867
- Crowther et al. (1995) Crowther, P. A., Smith, L. J., Hillier, D. J., & Schmutz, W. 1995, A&A, 293, 427
- Deharveng, Zavagno & Caplan (2005) Deharveng, L., Zavagno, A., & Caplan, J., 2005, A&A, 433, 565
- Elmegreen & Lada (1977) Elmegreen, B. G.,& Lada, C. J. 1977, ApJ, 214, 725
- Evans et al. (2003) Evans, N. R., Seward, M. I., Isobe, T., Nichols, J., Schlegel, E. M., & Wolk, S. J. 2003, ApJ, 589, 509
- Feigelson et al. (1993) Feigeslson, E. D., Casanova, S., Montmerle, T., & Guibert, J. 1993, ApJ, 416, 623
- Feigelson & Montmerle (1999) Feigelson, E. D., & Montmerele, T. 1999, ARA&A, 37, 363
- Feigelson et al. (2002) Feigelson, E. D., Broos, P., Gaffney, J. A., Garmire, G., Hillenbrand, L. A., Pravdo, S. H., Townsley, L., & Tsuboi, Y. 2002, ApJ, 574, 258
- Feigelson & Getman (2005) Feigelson, E. D., & Getman, K. V. 2005, in The Initial Mass Function: Fifty Years Later, ed. E. Corbelli et al. (Dordrecht: Kluwer)
- Feigelson et al. (2005) Feigelson, E. D., Getman, K., Townsley, L., Garmire, G., Preibisch, T., Grosso, N., Montmerle, T., Muench, A., & McCaughrean, M. 2005, ApJ, 160, 379
- Feinstein (1983) Feinstein, A. 1983, A&S, 96, 293
- Feinstein (1995) Feinstein, A. 1995, RevMexAA, 2, 57
- FitzGerald (1970) FitzGerald, M. P. 1970, A&A, 4, 234
- FitzGerald & Mehta (1987) FitzGerald, M. P. & Mehta, S. 1987, MNRAS, 228, 545
- Flaccomio et al. (2003) Flaccomio, E., Damiani, F., Micela, G., Sciortino, S., Harnden, F. R., Murray, S. S., Wolk, S. J. 2003, ApJ, 582, 398
- Getman et al. (2002) Getman, K. V., Feigelson, E. D., Townsley, L., Bally, J., Lada, C. J., & Reipurth, B. 2002, ApJ, 575, 354
- Getman et al. (2005) Getman, K. V. et al. 2005, ApJS, 160, 319
- Johnson & Morgan (1953) Johnson, H. L. & Morgan, W. W. 1953, ApJ, 117, 313
- Koornneef (1983) Koornneef, J. 1983, A&A, 128, 84
- Lee et al. (2005) Lee, H.-T., Chen, W. P., Zhang, Z. W., Hu, J. Y. 2005, ApJ, 624, 808
- Lee & Chen (2005) Lee, H.-T. & Chen, W. P., astro-ph/0509315
- Levato et al. (1981) Levato, H. & Malaroda, S. 1981, PASP, 93, 714
- Lucy (1982) Lucy, L. B. 1982, ApJ, 255, 286
- Massey & Johnson (1993) Massey, P., & Johnson, J. 1993, AJ, 105, 980
- Massey et al. (2001) Massey, P., et al. 2001, AJ121, 1050
- Maggio et al. (1987) Maggio, A., et al. 1987, ApJ, 315, 687
- Megeath et al. (1996) Megeath, S. T., Cox, P., Bronfman, L., Roelfsema, P. R. 1996, A&A, 305, 296
- Meyer et al. (1997) Meyer, M., Calvet, N., & Hillenbrand, L. A. 1997, AJ, 114, 288
- Morrell et al. (1988) Morrell, N., Garcia, B. & Levato, H. 1988, PASP, 100, 1431
- Nagayama et al. (2003) Nagayama, T. et al. 2003, Proc. SPIE, 4841, 459
- Nakajima et al. (2005) Nakajima, Y. et al. 2005, AJ, 129, 776, 2005
- Persson et al. (1998) Persson, S. E., Murphy, D. C., Krzeminski, W., Roth, M. & Rieke, M. J. 1998, AJ, 116, 2475
- Preibisch & Zinnecker (2002) Preibisch, T., Zinnecker, H. 2002, AJ, 123, 161
- Preibisch et al. (2005) Preibisch, T. et al. 2005, ApJS, 160, 401
- Rieke & Lebofsky (1985) Rieke, G. H., & Lebofsky, M. J., 1985, ApJ, 288, 618
- Seward et al. (2001) Seward, F. D., Butt, Y. M., Karovska, M., Prestwich, A., Schlegel, E. M., & Corcoran, M. 2001, ApJ, 553, 832
- Smith et al. (2000) Smith, N., Egan, M. P., Carey, S., Price, S. D., Morse, J. A., Price, P. A. 2000, ApJ, 532, L145
- Smith et al. (1987) Smith, R. G. 1987, MNRAS, 227, 943
- Stetson (1987) Stetson, P. B. 1987, PASP, 99, 191
- Tapia et al. (1988) Tapia, M., Roth, M., Marraco, H., & Ruiz, M. T. 1988, MNRAS, 232, 661
- Tapia et al. (2003) Tapia, M., Roth, M., Vazquez, R. A., Feinstein, A. 2003, MNRAS, 339, 44
- Turner & Moffat (1980) Turner, D. G., & Moffat, A. F. J. 1980, MNRAS, 192, 283
- van der Hucht (2001) van der Hucht, K. A. 2001, NewARev., 45, 135
- Walborn (1973) Walborn, N. R. 1973, AJ, 78, 1067
- Walborn (1982) Walborn, N. R. 1982, AJ, 87, 1300
- Walborn (1995) Walborn, N. R. 1995, RevMexAA 2, 51
- Whitworth et al. (1994) Whitworth, A. P., Bhattal, A. S., Chapman, S. J., Disney, M. J., & Turner, J. A. 1994, MNRAS, 268, 291
- Zavagno et al. (2006) Zavagno, A., Deharveng, L., Comerón, F., Brand, J., Massi, F., Caplan, J., & Russeil, D., A&A, 446, 171
| Observation ID | 50 | 1249 |
|---|---|---|
| Pointing | 10h45m03s.60 -594103 | 10h45m03s.60 -594103 |
| Roll Observed | 176 | 176 |
| Start Date | 1999-09-06 19:48:12 | 1999-09-06 23:45:34 |
| Exposure Time | 12.04 ks | 9.75 ks |
| Reduced Exposure Time | 8545.99 s | 9574.01 s |
| R.A. | Decl. | Identifier | Sp. type | log Flux | log | log | ||||||||
|---|---|---|---|---|---|---|---|---|---|---|---|---|---|---|
| h m s | ° ′ ″ | (mag) | (mag) | (mag) | (mag) | (mag) | counts | (ergs ) | (ergs ) | |||||
| (1) | (2) | (3) | (4) | (5) | (6) | (7) | (8) | (9) | (10) | (11) | (12) | (13) | (14) | (15) |
| 10 43 56.80 | -59 34 17.4 | Tr 14-25 | 13.44 | 13.12 | B5 | 0.49 | -2.6 | 11.94 | 11.96 | 11.76 | 71.5 | -13.06 | 31.83 | -4.76 |
| 10 43 57.51 | -59 32 53.1 | HD 93129 A/B | 7.51 | 7.26 | O3Iab | 0.55 | -11.5 | 6.23 | 6.14 | 6.01 | 2606.2 | -11.45 | 33.44 | -6.62 |
| 10 43 57.68 | -59 33 53.7 | Tr 14-18 | 12.37 | 12.07 | B0V | 0.60 | -6.9 | 10.76 | 10.54 | 10.55 | 22.7 | -13.47 | 31.42 | -6.81 |
| 10 43 59.96 | -59 32 26.3 | CD 58 3529 | 9.45 | 9.27 | O7V | 0.52 | -8.1 | 8.68 | 8.62 | 8.57 | 350.6 | -12.34 | 32.55 | -6.16 |
| 10 44 00.97 | -59 35 46.2 | Tr 16-200 | 11.04 | 10.67 | O9V | 0.48 | -7.6 | 9.44 | 9.25 | 9.18 | 39.3 | -13.32 | 31.56 | -6.94 |
| 10 44 05.04 | -59 33 42.6 | Tr 14-218 | 12.30 | 11.85 | B1.5V | 0.69 | -4.9 | 10.11 | 9.74 | 9.63 | 26.4 | -13.34 | 31.55 | -5.87 |
| 10 44 07.29 | -59 34 31.1 | Tr 14 229 | 7.98 | 7.82 | O6III | 0.31 | -9.3 | 7.17 | 7.14 | 7.08 | 436.8 | -12.42 | 32.47 | -6.71 |
| 10 44 08.99 | -59 34 34.0 | HD 93160 | 8.76 | 8.56 | O6.5V | 0.31 | -7.7 | 7.07 | 7.02 | 6.96 | 557.0 | -12.31 | 32.58 | -5.97 |
| 10 44 10.44 | -59 43 11.2 | HD 93162 | 8.51 | 8.10 | WN+ | 0.66 | -10.1 | 6.26 | 5.97 | 5.72 | 10179.0 | -10.77 | 34.12 | -5.39 |
| 10 44 13.26 | -59 43 10.4 | Tr 16-244 | 11.72 | 10.80 | O3.5Iab | 0.94 | -8.6 | 7.84 | 7.38 | 7.06 | 226.4 | -12.23 | 32.66 | -6.25 |
| 10 44 22.55 | -59 39 25.9 | Tr 16-11 | 11.39 | 11.23 | B1.5 | 0.43 | -4.9 | 10.63 | 10.56 | 10.47 | 16.5 | -13.74 | 31.14 | -6.28 |
| 10 44 30.44 | -59 37 26.8 | Tr 16-10 | 9.94 | 9.71 | B0Vn | 0.57 | -6.9 | 8.84 | 8.67 | 8.57 | 43.8 | -13.21 | 31.68 | -6.54 |
| 10 44 32.39 | -59 44 31.2 | HD 93204 | 8.57 | 8.40 | O5V((f)) | 0.41 | -9.0 | 8.02 | 7.98 | 7.97 | 192.3 | -12.69 | 32.30 | -6.87 |
| 10 44 33.80 | -59 44 15.6 | HD 93205 | 7.84 | 7.76 | O3V | 0.40 | -10.1 | 7.38 | 7.38 | 7.34 | 985.5 | -11.99 | 32.90 | -6.60 |
| 10 44 36.78 | -59 47 29.7 | CPD -59o 2591 | 11.34 | 10.89 | O8V | 0.76 | -7.1 | 9.39 | 9.03 | 9.12 | 15.9 | -13.50 | 31.38 | -6.92 |
| 10 44 37.43 | -59 32 56.0 | HDE 303311 | 9.01 | 8.90 | O5V | 0.45 | -8.6 | 8.59 | 8.59 | 8.56 | 124.1 | -12.85 | 32.04 | -6.86 |
| 10 44 41.87 | -59 46 56.5 | CPD -59o 2600 | 8.72 | 8.50 | O6V((f)) | 0.51 | -9.0 | 7.79 | 7.73 | 7.64 | 289.2 | -12.43 | 32.46 | -6.61 |
| 10 44 44.22 | -59 42 33.6 | Tr 16-385 | 13.23 | 12.91 | B5 | 0.49 | -2.6 | 11.76 | 11.53 | 11.43 | 35.6 | -13.36 | 31.53 | -4.97 |
| 10 44 45.06 | -59 33 55.2 | HD 93250 | 7.79 | 7.40 | O3V | 0.49 | -10.7 | 6.78 | 6.72 | 6.71 | 2927.9 | -11.44 | 33.43 | -6.30 |
| 10 44 46.03 | -59 40 32.3 | Tr 16-395 | 12.75 | 12.24 | B7 | 0.62 | -1.0 | 10.99 | 10.73 | 10.70 | 8.0 | -13.91 | 30.98 | -4.89 |
| 10 44 47.36 | -59 43 53.4 | CPD -59o 2603 | 8.93 | 8.75 | O7V((f)) | 0.46 | -8.5 | 8.34 | 8.34 | 8.29 | 108.0 | -12.90 | 31.99 | -6.88 |
| 10 44 54.12 | -59 41 29.6 | CPD -59o 2606 | 11.07 | 10.83 | B2:Vn | 0.43 | -4.8 | 10.23 | 10.13 | 10.09 | 9.0 | -14.01 | 30.88 | -6.50 |
| 10 44 57.83 | -59 39 59.7 | Tr 16-453 | 13.28 | 12.83 | B3 | 0.64 | -4.8 | 11.32 | 11.08 | 10.91 | 11.7 | -13.72 | 31.16 | -6.22 |
| 10 45 00.06 | -59 43 34.6 | CPD -59o 2616 | 11.89 | 11.64 | B3 | 0.44 | -4.8 | 10.68 | 10.53 | 10.50 | 20.7 | -13.63 | 31.26 | -6.13 |
| 10 45 03.54 | -59 41 04.2 | Carinae | 6.2 | 5.4 | LBV | 0.40 | -12.0 | 1.65 | 1.07 | 0.17 | 808.9 | -12.07 | 32.76 | -7.54 |
| 10 45 05.86 | -59 45 19.7 | Tr 16-23 | 10.37 | 10.00 | O7V | 0.69 | -7.5 | 8.64 | 8.41 | 8.34 | 45.8 | -13.10 | 31.79 | -6.67 |
| 10 45 05.88 | -59 43 07.8 | Tr 16-9 | 9.95 | 9.70 | O9.5V | 0.56 | -7.2 | 8.85 | 8.69 | 8.70 | 55.0 | -13.11 | 31.77 | -6.57 |
| 10 45 05.95 | -59 40 06.3 | HDE 303308 | 8.32 | 8.21 | O3V((f)) | 0.46 | -9.8 | 7.70 | 7.71 | 7.62 | 440.4 | -12.29 | 32.60 | -6.79 |
| 10 45 06.76 | -59 41 56.8 | Tr 16-3 | 10.32 | 10.12 | O8.5V | 0.52 | -6.9 | 9.43 | 9.28 | 9.36 | 36.0 | -13.33 | 31.56 | -6.67 |
| 10 45 08.26 | -59 40 49.7 | CPD -59o 2628 | 9.63 | 9.52 | O9.5V | 0.44 | -7.5 | 9.24 | 9.13 | 9.25 | 67.8 | -13.12 | 31.77 | -6.70 |
| 10 45 08.26 | -59 46 07.3 | Tr 16-22 | 11.45 | 10.97 | O8.5V | 0.78 | -6.8 | 9.27 | 8.96 | 8.81 | 463.2 | -12.03 | 32.86 | -5.32 |
| 10 45 08.31 | -59 38 47.5 | Tr 16-492 | 13.03 | 12.68 | B3 | 0.52 | -4.8 | 11.39 | 11.07 | 10.94 | 20.0 | -13.59 | 31.30 | -6.09 |
| 10 45 08.75 | -59 40 42.3 | Tr 16-495 | 13.19 | 12.95 | B5 | 0.41 | -2.6 | 12.05 | 11.88 | 11.97 | 7.0 | -14.13 | 30.76 | -5.74 |
| 10 45 12.28 | -59 45 00.6 | HD 93343 | 9.79 | 9.58 | O8V | 0.56 | -8.0 | 8.68 | 8.54 | 8.43 | 117.4 | -12.79 | 32.10 | -6.56 |
| 10 45 12.78 | -59 44 46.4 | CPD -59o 2635 | 9.64 | 9.43 | O8.5V | 0.54 | -8.0 | 8.33 | 8.18 | 8.09 | 98.6 | -12.88 | 32.01 | -6.66 |
| 10 45 12.93 | -59 44 19.4 | CPD -59o 2636 | 9.48 | 9.17 | O8.5V | 0.60 | -8.3 | 8.07 | 7.89 | 7.76 | 191.0 | -12.56 | 32.33 | -6.46 |
| 10 45 16.58 | -59 43 37.3 | CPD -59o 2641 | 9.51 | 9.22 | O6V((f)) | 0.61 | -8.7 | 8.02 | 7.95 | 8.03 | 159.7 | -12.61 | 32.27 | -6.67 |
| 10 45 20.60 | -59 42 51.5 | Tr 16-115 | 10.16 | 10.03 | O8.5V | 0.46 | -6.8 | 9.35 | 9.20 | 9.23 | 30.7 | -13.45 | 31.44 | -6.74 |
| ID | R.A. | DEC. | log Flux | log | ||||||
|---|---|---|---|---|---|---|---|---|---|---|
| h m s | ° ′ ″ | (mag) | (mag) | (mag) | (mag) | (mag) | counts | (ergs ) | (ergs ) | |
| (1) | (2) | (3) | (4) | (5) | (6) | (7) | (8) | (9) | (10) | (11) |
| 1 | 10 44 02.71 | -59 39 45.6 | 14.71 | 13.49 | 10.90 | 10.37 | 10.17 | 98.4 | -12.94 | 31.90 |
| 2 | 10 44 06.74 | -59 36 10.9 | 13.69 | 13.29 | 11.65 | 11.34 | 11.11 | 118.5 | -12.18 | 32.70 |
| 3 | 10 44 27.73 | -59 45 21.3 | 10.97 | 10.12 | 8.30 | 7.83 | 7.73 | 70.8 | -12.57 | 32.31 |
| 4 | 10 44 29.73 | -59 32 20.2 | 12.61 | 11.61 | 7.99 | 7.48 | 7.33 | 64.6 | -12.52 | 32.35 |
| 5 | 10 44 33.61 | -59 38 20.7 | 14.10 | 13.57 | 11.82 | 11.46 | 11.34 | 7.7 | -14.04 | 30.79 |
| 6 | 10 44 46.53 | -59 34 13.6 | 13.70 | 13.23 | 11.82 | 11.40 | 11.30 | 146.5 | -12.63 | 32.26 |
| 7 | 10 44 57.01 | -59 38 26.6 | 15.09 | 13.88 | 11.63 | 11.07 | 10.91 | 46.5 | -12.64 | 32.25 |
| 8 | 10 44 58.35 | -59 39 43.6 | 13.39 | 12.98 | 11.74 | 11.48 | 11.36 | 5.0 | -14.14 | 30.74 |
| 9 | 10 45 07.84 | -59 41 34.0 | 13.44 | 13.03 | 11.57 | 11.35 | 11.21 | 27.0 | -13.41 | 31.48 |
| 10 | 10 45 11.16 | -59 42 33.5 | 14.39 | 13.84 | 11.92 | 11.46 | 10.95 | 19.0 | -13.66 | 31.18 |
| 11 | 10 45 16.18 | -59 41 41.1 | 14.01 | 13.57 | 11.97 | 11.53 | 11.31 | 39.0 | -13.26 | 31.65 |
| 12 | 10 45 18.81 | -59 42 17.9 | 12.88 | 12.57 | 11.43 | 11.20 | 11.09 | 17.0 | -13.71 | 31.18 |
| 13 | 10 45 21.81 | -59 45 25.0 | 13.96 | 13.35 | 11.81 | 11.50 | 11.32 | 11.4 | -13.64 | 31.25 |
| 14 | 10 45 36.40 | -59 48 24.2 | 12.70 | 12.10 | 9.29 | 8.80 | 8.50 | 75.8 | -12.77 | 32.12 |
| 15 | 10 45 36.79 | -59 47 02.0 | 9.75 | 8.88 | 8.33 | 47.1 | -13.26 | 31.57 | ||
| 16 | 10 45 38.28 | -59 42 07.7 | 14.11 | 13.52 | 11.32 | 10.57 | 10.20 | 29.5 | -13.24 | 31.64 |
| 17 | 10 45 46.36 | -59 48 42.1 | 11.59 | 10.93 | 10.55 | 55.4 | -13.19 | 31.64 |
| ID | R.A. | DEC. | ||||
|---|---|---|---|---|---|---|
| h m s | ° ′ ″ | (mag) | (mag) | (mag) | (counts) | |
| 1 | 10 45 32.73 | -59 47 47.0 | 16.80 | 14.45 | 13.38 | 28.7 |
| 2 | 10 45 34.52 | -59 46 56.3 | 15.96 | 14.68 | 14.20 | 6.1 |
| 3 | 10 45 36.32 | -59 48 38.0 | 15.37 | 14.13 | 13.65 | 3.4 |
| 4 | 10 45 36.40 | -59 48 24.2 | 9.29 | 8.80 | 8.50 | 75.8 |
| 5 | 10 45 36.46 | -59 48 08.3 | 16.05 | 14.63 | 14.05 | 82.9 |
| 6 | 10 45 36.79 | -59 47 02.0 | 9.75 | 8.88 | 8.33 | 47.1 |
| 7 | 10 45 46.36 | -59 48 42.1 | 11.59 | 10.93 | 10.55 | 55.4 |