Galaxies Under
the Cosmic Microscope:
Resolved Spectroscopy and New Constraints
on the
z=1 Tully-Fisher relation
Abstract
We exploit the gravitational potential of massive cluster lenses to probe the emission line properties of six galaxies which appear as highly magnified luminous arcs. Using the GMOS integral field spectrograph together with detailed cluster lens models we reconstruct the intrinsic morphologies and two-dimensional velocity fields in these galaxies on scales corresponds to 0.5kpc (unlensed) at . Four of the galaxies have stable disk-like kinematics, whilst the other two resemble interacting or starburst galaxies. These galaxies lie close to the mean rest-frame -band Tully-Fisher relation for nearby spirals suggesting a clear preference for hierarchical growth of structure. In the rest-frame -band, the observations suggest mag of brightening, consistent with increased star-formation activity at . However, the galaxies with stable disk kinematics have more slowly rising rotation curves than expected from galaxies with similar surface brightness in the local Universe. We suggest that this may arise because the distant galaxies have lower bulge masses than their local counter-parts. Whilst this study is based on only six galaxies, the gain in flux and in spatial resolution achieved via gravitational magnification provides a much more detailed view of the high redshift Universe than possible with conventional surveys.
keywords:
galaxies, Tully-Fisher relation, gravitational lensing, galaxy clusters, Integral Field Spectroscopy, Gravitational Arcs: Individual1 Introduction
Massive galaxy clusters magnify the light from galaxies that serendipitously lie behind them. This natural magnification provides the opportunity to study intrinsically faint high redshift galaxies with a spatial resolution and to surface brightness limits that cannot be attained via conventional observations. These highly magnified sources can provide unique insights into the properties of typical galaxies at early times in the Universe (Smail et al., 1996; Franx et al., 1997; Teplitz et al., 2000; Ellis et al., 2001; Campusano et al., 2001; Smith et al., 2002; Swinbank et al., 2003; Kneib et al., 2004). The majority of known galaxy cluster lenses are at , which makes them ideal for detailed studies of galaxies at (Edge et al., 2003; Sand et al., 2005), i.e. before the Universe had reached half of its current age.
At important questions regarding the relationship between the total mass of a galaxy and the baryonic mass locked up in stars remain unanswered. In local rotationally-supported spiral galaxies, this relation is best described by the Tully-Fisher relation (Tully & Fisher, 1977) – an empirical correlation between the terminal rotational velocity (or line width) and the absolute magnitude of a spiral galaxy. This relationship may reflect how rotationally-supported galaxies formed, perhaps suggesting the presence of self regulating processes for star formation in galactic disks. Measuring the evolution of the Tully-Fisher (TF) relation as a function of look back time therefore provides important insights into the growth of galaxy mass (Vogt et al., 1997; Böhm et al., 2003; Milvang-Jensen et al., 2003; Bamford et al., 2005). One specific and rather simple test is to determine whether the stellar mass in galaxies has increased in lock-step with the mass of the dark matter halo or whether the stellar mass grows within a pre-existing dark matter halo. The former is predicted by “hierarchical” galaxy formation models (e.g. White & Frenk, 1991; Kauffmann et al., 1994; Cole et al., 2000) since the growth of the stellar disk is regulated by the rate at which gas is accreted by the halo (the accretion rate is similar for gas and dark matter). The latter is characteristic of simple “classical” galaxy formation models such as Eggen et al. (1962). In simplified outline, the hierarchical model predicts that the correlation between the terminal rotation velocity and stellar mass should evolve little, while the classical model predicts that the stellar mass corresponding to a fixed rotation velocity should decrease with increasing redshift.
This observational test can be made using the galaxies photometry as a proxy for stellar mass. It is now generally accepted that the shape, zero-point and scatter of the TF relation depend on bandpass and that a smaller dispersion is obtained for near-infrared band-passes (i.e. rest-frame rather than rest-frame -band). The dust-correction is much smaller in near-infrared photometry and moreover, it is more sensitive to the underlying, evolved stellar population which best traces the stellar mass and thus correlates more tightly with the maximum rotational speed (or total galaxy mass; Verheijen 2001; Conselice et al. 2005) (we note that, for gas-rich systems the bluer pass-bands are more sensitive to current star-formation and therefore may also correlate closely to total baryonic mass).
However at the small angular size of galaxies means that obtaining spatially resolved rotation curves is extremely challenging (e.g. a typical local spiral has a scale length of 4 kpc, which corresponds to only at ). One solution to this problem is to exploit the magnifying power of foreground galaxy cluster lenses – for a typical lens magnification factor of ten, 0.6′′ corresponds to an unlensed physical scale of just 0.5 kpc at . Thus galaxies can be targeted that would otherwise be too small. Spatially resolved kinematics can also be achieved on spatial scales far greater than otherwise possible due to the increased flux sensitivity over conventional observations. Moreover, the benefits of gravitational magnification are complemented by Integral Field Spectroscopy (which produces a contiguous x, y, velocity map at each point in the galaxy) of the target galaxies. Clean decoupling of the spatial and spectral information is therefore feasible, thus eliminating problems arising from mixing of the two in traditional long-slit observations. It is therefore much easier to identify which galaxies have regular (bi-symmetric) velocity fields for comparison with local spirals.
In this paper we present a study of six gravitationally-lensed galaxies observed through the cores of four galaxy cluster lenses. Five of the targets lie behind Abell 2390, Cl 2236-04 and RGB 1745+398, the sixth (Arc#289 at behind A 2218) was previously discussed in Swinbank et al. (2003). All six targets were observed with the Gemini Multi-Object Spectrograph Integral Field Unit (GMOS IFU) on Gemini-North. We concentrate on the galaxy dynamics as traced by the [Oii]3726.1,3728.8Å emission line doublet. The IFU data provide a map of the galaxy’s velocity field in sky co-ordinates. To interpret this field we correct for the magnification and distortion caused by the lensing potential using models of the cluster lenses. These models are constrained by the positions and redshifts of other spectroscopically confirmed gravitational arcs in each cluster. In a few cases, the IFU targets are themselves multiply imaged and the folding of the velocity field places additional constraints on the cluster potential. These lensing corrections allow us to reconstruct the intrinsic (unlensed) properties of the galaxies at , including their geometry.
The velocity field of systems displaying regular (bi-symmetric) rotational velocity fields i.e. resembling rotating disks are reduced to traditional one-dimensional rotation curves. The terminal rotation velocity, indicative of the galaxy mass, is then extracted. All of the targets have been imaged in the optical and near-infrared bands. The gravitational lens models allow us to correct the photometric observations for the amplification of the cluster and to establish the intrinsic (unlensed) rest-frame - and -band luminosities of the galaxies. We can then compare the TF relations for our target galaxies with local observations, and hence to test the models for the build-up of galaxy mass as a function of look-back time.
The structure of this paper is as follows. In §2 we describe the sample selection, observations and the data reduction. In §3 we analyse the data, including photometry, gravitational lens modeling and galaxy reconstruction. In §4 we present the one-dimensional rotation curves and the TF relation at . Finally in In §5 we discuss our results on the TF relation at and the implications for galaxy evolution. We also outline the wider applicability of the gravitational telescope method. Through-out this paper we use a cosmology with , and .
2 Observations and Data Reduction
2.1 Sample Selection
| Source | zcl | zarc | ref | |||
|---|---|---|---|---|---|---|
| (h m s) | () | (ks) | ||||
| A 2218 arc#289 | 0.176 | 16 35 55.07 | +66 11 51.00 | 1.034 | 5.4 | 1,2,3 |
| RGB 1745+398arc | 0.267 | 17 45 38.11 | +39 51 23.80 | 1.056 | 10.8 | 4 |
| A 2390arcA | 0.233 | 21 53 34.52 | +17 42 02.32 | 0.912 | 14.4 | 6,7 |
| A 2390arcB | 0.233 | 21 53 34.30 | +17 41 56.01 | 1.032 | 12.0 | 5,6 |
| A 2390arcD | 0.233 | 21 53 34.39 | +17 42 21.19 | 0.912 | 10.8 | 7 |
| Cl 2236-04arc | 0.560 | 22 39 33.00 | -04 29 19.83 | 1.116 | 10.8 | 8 |
The positions and redshifts of the gravitational arcs observed during this program are listed in Table 1. In order to avoid possible biases, the targets were selected to be representative of lensed galaxies in the distant Universe — no attempt was made to select galaxies with relaxed late-type morphology. However, we did require that arcs were resolved in both spatial dimensions so that a two dimensional velocity field could be extracted from the IFU data. This restricted our selection to galaxies with moderate magnification.
2.2 Imaging
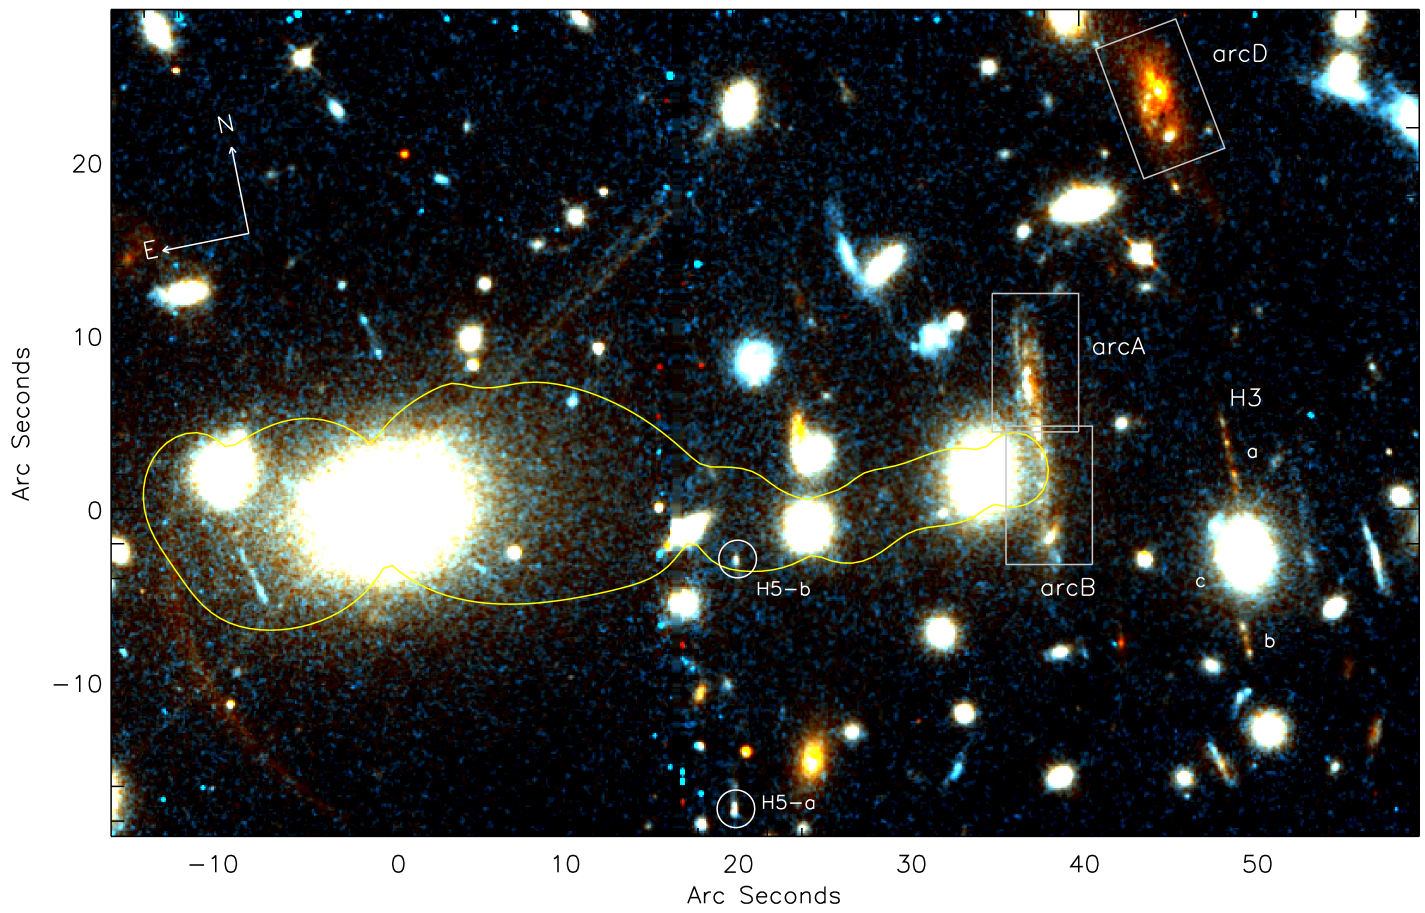
Near-infrared imaging of Abell 2390 was obtained the Wide-field Infrared Camera (WIRC; Wilson et al. 2003) on the Hale 200′′ Telescope111The Hale Telescope at Palomar Observatory is owned and operated by the California Institute of Technology.. The -band data were taken on 2004 June 30, totaling 12.8 ks. The -band data were taken over four observing runs between October 2003 and June 2004 yielding a total integration time of 11.5 ks. All of these data were taken when transparency was good, with the -band conditions likely photometric. The seeing was typically . The data were reduced using standard iraf222IRAF is distributed by the National Optical Astronomy Observatory, which is operated by the Association of Universities for Research in Astronomy, Inc., under a cooperative agreement with the National Science Foundation. procedures. Photometric calibration was achieved using 2MASS333This paper makes use of data products from the Two Micron All Sky Survey (2MASS), which is a joint project of the University of Massachusetts and the Infrared Processing and Analysis Center/California of Technology, funded by the National Aeronautics and Space Administration and the National Science Foundation. data on stars in the same fields. We also retrieved observations of A 2390 from the Hubble Space Telescope (HST) public archive444Obtained from the Multimission Archive at the Space Telescope Science Institute (MAST). STScI is operated by the Association of Universities for Research in Astronomy, Inc., under NASA contract NAS5-26555. Support for MAST for non-HST data is provided by the NASA Office of Space Science via grant NAG5-7584 and by other grants and contracts.. The Wide Field Planetry Camera 2 (WFPC2) observations through the - and -band filters totalled 10.5 and 8.4 ks respectively – the data were reduced using the standard stsdas package in iraf. The final reduced data are shown as a colour image in (Fig. 1). A 2390 has also been observed with the Advanced Camera for Surveys (ACS) as part of the Guaranteed Time Observations (GO: 9292, PI: Ford). We concentrated solely on the -band ACS data, reducing the single orbit (2.2 ks), CR-split, undithered data using multidrizzle with the default parameter set.
Ground-based optical imaging of Cl 2236-04 and RGB 1745+398 (Fig. 1) is taken from Kneib et al. (1994) and Nilsson et al. (1999) respectively. These consist of and -band imaging of these clusters taken with the New Technology Telescope (NTT) and Nordic Optical Telescope (NOT) respectively. We supplement these optical data with near-infrared - and -band imaging of both clusters on the UK Infra-Red Telescope (UKIRT) between 2004 August 15 and 2004 August 20555The United Kingdom Infrared Telescope is operated by the Joint Astronomy Centre on behalf of the U.K. Particle Physics and Astronomy Research Council.. The observations were made in photometric conditions and seeing using the UKIRT Imaging Spectrometer (UIST) imaging camera (Ramsay Howat et al., 1998) which employs a InSb detector at 0.12′′ pixel-1 to give a 2′ field of view. The observations were taken in a standard nine-point dither pattern and reduced using the relevant orac-dr pipeline (Cavanagh et al., 2003). The total integration times for each band was 2.4 ks. To calibrate our data, we observed UKIRT faint photometric standards (Hawarden et al., 2001). These standards were observed at similar air masses and using the same instrumental configuration as the target galaxies.
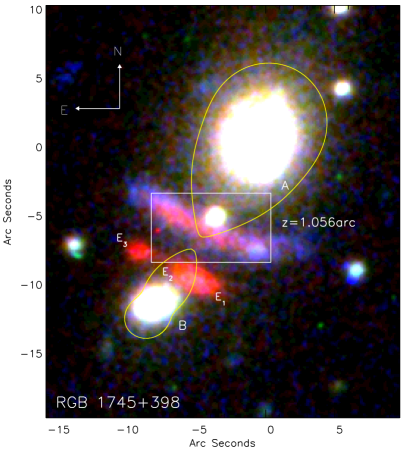
The most striking feature in the new near-infrared imaging is the discovery of a red triply-imaged galaxy 4′′ to the South-East of the arc in RGB 1745398 (Fig. 1). This arc is barely detected in the optical imaging, but is very bright in the near-infrared ( and ) and an colour of . The obvious triple image configuration, along with a spectroscopic redshift of this arc would provide a new constraint on the lens model of this cluster and therefore a more precise reconstruction of the intrinsic properties of the blue arc targeted by the IFU observations (§2.3). We describe ground-based optical and near-infrared spectroscopy of the red arc in §2.4.
2.3 Integral Field Spectroscopy
Traditionally, observations are made with a two-dimensional detector, sufficient for imaging programs. However, for spectroscopic measurements, one spatial dimension of the sky is usually lost in order to allow dispersion of the image across one axis of the detector. Spectrograph’s placing a long slit over the object lose spatial information orthogonal to the slit width. In order to faithfully investigate the properties of galaxies which are spatially extended, we require spectroscopic information over the whole of a two-dimensional field. An instrument simultaneously producing both two-dimensional imaging data and a spectrum for each point in the image provides integral field spectroscopy.
Integral field spectroscopy thus allows spectra to be simultaneously obtained for a number of contiguous areas across a two-dimensional field. The spatially resolved spectroscopy allows the variation with positions of object spectra to be measured, and this information can be used, for example, to determine the object’s internal kinematics, or the star formation rate within an object, providing insight into its process of evolution. This technique is therefore crucial in order to investigate the internal properties of distant galaxies.
Our sample were observed in queue mode with the Gemini Multi-Object Spectrograph (GMOS) on Gemini-North666Programme ID: GN-2003A-Q-3. The GMOS observations are based on observations obtained at the Gemini Observatory, which is operated by the Association of Universities for Research in Astronomy, Inc., under a cooperative agreement with the NSF on behalf of the Gemini partnership: the National Science Foundation (United States), the Particle Physics and Astronomy Research Council (United Kingdom), the National Research Council (Canada), CONICYT (Chile), the Australian Research Council (Australia), CNPq (Brazil) and CONICET (Argentina). between 2003 June 8 and 2003 August 14 in photometric conditions and 0.7′′ seeing. Details of the observations and source redshifts are listed in Table 1. The IFU uses a lensed fiber system to reformat the a contiguous field (comprising an array of 4026 hexagonal fibres each of 0.2′′ diameter) into two long slits (Allington-Smith et al., 2002). All observations were made using an -band filter in conjunction with the R400 grating which results in two tiers of spectra covering the maximum field of view. The spectral resolution of this configuration is . Each observation was split into 2.4 ks sub-exposures and dithered by one IFU lenslet to account for bad pixels. The data was reduced in iraf using the GMOS-IFU data reduction pipeline which extracts, flat-fields and wavelength calibrates the data. To subtract the sky emission lines the GMOS IFU employs a second () IFU separated by one arcminute on the sky. We used idl to identify and extract sky-fibres adjacent to object fibres on the spectrograph and used these to achieve the sky-subtraction. We also improved the flattening of the data by using continuum regions either side of the emission lines. This is achieved by identifying wavelength regions free from sky emission lines near the redshifted [Oii] line and averaging the flux in these regions over 200Å. For each fiber, this average was divided into the fiber spectrum to improve the fiber-to-fiber response map. The output pixel scale is 1.3Å pixel and the instrumental profile has a FWHM of 3.4Å (measured from the widths of the skylines). This corresponds to in the galaxy rest-frame, and the set-up adequately resolves the [Oii]3726.1,3728.8Å emission-line doublet. In all following sections we have deconvolved the instrumental resolution from the line width measurements where these could be reliably determined.
For one of the targets, (A 2390arcA), we required two pointing’s to cover the large spatial extent () of the galaxy. During the second pointing the much smaller arc ( at 1.033; A 2390arcB) was also covered. In order to align and mosaic these two datacubes we constructed (wavelength-collapsed) white-light [Oii] emission line maps of the two arcs. This was achieved by identifying the central wavelength of the [Oii] emission in each galaxy and then collapsing the data-cubes between -300 and +300. These were then compared and aligned using the HST -band image as a reference to produce the final mosaiced datacube.
We also note that the redshift of the arc in RGB 1745+398 (=1.056) places the [Oii] emission at 7660Å; close to the Fraunhofer A-band. To correct for this absorption, we extracted the spectrum of the foreground cluster galaxy (which is a strong continuum source at this wavelength; see §3.2.4) and use this to model and correct for the telluric absorption.
After constructing the datacubes, we proceed to fit the [Oii] emission line doublet in each pixel using a minimisation procedure, taking into account the greater noise at the position of the sky lines. The spectra were averaged over 33 spatial pixels (), increasing this region to 44 pixels () if the signal was too low to give a sufficiently high improvement over a fit without the line. In regions where this averaging process still failed to give an adequate , no fit was made. Using a continuum fit, we required a minimum of 25 (S/N of 5) to detect the line and when this criterion is met, we fit the [Oii] emission line doublet with a double Gaussian profile of fixed separation, allowing the normalization and central wavelength to vary. If the line is detected at greater than 7 significance, we also allow the line width to vary. The two lines of the doublet are assumed to have the same intensity and width. Whilst it is possible for the two emission lines of the [Oii] doublet to have different intensities (due to the density and temperature of the gas), at this spectral resolution and typical signal-to-noise we view it as more reliable to fix the ratio of the intensities to unity (we note that in the collapsed spectrum from each galaxy there is no noticable difference between in the fluxes between the two peaks). To calculate the error in the velocity we perturb the wavelength of the best fit profile and allow the signal to drop by a of 9. This corresponds to a formal 3 error.
2.4 Long Slit Spectroscopy
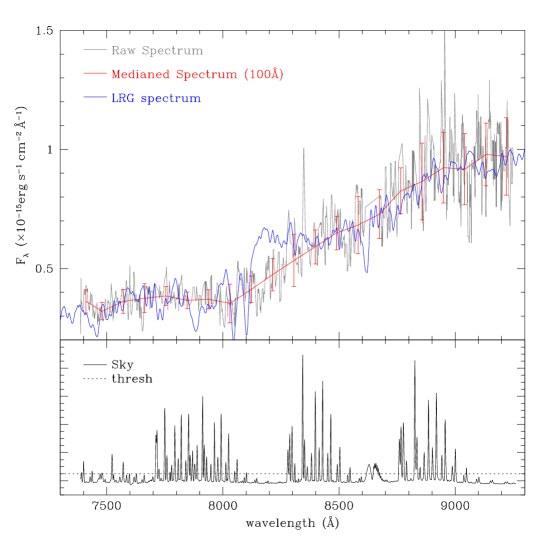
In the course of assembling the new and archival imaging data required for this article we discovered a new triply-imaged red arc in RGB 1745398 (Fig. 1). We estimate the redshift of this arc using hyper-z (Bolzonella et al., 2000) and the photometry given in §2.2, obtaining . We attempted to measure a spectroscopic redshift for this arc on 2005 February 22. We used the Cooled Grating Spectrograph 4 (CGS4) and UIST, both on UKIRT to explore and respectively – the total integration times for both of these observations was 1 hour. We detected continuum emission in these data, but no obvious line emission. We therefore also searched for spectral features at shorter wavelengths using the red arm of the Low Resolution Imaging Spectrograph (LRIS; Oke et al. 1995) in long slit mode on the Keck I 10-m telescope777Obtained at the W.M. Keck Observatory, which is operated as a scientific partnership among the California Institute of Technology, the University of California and the National Aeronautics and Space Administration. The Observatory was made possible by the generous financial support of the W.M. Keck Foundation.on 2005 March 05. The 831/8200 grating was oriented at to sample the wavelength range . A total integration time of 3.3 ks was accumulated from three separate exposures with a wide slit. Flux calibration was achieved via observations of the spectrophotometric standard G138-31 (Oke, 1990). The data were reduced using standard iraf tasks – the final reduced 1-dimensional spectrum is shown in Fig. 6. Again, no strong emission or absorption features were found, however there is a continuum break at 8440Å which we interpret as the 4000Å break redshifted to . The uncertainty on the redshift is estimated by comparing the data with the mean spectrum of a luminous red galaxy from the Sloan Digital Sky Survey; (Fig. 6).
3 Data Analysis and Modelling
3.1 Photometry
Table 2: Arc Photometry
| Photometry | ||||||
| A 2218 arc#289 | ||||||
| RGB1745+398arc | ||||||
| A2390arcA | … | … | ||||
| A2390arcB | … | … | ||||
| A2390arcD | … | |||||
| Cl2236-04arc | … | … | ||||
Table 2. Optical and near-infrared photometry for the arcs in our sample.
Table 3: Source-Frame Properties of the Arcs
| Amplification | Inclination | vrot | MB | MI | Disk Scale Lengths | |||
| (i) | ||||||||
| A 2218 arc#289 | 20617 | -21.100.20 | -22.340.21 | 2.4 | 2.1 | 2.2 | ||
| RGB1745+398arc | 10325 | -19.550.60 | -20.220.55 | - | - | - | ||
| A2390arcA | 17028 | -20.090.24 | -21.370.25 | 2.0 | 2.2 | 2.6 | ||
| A2390arcB | … | … | -18.240.30 | -18.700.20 | 0.8 | 0.8 | 1.1 | |
| A2390arcD | … | … | -21.770.20 | -23.270.15 | - | - | - | |
| Cl2236-04arc | 9830 | -19.790.22 | -20.510.23 | 1.6 | 1.3 | 1.9 | ||
From our optical/near-infrared imaging, we constrain the spectral energy distribution (SED) of each galaxy. Since the arcs usually lie with a few arcs-seconds of nearby bright cluster galaxies, we calculate the magnitude of the arcs in various pass-bands by masking the arc and interpolating the light from the nearby cluster members. We then use the iraf imsurfit package with the sky estimated from a 2nd order polynomial surface fit. This is subtracted from the regions around each galaxy to account for the halo light from the nearby cluster galaxies. We then use sextractor (Bertin & Arnouts, 1996) to estimate the residual background within the frame and extract the arc photometry using sextractor. We use the observed colours (at the known redshift) to infer the ratio of current to past star formation rate and use this to find the best fit SED. At the rest frame -band luminosity is approximately equivalent to the observed -band and so is calculated from interpolating and photometry. We co-add the images to obtain an aperture which is used to extract the magnitudes and interpolate for the relevant SED type. We apply the same technique for the rest-frame -band magnitude, (at , and -bands are the closest match to rest-frame -band) and estimate its uncertainty by computing the magnitude for a variety of SED types which are consistent with the observed optical colours.
3.2 Gravitational Lens Modelling and Galaxy Reconstruction
In order to investigate the source-plane properties of the sources we must first correct for the distortion and magnification of the galaxy image by the cluster lens. Although this does not affect the sign or amplitude of the velocities, we must determine accurately the gravitational magnification of each galaxy so that we can recover its intrinsic geometry and hence estimate the inclination angle. In this section we describe briefly the construction of the cluster lens models and their application to derive the intrinsic properties of the galaxies at . The lens modelling techniques are those described in detail by Smith et al. (2005), originally developed by Kneib (1993), and further refined by Kneib et al. (1996) and Smith (2002). The primary constraints on the lens models are the positions and redshifts of spectroscopically confirmed gravitational arcs in each cluster. The IFU data (§2.3) provide additional constraints because the components of the observed arcs that are identified as being multiple-images of the same region of the respective lensed galaxies must, within the uncertainties, have the same velocity and [Oii] line strength, in addition to the usual broad-band flux and colour constraints.
3.2.1 A 2218
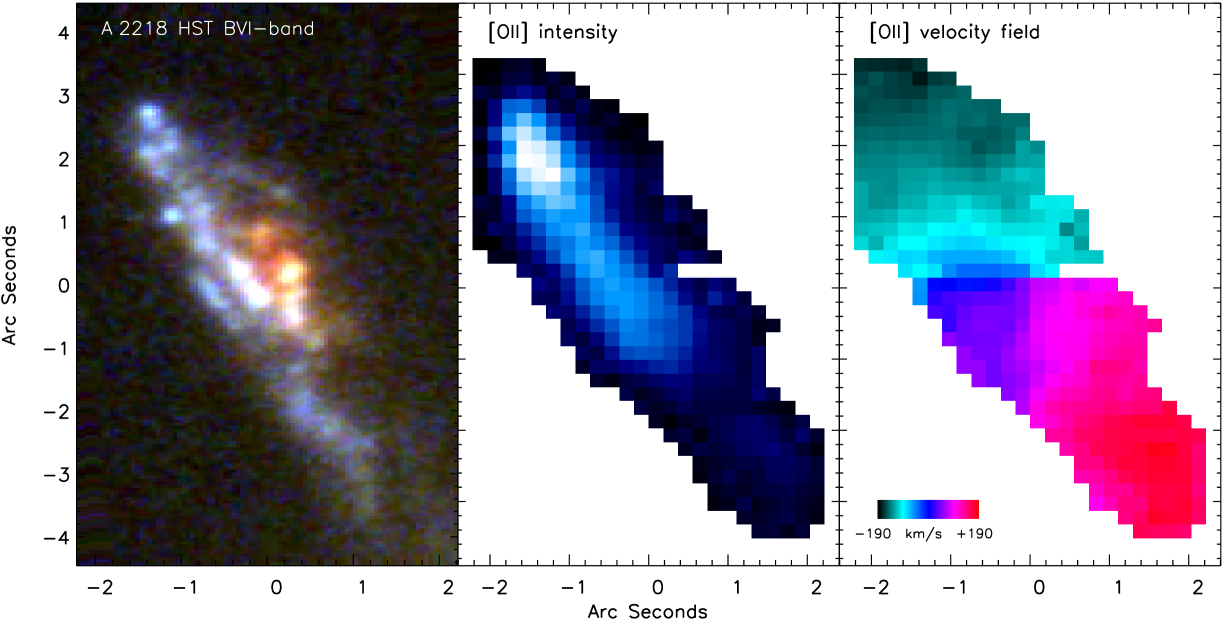
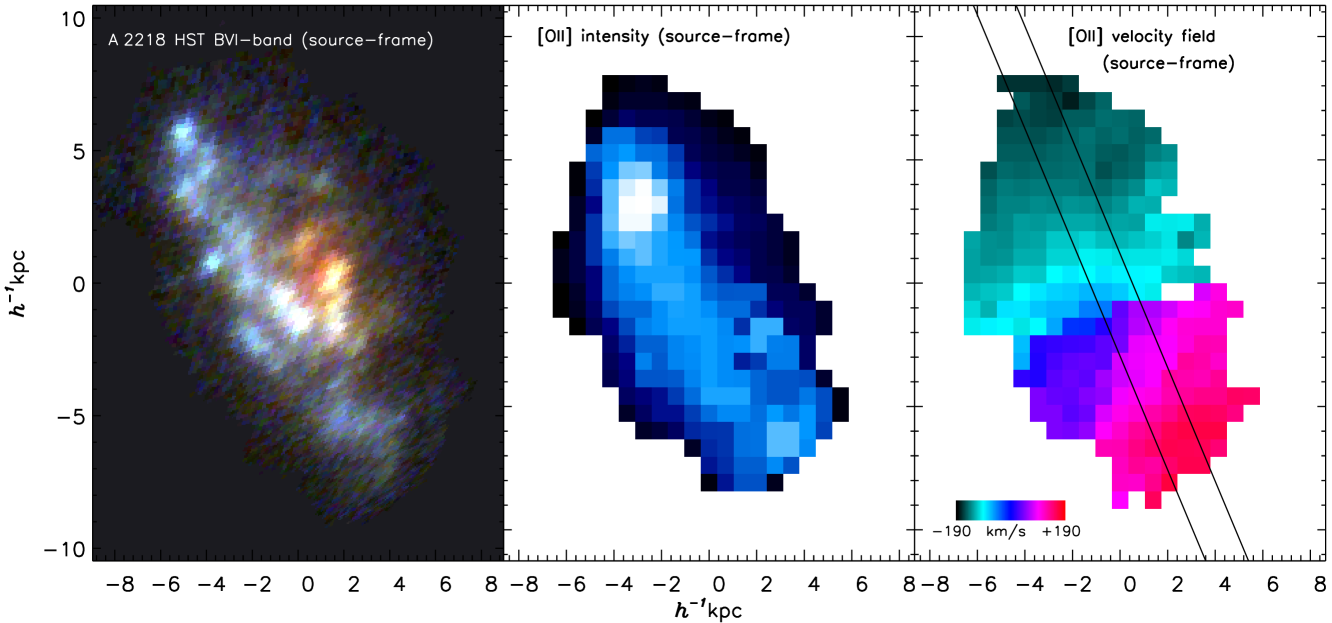
Arc #289 in A2218 was discussed in detail by Swinbank et al. (2003). Here we summarize the key details and use this arc to explain the methods applied to the other arcs.
A 2218 is one of the best constrained strong lensing clusters, including three multiple-image systems that have been spectroscopically confirmed via their line emission. This cluster has been modeled on numerous occasions: Kneib et al. (1993; 1996; 2004); Ellis et al. (2001); Smith et al. (2005). We use the most recent of these to calculate the luminosity weighted magnification (). This was achieved by ray-tracing between the image- and source-planes to build up a map across the arc of how the observed flux relates to the intrinsic (unlensed) flux. The statistical error on was derived from the family of lens models which adequately reproduce the multiply-imaged arcs. For each model we then recompute the magnification of each arc. The error corresponds to the largest variation in magnification that we found via this method. The luminosity weighted amplification for this arc is , which translates to a boost in magnitude of .
The mapping between image- and source-plane co-ordinates described above was also used to reconstruct the intrinsic morphology of Arc#289 from the flux map of the arc after lensing correction, (see Fig. 3). The reconstruction reveals that Arc#289 is a blue disk-galaxy with much internal structure, resembling a late-type galaxy. This is especially prominent in the -band which samples the rest-frame UV and is therefore dominated by the star-forming Hii regions (Fig. 3). To measure the geometry of the disk we fitted ellipses to an isophote in the reconstructed flux maps using the idl gauss2dfit routine (and assume an intrinsically circular disk). The ellipticity is then (where and are the major and minor axis of the ellipse) and the inclination, , is . The average axis ratios of the ellipses from the various passband are translated into inclinations and the error bars on are computed by applying the same procedure to each passband and each of the lens models described above. The inclination of the galaxy is found to be .
We use the intrinsic velocity field (constructed in a manner similar to that applied to the broad-band imaging above) to infer the rotational velocity of the galaxy’s disk. The terminal rotation velocity is (i.e. half the asymptotic velocity shift across the galaxy). Using the inclination angle derived above, we therefore calculate a corrected rotation velocity of .
3.2.2 A 2390
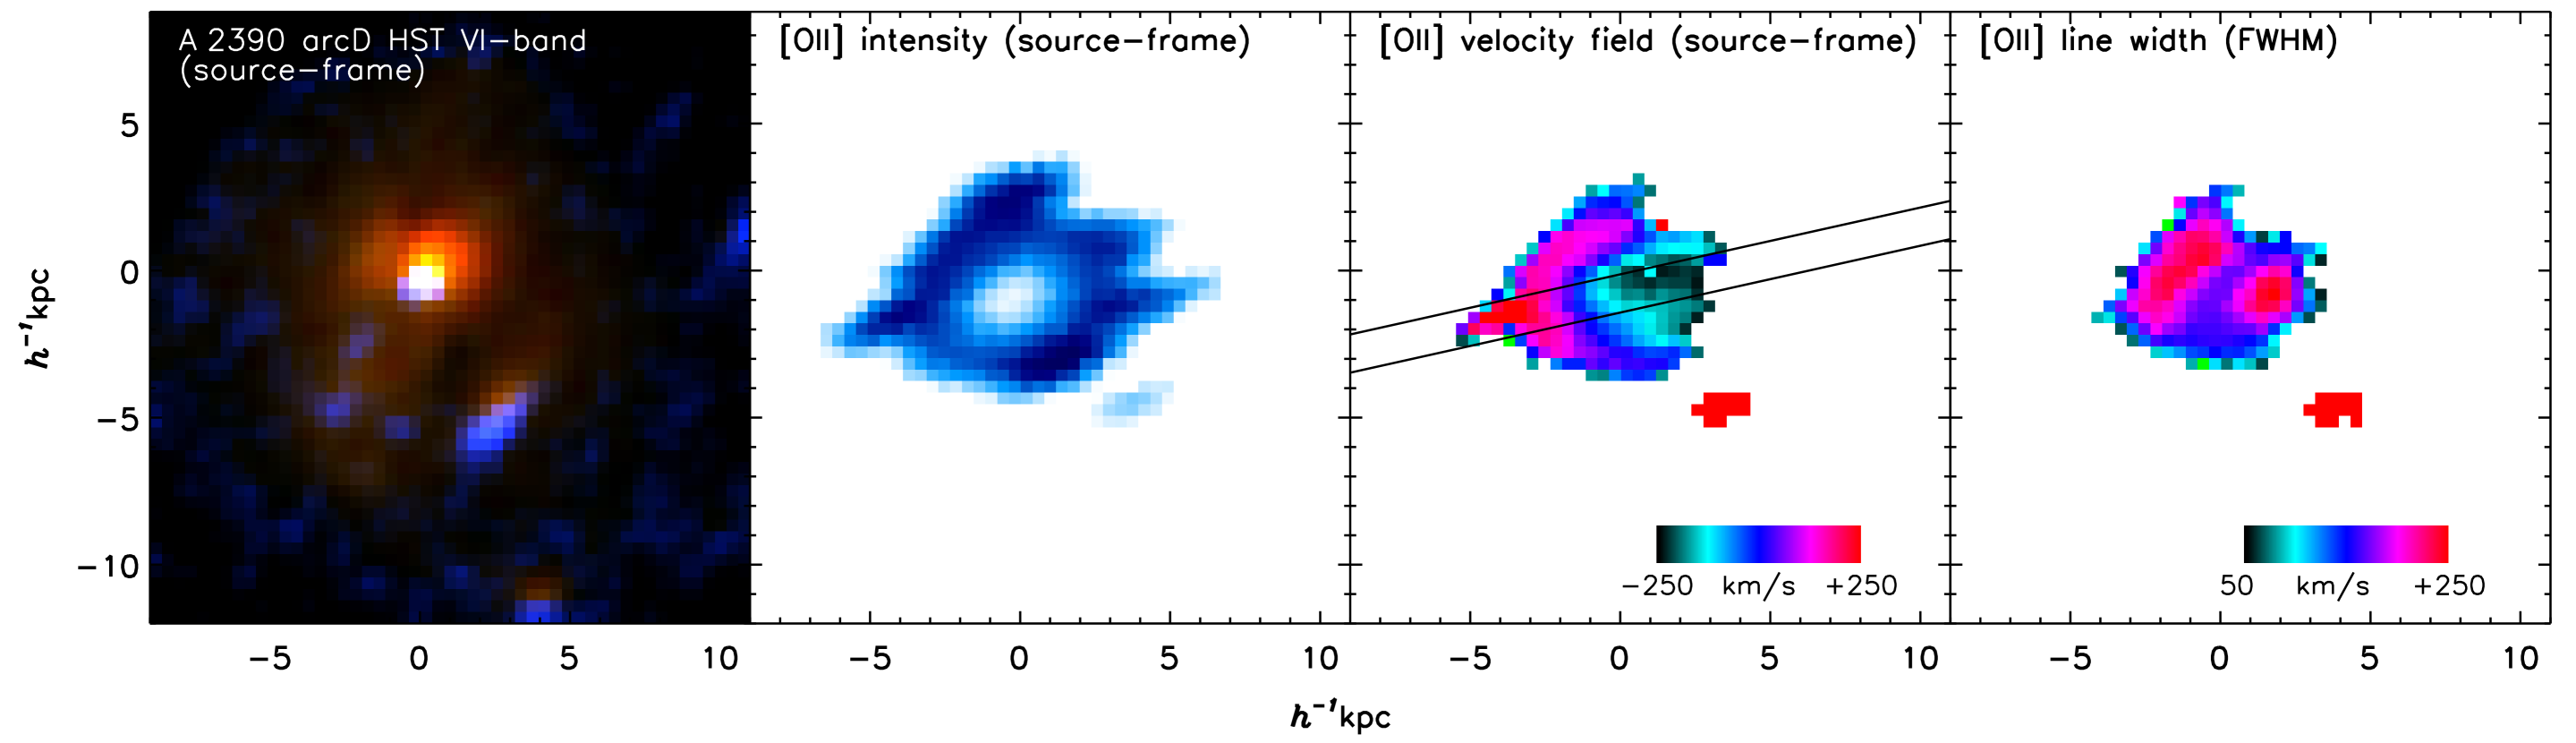
A cluster lens model of A 2390 was originally developed by Pelló et al. (1999) who spectroscopically identified two z4 multiply imaged galaxies behind the cluster. The first (labelled H3 in Fig. 1) has a redshift of and all three images lie within 10′′ of the cluster galaxy to the West. The second lies at (labelled H5-a and H5-b in Fig 1). However, the third image of this galaxy was not identified by Pelló et al. (1999) because it lies outside of the field of view of the HST/WFPC2 observations available at that time. We have used the larger field of view of the new ACS -band data (§2.2) to identify the third counter-image of H5 at =21:53:36.64, =+17:42:11.8 (J2000). These spectroscopically confirmed multiple-image systems are used to constrain the lens model of this cluster, including the generation of a family of acceptable models as described in §3.2.1. The critical curve of the best-fit model is shown in Fig. 1 – this curve defines where multiply-imaged galaxies at =0.912 will appear in the observed (image) plane. In a simple axi-symmetric system the gravitational magnification is infinite along critical curves. This is not the case in the perturbed gravitational potential of a galaxy cluster, nevertheless magnifications of are routine (Table 2).
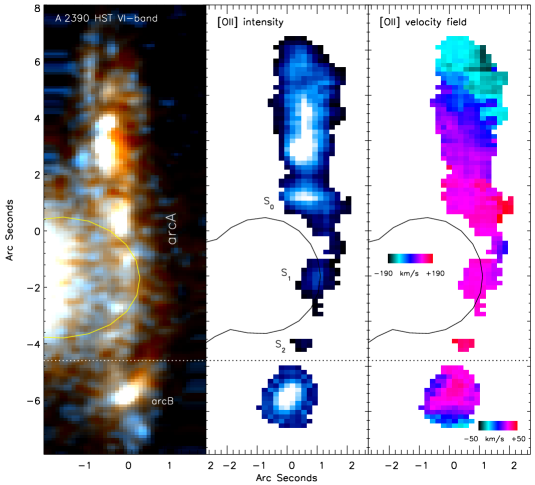
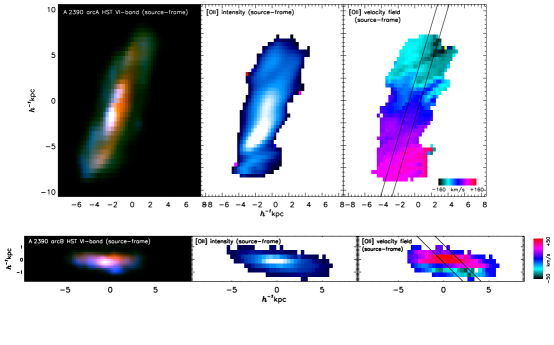
A2390 arcA – This arc (the so-called “straight arc” – Pelló et al. 1999) is long, has a redshift of and lies approximately 40′′ to the West of brightest cluster galaxy (BCG). Based solely on the broad-band imaging, the arc may be multiply-imaged at its southern end, indeed the critical curve of the best-fit lens model is immediately adjacent to the southern portion of this arc (Figs. 1 & 3). However the acceptable models include several that predict this arc to be strongly-sheared at its southern end rather than multiply-imaged. The velocity field derived from the GMOS observations supports the multiple-image interpretation: the southern end of the galaxy () has an observed velocity (with respect to the center of the galaxy) of (Fig. 3). The relative velocity of components and also agree within with the velocity of . We conservatively include both multiple-image and strong-shear interpretations when estimating uncertainties below.
We use the same methods as described in §3.2.1 to reconstruct the intrinsic properties of this arc, obtaining the lensing corrected morphology, [Oii] map and velocity map shown in Fig. 3. This galaxy therefore appears to have disk-like kinematics, to be magnified by , (), and have an inclination angle of . The terminal velocity (uncorrected for inclination effects) is , which translates into a corrected rotation velocity of .
A 2390arcB – The GMOS observations of A 2390arcA also allowed us to study the [Oii] emission from a slightly higher redshift () arc, located to the South of A 2390arcA (Fig. 1 & 3). This galaxy has a compact observed morphology (). We calculate a luminosity-weighted magnification of , () which yields a lensing corrected half-light radius of just . There is no significant velocity gradient along the major axis of the reconstructed galaxy (Fig. 3), however we extract the maximum velocity shear from the data to derive an estimated a possible peak-to-peak velocity of . Moreover, the [Oii] emission doublet is well resolved with a FWHM of (deconvolved for instrumental resolution). These estimates place A 2390arcB comfortably within the scatter of Hii regions in the velocity-width versus half light radius from lower redshift () narrow-emission line galaxies from Guzman et al. (1996).
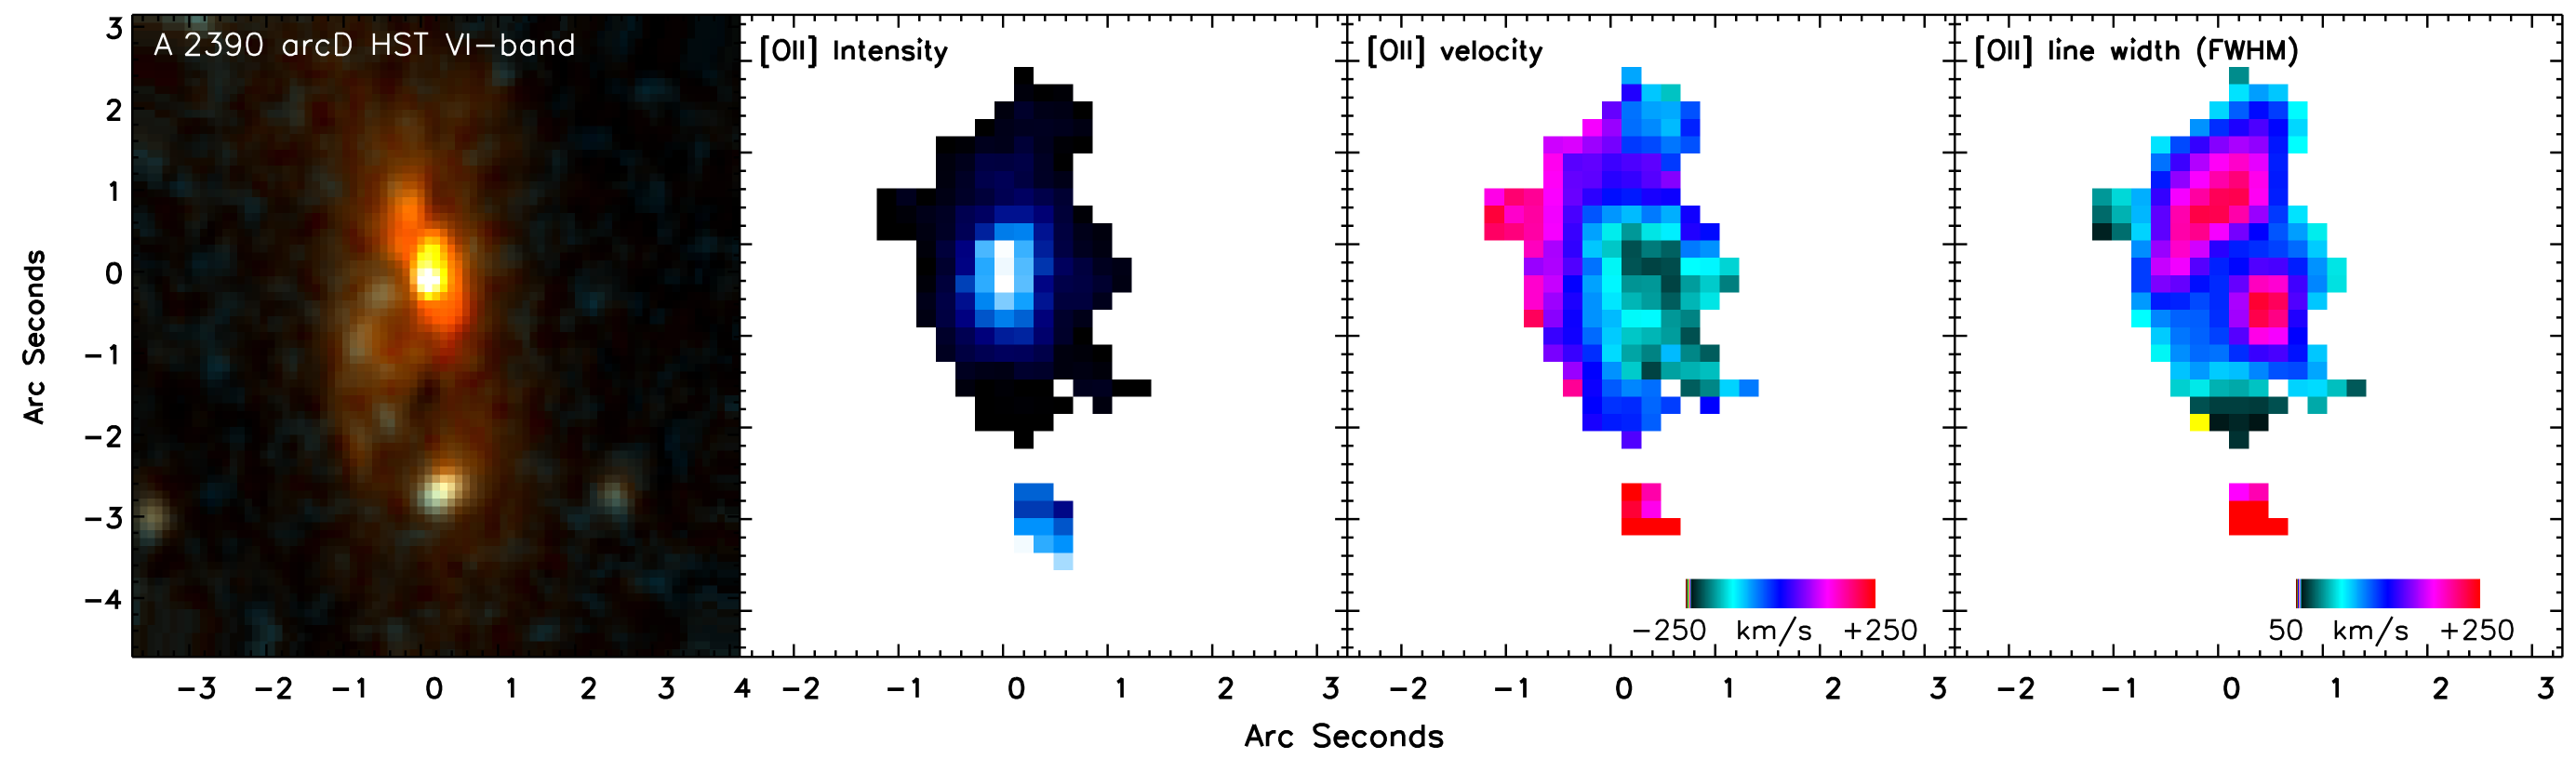
A2390 arcD – This arc lies away from A 2390arcA, their similar redshift suggesting that A 2390 may be lensing a group of galaxies. The HST observations reveal an irregular morphology and the colours are consistent with either an evolved stellar population or a dusty-reddened star-burst. The strong and spatially resolved [Oii] emission revealed by our GMOS data appear to favor the latter interpretation, and reveal that the galaxy is not relaxed (Fig. 3). The mean velocity of the line emission suggests possible rotation about the major axis of the galaxy with peak-to-peak velocity of . This is orthogonal to the direction of rotation suggested by the galaxy’s morphology. Furthermore, the line profiles in the central region appear clearly broadened, having FWHM. This suggests either (i) a merger between two galaxies, or (ii) shock heated, outflowing material from the central regions of the galaxy (powered by AGN activity). Our observations also confirm that the (unresolved) bright knot (located to the south) is part of the same system, but show that it is offset by in velocity and has an [Oii] line width of . The magnification of this source is ().
3.2.3 Cl 2236-04
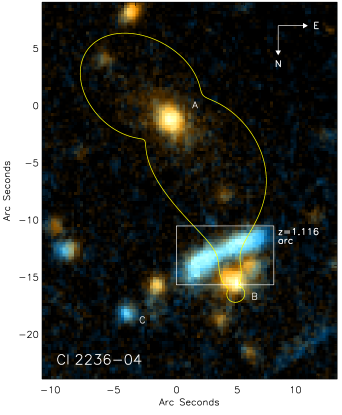
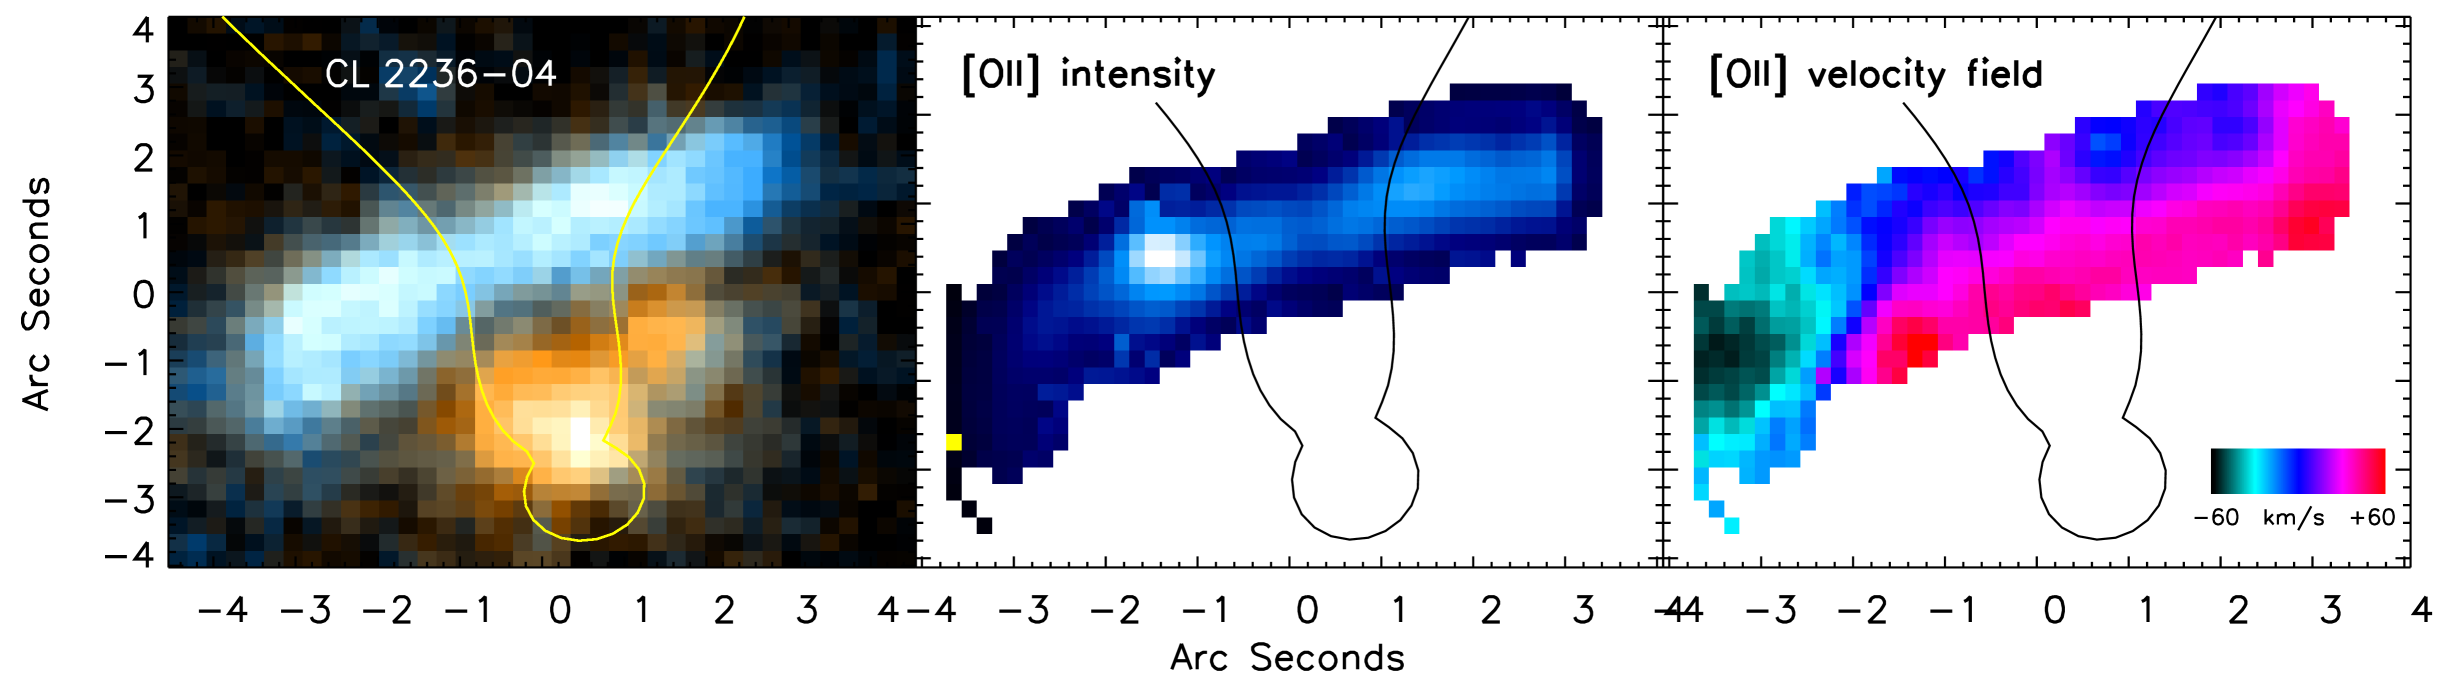
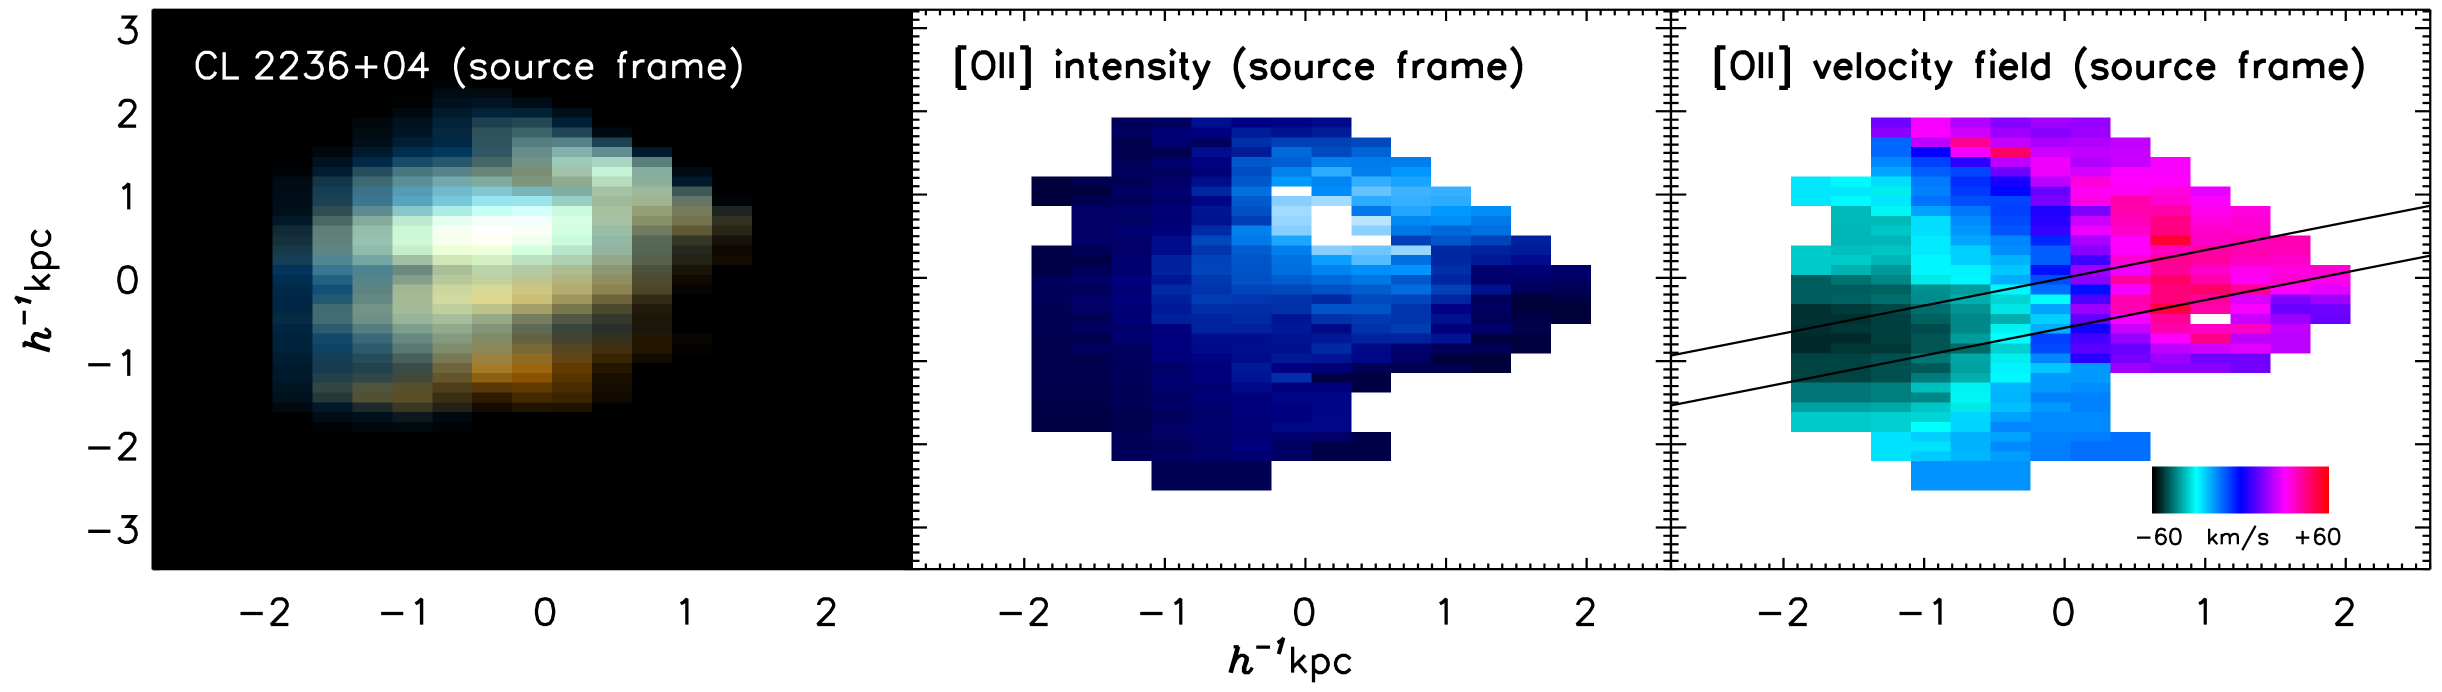
The blue arc in Cl 223604 (Melnick et al., 1993) lies between two bright elliptical galaxies (labelled and in Fig. 1). The arc is almost straight with a length of , and was shown by Kneib et al. (1994) to not be part of a multiple-image system including the blue source labelled in Fig. 1, which is at . Kneib et al. also identified a velocity gradient along the arc using longslit spectroscopic data; but the lack of full two-dimensional data lead them to suggest that the arc comprises a pair of closely interacting galaxies. The lack of both high resolution HST imaging and integral field spectroscopy of the arc made it difficult for them to test the galaxy-galaxy merger hypothesis. With the full two-dimensional coverage our GMOS data are therefore a powerful tool in this regard because they allow us to decouple cleanly the spatial and spectral information that are mixed in long slit observations. Fig. 4 shows the [Oii] emission line intensity and velocity field of the arc. The velocity field across the arc is seen to be smooth and regular, with the eastern (receding) portion stretched by the gravitational potential of the cluster. There is no obvious sign of a galaxy-galaxy merger in these data. The simplest interpretation is therefore that the arc comprises a single disk-like galaxy, the receding portion of which is either multiply-imaged or strongly-sheared by the gravitational potential of the foreground cluster – i.e. a similar interpretation to that of arcA in A 2390.
We construct a suite of nine models that are able to reproduce the observed arc morphology and velocity field. All of the models contain mass components for galaxies (the BCG) and , plus a mass component for the central cluster dark matter halo centered on the BCG. Seven of the models have bi-modal dark matter distribution and contain a dark matter halo centered on galaxy . The models with a unimodal dark matter distribution (e.g. , ) shear the galaxy at sufficiently to reproduce a symmetric source-plane morphology with respect to the position where the observed velocity field changes sign. The more extreme of the bi-modal models (e.g. , ) multiply-image the receding part of the galaxy, but do not have quite enough mass to multiply-image the approaching part of the galaxy. The best fit lens model has , . The critical curve of the best-fit model is shown in Figs. 1 & 4. All nine models are used when estimating the uncertainties in the galaxy reconstruction.
Following the methods described in §3.2.1, we use the suite of models to obtain a mean luminosity weighted magnification of () and a lensing corrected inclination of . The observed velocity profile shows a terminal velocity of across the galaxy which translates into an inclination corrected rotation velocity of .
3.2.4 RGB 1745+398
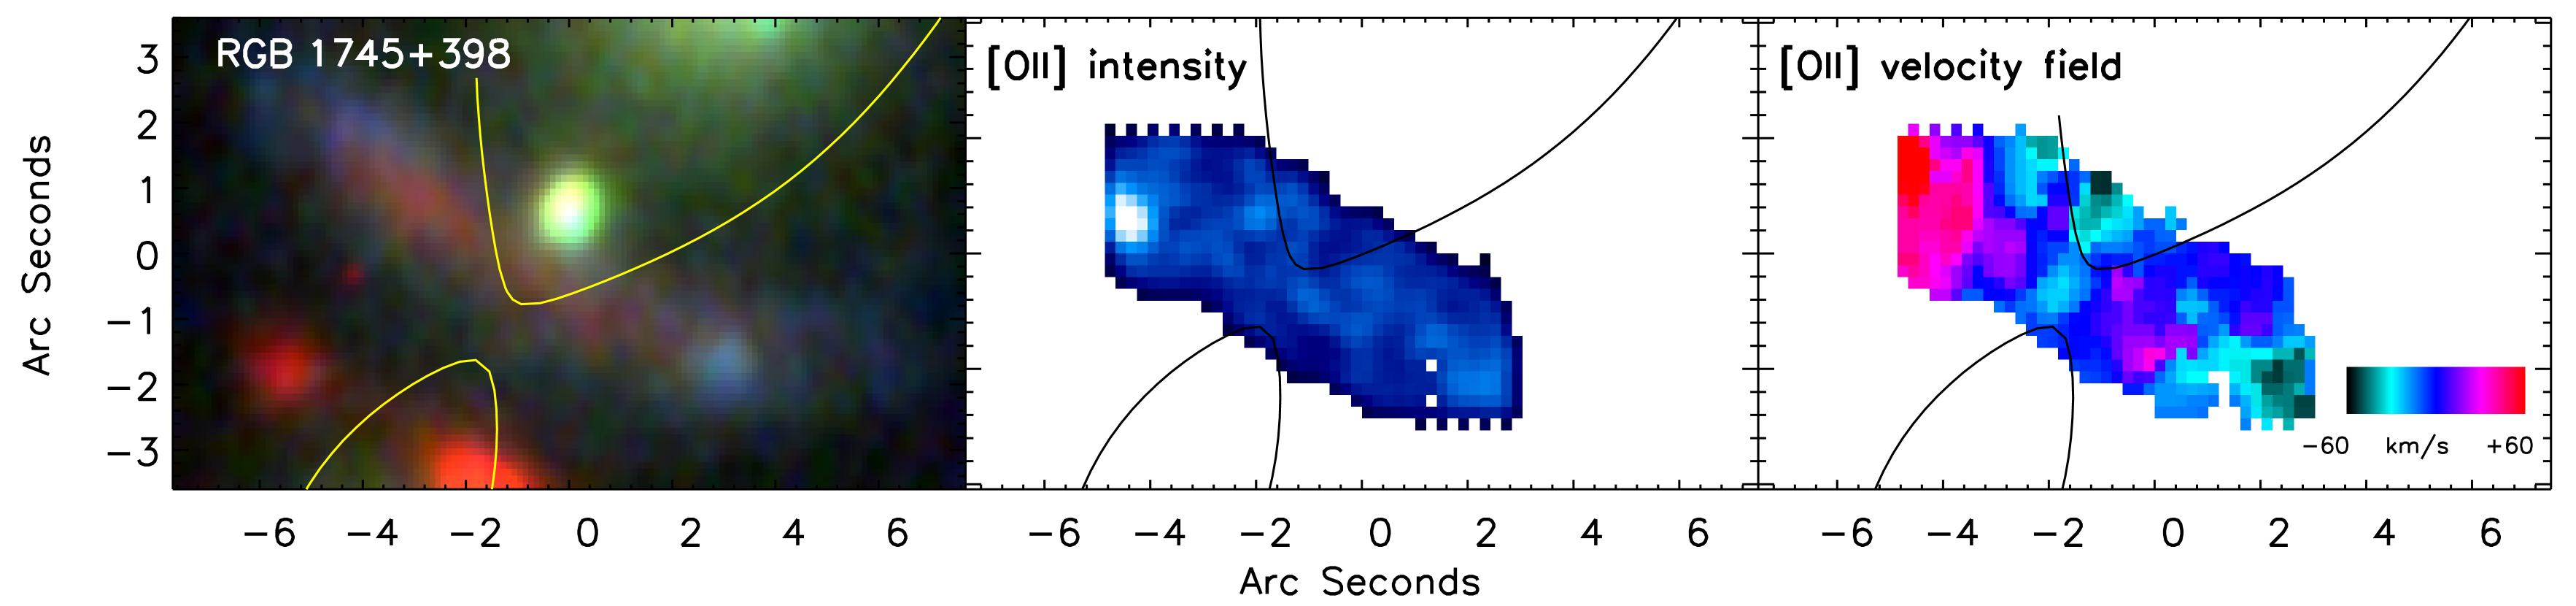
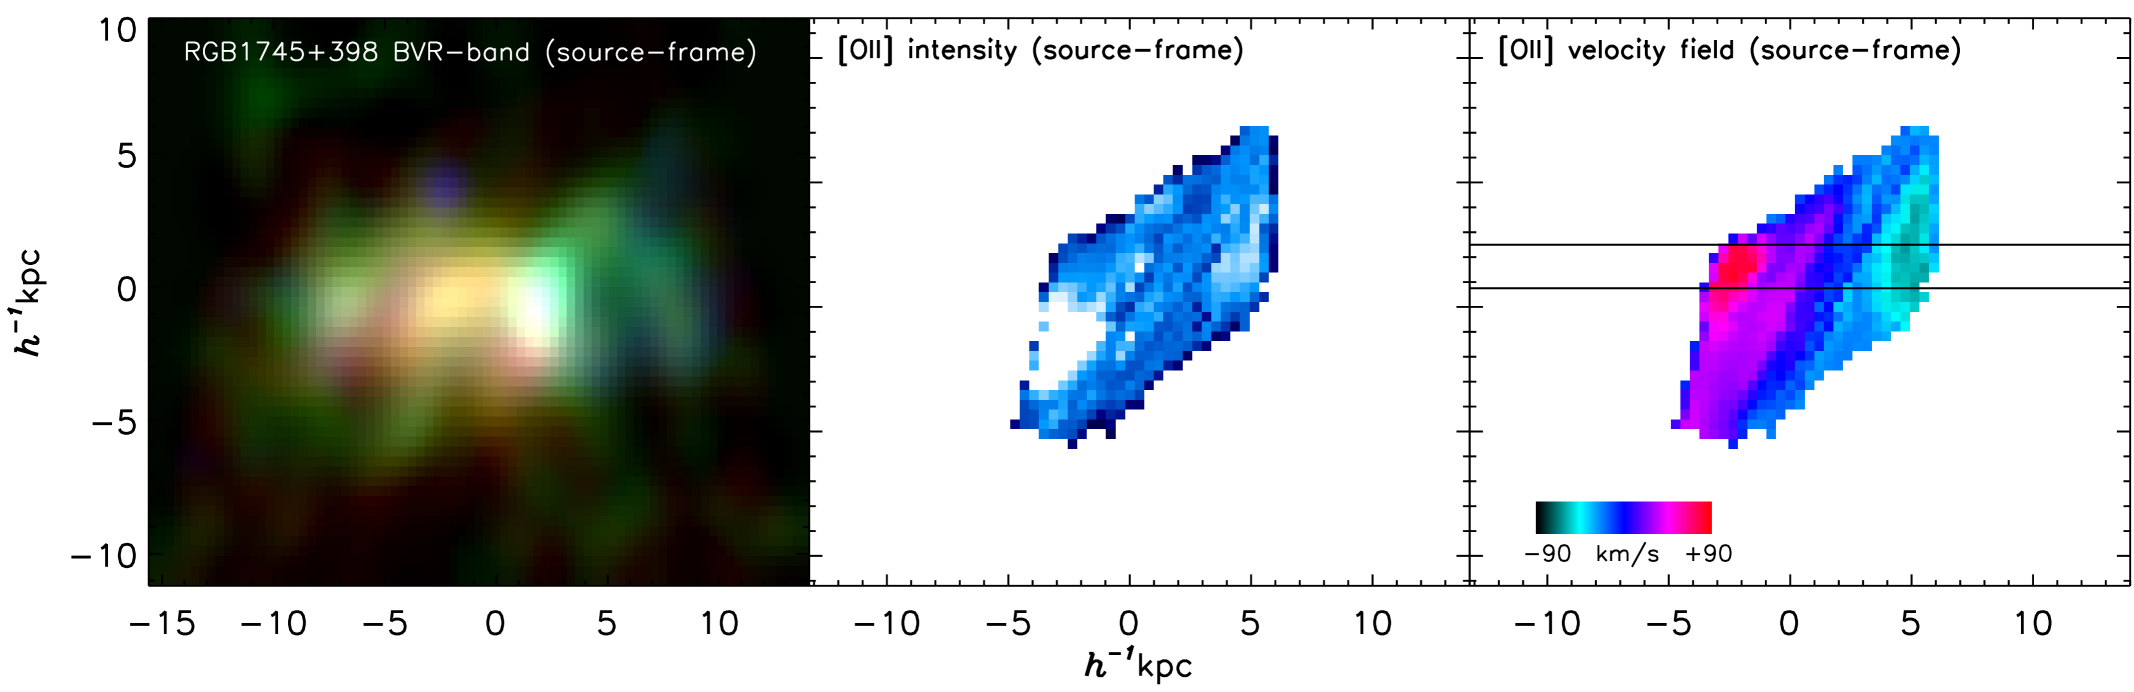
RGB 1745398 is qualitatively similar to Cl 223604 as a gravitational lens in that a straight blue arc lies between the BCG and the second brightest cluster galaxy (Fig. 1). The arc was first discovered by Nilsson et al. (1999) and spectroscopically confirmed to be at . Our new GMOS IFU observations confirm that the bright source to the North-West of the arc is a foreground cluster galaxy and is not part of the arc.
We construct a suite of lens models to explore the balance of mass between the dark matter halos centered on galaxies and in a manner analogous to that described in §3.2.3. The model parameters are constrained by the triply-imaged red arc discussed in §2.4, and the requirement to reproduce the observed morphology and velocity field of the blue arc. The best-fit model has , , although formally a very wide range of parameter space is allowed; the extrema models have , and , respectively. We note that is somewhat unphysical, however rather than invoke a prior we conservatively use the full range of models allowed by the data alone. The critical curve of the best-fit model is shown in Fig. 1.
The velocity map of this galaxy exhibits a strong velocity gradient. The IFU only covered the central regions of the galaxy (as can be seen in Fig. 1) with some low surface brightness emission lying outside the field of view. However, the velocity field (and rotation curve) is smooth and characteristic of a rotating system and gives a good indication of the terminal rotation velocity, which we determine to be . Using the family of models allowed by the data we derive a luminosity weighted magnification of (), a lensing corrected inclination angle of and an inclination corrected rotation velocity of .
4 Results
4.1 One-Dimensional Rotation Curves
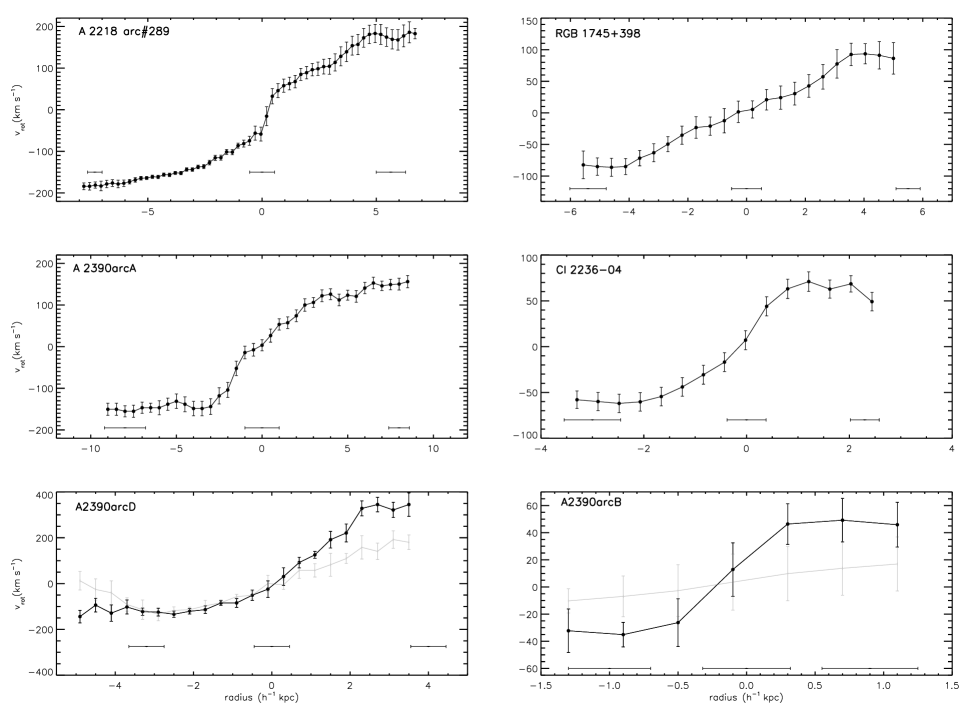
Having reconstructed the source frame morphologies and velocity fields of the lensed galaxies, we can extract the one-dimensional rotation curves in order to determine their asymptotic rotation speeds as well as more general issues such as how the rotation curve shapes compare with those in the local Universe. Our sample consists of six galaxies, the five presented in this paper, plus A 2218 arc#289 presented in Swinbank et al. (2003). In four of the lensed galaxies in our sample, A 2390arcA, A 2218 arc#289, Cl 2236-04arc and RGB 1745+398arc we identify and extract the major axis velocity profiles to measure the asymptotic rotation speed. This direction coincides with the maximum velocity gradient as we would expect in a rotating system. The other two galaxies, A 2390arcB and A 2390arcD have velocity fields which are not aligned with the major axis. Although the velocity field is not consistent with a simple rotating disk, we are still able to place limits on their masses using the velocity offsets between merging components (A 2390arcD) and the limits on velocity gradients/line widths (A 2390arcB).
In Fig. 7 we show the one dimensional rotation curves of the galaxies in our sample. These are extracted by sampling the velocity field with a slit approximately 1.5 kpc wide along the major axis cross section, as shown in the reconstructed velocity fields of the galaxies (Figs. 2-6). The zero-point in the velocity is defined using the center of the galaxy in the reconstructed source plane image. The error bars for the velocities are derived from the formal uncertainty in the velocity arising from Gaussian profile fits to the [Oii] emission in each averaged pixel of the datacube. We note that in the one-dimensional rotation curves in Fig. 7 alternate points show independent data. We also note that the data have not been folded about the zero velocity so that the degree of symmetry can be assessed in these plots. Horizontal bars show the effect of seeing, transformed into the source-plane. This illustrates how much the velocity field is smoothed by the seeing, and how the smearing varies along the arc.
4.2 Comparison to Local Populations
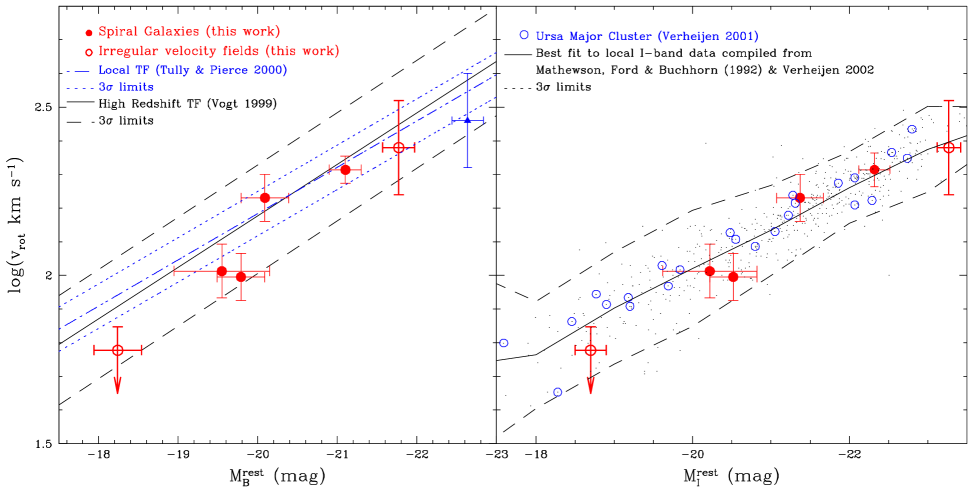
In Fig 8 we show the Tully-Fisher relation for the high redshift galaxies as compared to previous measurements of the TF in both low redshift (Pierce & Tully, 1992; Verheijen, 2001; Mathewson et al., 1992) and high redshift (Vogt, 1999) galaxy populations. Whilst Vogt (1999) and Mathewson et al. (1992) use optical spectra and Pierce & Tully (1992) and Verheijen (2001) use Hi line widths to measure the TF relation, as Mathewson et al. (1992) show, with high quality observations the rotation curve velocity determinations and Hi line widths are tightly correlated. Indeed, the scatter between and is typically less than 10 over a range of 60300 (); (Fig. 5 of Mathewson et al. 1992) and therefore it is useful to include the local Hi sets in our analysis.
The four galaxies with well defined rotation curves are shown as solid points. As can be seen the points suggest a good correlation between magnitude and rotations speed similar to that seen in the local Universe. By assuming the local slope of the TF from Tully & Pierce (2000) we measure an offset of =0.410.34mag of brightening in the rest-frame -band at fixed circular velocity and place a limit of 0.10mag of brightening in the rest-frame -band. As we discuss below, the small offset in the I-band TF relation is consistent with the evolution expected in heirachical galaxy formation models.
In order to plot the remaining two galaxies in Fig 8, we must estimate their circular velocity indirectly. A 2390arcB appears to be a low-mass Hii region, and we place a limit of 60 on any possible velocity gradient (this is also comparable to the [Oii] emission line FWHM). Since we are not able to constrain the inclination angle on this galaxy, we place this galaxy on the TF relation assuming it is edge on, but also include an error-bar which indicates a canonical inclination of 60∘. In the case of A 2390arcD, the galaxy is well resolved but does not show a coherent velocity field. In this case, we estimate the rotation speed by assuming the velocity gradient across the galaxy will eventually develop into regular rotation (it is also possible that this velocity offsets may develop into a velocity dispersion in an elliptical galaxy). The error-bars on the rotation of this galaxy then represent the uncertainty as to whether this galaxy is relaxed or merging, as well as an inclination correction assuming an inclination of 60∘ (as above).
This procedure allows us to show that the position of these point in the TF relation is reasonable given their optical and near-infrared brightness, however, the uncertainties in these rotation speed estimates are clearly large. These two galaxies should therefore be interpreted with caution. Nevertheless, if these two galaxies are included in the analysis we derive an offset of =0.510.28 and M0.10.
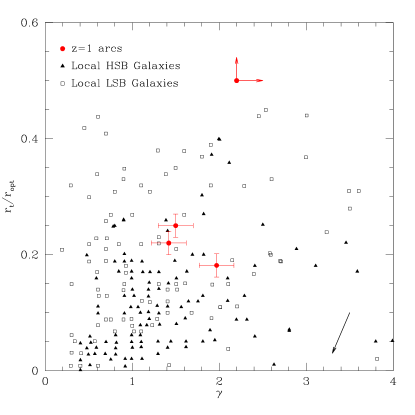
A key gain from studying lensed galaxies is the level of detail which we can extract from their rotation curves. For the four galaxies with well defined rotation curves, we can also compare the shapes of the rotation curves with those of local (z0.03) late-type spiral galaxies by Courteau (1997). This sample is dominated by late-type (Sb-Sc) spirals and therefore should provide a reasonable comparison sample. We fit the observed source-plane 1-D rotation curves in our sample with the arctan and multi-fit parameter models from Courteau (1997). Using a method the observed rotation curves are best fit with models with high values of and rt/ropt; (see Fig. 9). In this formalism, governs the degree of sharpness of the turn over of the rotation curve, rt describes the transition radius between the rising and flattening of the curve and ropt is the radius enclosing 83% of the light in the source plane photometry. We note that the rotation curve from the arc in RGB1745+398 is uncertain because the IFU field of view only just reaches the turn over, however, the data is sufficient to place a lower limit on and . Such models indicate slowly rising rotation curves and usually favor fainter (or low-surface brightness) galaxies, yet the source frame surface brightnesses of the four galaxies are consistent with high surface brightness (HSB) galaxies (=21.5, 21.2, 20.6 and 21.0 for A 2390arcA, Cl2236-04arc, A 2218 arc#289 and RGB 1745+398arc respectively). In order to investigate how sensitive the shape of the rotation curve is to the seeing we perform two checks: firstly, we convolve the rotation curve with a further 0.7′′ seeing (transformed to the source plane; Fig. 7) and refit the rotation curve. Whilst the results vary between the galaxy rotation curves, the overall effect is only modest at best. Typically, we find that the inner rotation curve flattens the transition radius by =0.05–0.08, and =0.05–0.09, and =0.18 in the arctan and multi-parameter fits respectively. Secondly, we generate mock rotation curves for both the arctan and multi-parameter fits with low values of and and convolve these with 0.7′′ seeing. For the values of and in the rotation curves in our data, we find that they could be affected by upto 0.06 (arctan), 0.5 (multi-param) and 0.09. In Fig 9 we therefore show arrow which shows the maximum effect which the seeing could have on the measured shapes of the rotation curves. Whilst this contributes to the shape parameters we find that in the local galaxy population, only about 25% of galaxies have similarly shaped rotation curves. This could be an indication that the inner parts of the galaxy mass distribution are less baryonically dominated than in local spirals and could be an indication that the bulge-to-disk mass ratio of these high redshift galaxies are lower than those of most present day galaxies.
5 Discussion and Conclusions
In this study we have mapped the two dimensional velocity fields of six gravitationally lensed galaxies using IFU spectroscopy. Using detailed mass models for the clusters we have reconstructed the source morphologies of these galaxies. The typical boost in magnitude for these galaxies is , which means the typical (unlensed) -band magnitude of our sample of m. Moreover, the gain in spatial magnification for a typical galaxy in this paper means that 0.6′′ on the sky corresponds to only 0.5 kpc in the source frame which allows us to spatially resolve the dynamics of these galaxies on much smaller scales than otherwise possible. Our IFU spectroscopy of these distant galaxies allows us to test whether these high redshift galaxies have regular disk-like kinematics, or whether velocity offsets come from merging components or other dynamical disturbance.
With a small sample of high redshift galaxies which show bi-symmetric (disk-like) kinematics we can measure the evolution of the offset in the TF relation under the assumption that the slope remains fixed. In Fig. 8, we compare the rotation velocities and source brightness of the arcs which resemble galaxy disks with that of local and other high redshift galaxies in rest frame and -bands. We also include the A 2390arcB and A 2390arcD in this plot. Whilst these two galaxies do not resemble rotating disks and therefore cannot be compared directly to local disks, we show the likely range of equivalent circular velocities based on the upper limit to the velocity dispersion (A 2390arcB) and assuming that the two components are on a merging orbit (A 2390arcD). These data points are of course highly uncertain, not least because we have no way to estimate their inclinations on the sky.
Whilst previous high redshift studies have concentrated on the rest-frame -band, rest-frame -band observations provide a more rigorous test of evolution of the TF relation since the corrections for dust and on-going star formation are much smaller at longer wavelengths (Conselice et al., 2005). The rest frame -band TF therefore gives a clearer indication of the true stellar luminosity and hence the ratio of stellar mass to total halo mass. The position of the galaxies on the TF relation in both the and -bands shows good agreement with local data (Pierce & Tully, 1992; Mathewson et al., 1992; Haynes et al., 1999; Verheijen, 2001). This data is in agreement with existing intermediate and high redshift studies, (Vogt et al., 1997; Vogt, 1999; Vogt et al., 2002; Ziegler et al., 2002; Milvang-Jensen et al., 2003; Barden et al., 2003; Böhm et al., 2003; Bamford et al., 2005; Conselice et al., 2005). Overall, our observations suggest a 0.50.3mag of brightening in the -band TF from the local () correlation, whilst in the -band we place a limit of mag between our sample and the local correlation.
The theoretical evolution of the -band TF relation from hierarchical models of galaxy formation from Cole et al. (2000) predict that for any given disk circular velocity, the band luminosity should decrease by magnitudes from to , whilst in the -band such models predict an increase in luminosity of magnitude for the same redshift change. It is useful to compare this prediction with the prediction for a simple “classical” galaxy formation. We consider a model in which all of the galaxy’s mass were already in place at , but only half of the stars have yet formed (Eggen et al., 1962; Hopkins et al., 2000). This toy model produces an evolution in luminosity of magnitudes from to , during which the asymptotic circular velocity remains constant. The small offset of our galaxies from the local -band TF relation suggests a preference for hierarchical rather than the “classical” formation model. Furthermore, the 0.510.28 magnitude evolution in the rest-frame -band is in line with the increased star formation activity at suggested by studies of the B-band luminosity function (Giallongo et al., 2005).
Clearly, it would be dangerous to draw far reaching conclusions from a small number of high-redshift galaxies. Rather this study should be view as a companion to studies of a larger samples of field galaxies (e.g. Flores et al., 2004). The advantage of our lensed study is that we are able to resolve rotation curves in detail and clearly identify the asymptotic velocity of the rotation curve rather than fitting a model rotation curve (based on local galaxies) convolved with ground based seeing. In contrast to many ground based studies our rotation measurements extend to large radii allowing asymptotic velocities to be directly measured.
The present sample is just large enough to place constraints on the evolution of the TF relation, but a significantly larger sample of galaxies are accessible to observation using the gravitational telescope technique we have illustrated (there are currently a further 10 highly magnified and spatially resolved z1 giant arcs in the literature which are suitable for this study; Sand et al. 2005).
However, the principle gain from studying distant galaxies using gravitational telescopes is to study the internal properties of the galaxies in detail. In principle, the boost from gravitational lensing allows us to achieve an angular resolution to galaxies observed with classical techniques at 0.1 (e.g. for a typical 1 gravitationally lensed galaxy in this sample, the spatial sampling of a galaxy is a factor of three smaller than unlensed galaxies at the same redshift; by contrast this spatial sampling is matched to unlensed galaxies at 0.15). This increase in resolution allows us to study the dynamics, metal abundance and star formation of 1 galaxies in detail and hence address why the global properties of distant galaxies differ from their local counter parts.
In this paper, we restrict our attention to the dynamics of the target systems. For those galaxies with well defined rotation curves we can use the gravitational magnification to compare the shapes of the rotation curves with those of local (z0.03) spiral galaxies observed by Courteau (1997). We fit the observed source-plane 1-D rotation curve with the arctan and multi-fit parameter models from Courteau (1997). Using a fit the observed rotation curves are best fit with models with high values of and rt/ropt. The fits from these models show that the high redshift targets have slowly rising rising rotation curves compared to typical local galaxies. In the local Universe, such rotation curves are associated with fainter, low-surface brightness galaxies, yet the source frame surface brightnesses of the four galaxies are consistent with high surface brightness (HSB) galaxies. In the local galaxy population, only about 25% of galaxies have similarly shaped rotation curves and could be an indication that the bulge masses of these high redshift galaxies is somewhat lower than those at the present day.
The dynamics of two of the galaxies in our sample do not resemble galaxy disks. The first, A 2390arcB appears to be a highly magnified Hii galaxy, with a velocity dispersion of and a (source frame) radius of 2.5 kpc (FWHM). The other galaxy in our sample which does not appear to have stable disk kinematics is A 2390arcD. This galaxy has a disturbed morphology and appears to have several components. When combined with the velocity field from the [Oii] emission, we find some evidence for rotation or interaction. The large [Oii] line widths ( FWHM) may originate from either outflowing material driven by AGN activity, or as a result of two interacting galaxies. This second scenario is supported by the fact that we also identify a bright knot, or companion offset by 5 kpc and 48060 in projection; the most likely interpretation of the system is that this galaxy has recently undergone a tidal interaction/merger which has produced the disturbed and complex morphology. The selection criteria for our analysis was simply that the galaxies must be highly amplified, and therefore it is interesting to note that although we only have a small sample, of the six galaxies we have studied, two do not have disk-like kinematics or morphologies, giving some indication as to the mix of stable disk-like galaxies to currently assembling galaxies at 1.
The next step in this study is to complement these observations with similar observations in the near-infrared. At 1, H, [Oiii] and H are redshifted to beyond 1m and until recently have been inaccessible to Integral Field Spectroscopy (IFS). However, recent developments in designing efficient image slicing IFU’s allow us to probe beyond 1m, and therefore we can combine the rest-frame optical emission lines to probe the distribution of reddening through the well studied index; =([Oii]+[Oiii])/H (Zaritsky et al., 1994), as well as the reddening corrected star formation rates through the H:H decrement. For those galaxies which we have identified as disk-like at 1, such observations will give unique insight into the processes of disk galaxy formation, and give important constraints on the assembly on the disks of present day galaxies.
The gain in spatial resolution which we have achieved by using a gravitational lens to magnify and stretch distant galaxies demonstrates the science that will soon be possible with Adaptive Optics Integral Field Spectroscopy (AO-IFS) on (non-lensed) galaxies at (e.g. OSIRIS on Keck, NIFS on Gemini and SINFONI on the VLT). These studies will probe the structure of young galaxies on 100milli-arcsecond (mas) scales, although long exposures will be required to compensate for the lack of lensing amplification. For a non-lensed source at , this corresponds to 600pc. However, the greatest gains will come from combining AO-IFS with the powerful gravitational lensing technique. For a lensed galaxy with magnification factor of ten in flux (a factor of three in linear scale), the effective diffraction limit of the telescope is reduced by a factor three and 100mas corresponds to only 200pc in the source frame of the galaxy, sufficient to resolve the star-formation, kinematic and chemical properties of individual Hii regions (which typically have sizes less than 400pc in local spiral galaxies; Gonzalez Delgado & Perez 1997). We look forward to undertaking these studies in the coming years.
acknowledgments
We are very grateful to the anonymous referee for providing a number of suggestions which significantly improved the content, layout and clarity of this paper. We would like to thank Kari Nilsson for allowing us to use his imaging data of RGB 1745+398, and Alastair Edge, John Lucey, Chris Simpson and Russel Smith for useful discussions. We would also like to thank the Gemini-North staff who observed our targets in queue mode in 2003A. GPS thanks Phil Marshall and Keren Sharon for assistance with the Keck/LRIS observations and David Sand for assistance with the Hale/WIRC observations. GPS also acknowledges the Caltech Optical Observatories TAC for enthusiastically supporting his program of galaxy cluster observations. AMS acknowledges support from a PPARC Fellowship, RGB acknowledges a PPARC Senior Fellowship, GPS acknowledges support from Caltech and a Royal Society University Research Fellowship, IRS acknowledges support from the Royal Society and JPK thanks support from CNRS and Caltech for their support.
References
- Allington-Smith et al. (2002) Allington-Smith, J., Murray, G., Content, R., Dodsworth, G., Davies, R., Miller, B. W., Jorgensen, I., Hook, I., Crampton, D., & Murowinski, R. 2002, PASP, 114, 892
- Böhm et al. (2003) Böhm, A., Ziegler, B. L., Fricke, K. J., & FDF Team, t. 2003, APSS, 284, 689
- Bamford et al. (2005) Bamford, S. P., Milvang-Jensen, B., Aragón-Salamanca, A., & Simard, L. 2005, MNRAS, 361, 109
- Barden et al. (2003) Barden, M., Lehnert, M. D., Tacconi, L., Genzel, R., White, S. D., & Franchesini, A. 2003, astro-ph/0302392
- Bertin & Arnouts (1996) Bertin, E. & Arnouts, S. 1996, AAPS, 117, 393
- Bolzonella et al. (2000) Bolzonella, M., Miralles, J.-M., & Pelló, R. 2000, A&AP, 363, 476
- Campusano et al. (2001) Campusano, L. E., Pelló, R., Kneib, J.-P., Le Borgne, J.-F., Fort, B., Ellis, R., Mellier, Y., & Smail, I. 2001, A&AP, 378, 394
- Cavanagh et al. (2003) Cavanagh, B., Hirst, P., Jenness, T., Economou, F., Currie, M. J., Todd, S., & Ryder, S. D. 2003, in ASP Conf. Ser. 295: Astronomical Data Analysis Software and Systems XII, 237
- Cole et al. (2000) Cole, S., Lacey, C. G., Baugh, C. M., & Frenk, C. S. 2000, MNRAS, 319, 168
- Conselice et al. (2005) Conselice, C. J., Bundy, K., Ellis, R. S., Brichmann, J., Vogt, N. P., & Phillips, A. C. 2005, ApJ, 628, 160
- Courteau (1997) Courteau, S. 1997, AJ, 114, 2402
- Ebbels et al. (1998) Ebbels, T., Ellis, R., Kneib, J., Leborgne, J., Pello, R., Smail, I., & Sanahuja, B. 1998, MNRAS, 295, 75
- Edge et al. (2003) Edge, A. C., Smith, G. P., Sand, D. J., Treu, T., Ebeling, H., Allen, S. W., & van Dokkum, P. G. 2003, ApJL, 599, L69
- Eggen et al. (1962) Eggen, O. J., Lynden-Bell, D., & Sandage, A. R. 1962, ApJ, 136, 748
- Ellis et al. (2001) Ellis, R., Santos, M. R., Kneib, J., & Kuijken, K. 2001, ApJL, 560, L119
- Flores et al. (2004) Flores, H., Puech, M., Hammer, F., Garrido, O., & Hernandez, O. 2004, A&AP, 420, L31
- Franx et al. (1997) Franx, M., Illingworth, G. D., Kelson, D. D., van Dokkum, P. G., & Tran, K. 1997, ApJL, 486, L75
- Frye & Broadhurst (1998) Frye, B. & Broadhurst, T. 1998, ApJL, 499, L115
- Giallongo et al. (2005) Giallongo, E., Salimbeni, S., Menci, N., Zamorani, G., Fontana, A., Dickinson, M., Cristiani, S., & Pozzetti, L. 2005, ApJ, 622, 116
- Gonzalez Delgado & Perez (1997) Gonzalez Delgado, R. M. & Perez, E. 1997, APJS, 108, 199
- Guzman et al. (1996) Guzman, R., Koo, D. C., Faber, S. M., Illingworth, G. D., Takamiya, M., Kron, R. G., & Bershady, M. A. 1996, ApJL, 460, L5
- Hawarden et al. (2001) Hawarden, T. G., Leggett, S. K., Letawsky, M. B., Ballantyne, D. R., & Casali, M. M. 2001, MNRAS, 325, 563
- Haynes et al. (1999) Haynes, M. P., Giovanelli, R., Salzer, J. J., Wegner, G., Freudling, W., da Costa, L. N., Herter, T., & Vogt, N. P. 1999, AJ, 117, 1668
- Hopkins et al. (2000) Hopkins, A. M., Connolly, A. J., & Szalay, A. S. 2000, AJ, 120, 2843
- Kauffmann et al. (1994) Kauffmann, G., Guiderdoni, B., & White, S. D. M. 1994, MNRAS, 267, 981
- Kneib et al. (2004) Kneib, J., Ellis, R. S., Santos, M. R., & Richard, J. 2004, ApJ, 607, 697
- Kneib (1993) Kneib, J.-P. 1993, Ph.D. Thesis, Université Paul Sabatier, Toulouse, France
- Kneib et al. (1996) Kneib, J.-P., Ellis, R. S., Smail, I., Couch, W. J., & Sharples, R. M. 1996, ApJ, 471, 643
- Kneib et al. (1994) Kneib, J. P., Melnick, J., & Gopal-Krishna. 1994, A&AP, 290, L25
- Mathewson et al. (1992) Mathewson, D. S., Ford, V. L., & Buchhorn, M. 1992, APJS, 81, 413
- Melnick et al. (1993) Melnick, J., Altieri, B., Gopal-Krishna, & Giraud, E. 1993, A&AP, 271, L5
- Milvang-Jensen et al. (2003) Milvang-Jensen, B., Aragón-Salamanca, A., Hau, G. K. T., Jørgensen, I., & Hjorth, J. 2003, MNRAS, 339, L1
- Nilsson et al. (1999) Nilsson, K., Takalo, L. O., Pursimo, T., Sillanpää, A., Heidt, J., Wagner, S. J., Laurent-Muehleisen, S. A., & Brinkmann, W. 1999, A&AP, 343, 81
- Oke (1990) Oke, J. B. 1990, AJ, 99, 1621
- Oke et al. (1995) Oke, J. B., Cohen, J. G., Carr, M., Cromer, J., Dingizian, A., Harris, F. H., Labrecque, S., Lucinio, R., Schaal, W., Epps, H., & Miller, J. 1995, PASP, 107, 375
- Pelló et al. (1999) Pelló, R., Kneib, J. P., Le Borgne, J. F., Bézecourt, J., Ebbels, T. M., Tijera, I., Bruzual, G., Miralles, J. M., Smail, I., Soucail, G., & Bridges, T. J. 1999, A&AP, 346, 359
- Pello et al. (1992) Pello, R., Le Borgne, J. F., Sanahuja, B., Mathez, G., & Fort, B. 1992, A&AP, 266, 6
- Pello et al. (1991) Pello, R., Sanahuja, B., Le Borgne, J., Soucail, G., & Mellier, Y. 1991, ApJ, 366, 405
- Pierce & Tully (1992) Pierce, M. J. & Tully, R. B. 1992, ApJ, 387, 47
- Ramsay Howat et al. (1998) Ramsay Howat, S. K., Ettedgui-Atad, E., Bennett, R. J., Bridger, A., Content, R., Ellis, M. A., Hastings, P. R., Strachan, M., Wall, R., & Wells, M. 1998, in Proc. SPIE Vol. 3354, p. 456-467, Infrared Astronomical Instrumentation, Albert M. Fowler; Ed., 456–467
- Sand et al. (2005) Sand, D. J., Treu, T., Ellis, R. S., & Smith, G. P. 2005, ApJ, 627, 32
- Smail et al. (1996) Smail, I., Dressler, A., Kneib, J., Ellis, R. S., Couch, W. J., Sharples, R. M., & Oemler, A. J. 1996, ApJ, 469, 508
- Smith (2002) Smith, G. P. 2002, Ph.D. Thesis, University of Durham, UK
- Smith et al. (2005) Smith, G. P., Kneib, J.-P., Smail, I., Mazzotta, P., Ebeling, H., & Czoske, O. 2005, MNRAS, 359, 417
- Smith et al. (2002) Smith, G. P., Smail, I., Kneib, J.-P., Davis, C. J., Takamiya, M., Ebeling, H., & Czoske, O. 2002, MNRAS, 333, L16
- Swinbank et al. (2003) Swinbank, A. M., Smith, J., Bower, R. G., Bunker, A., Smail, I., Ellis, R. S., Smith, G. P., Kneib, J.-P., Sullivan, M., & Allington-Smith, J. 2003, ApJ, 598, 162
- Teplitz et al. (2000) Teplitz, H. I., McLean, I. S., Becklin, E. E., Figer, D. F., Gilbert, A. M., Graham, J. R., Larkin, J. E., Levenson, N. A., & Wilcox, M. K. 2000, ApJL, 533, L65
- Tully & Fisher (1977) Tully, R. B. & Fisher, J. R. 1977, A&AP, 54, 661
- Tully & Pierce (2000) Tully, R. B. & Pierce, M. J. 2000, ApJ, 533, 744
- Verheijen (2001) Verheijen, M. A. W. 2001, ApJ, 563, 694
- Vogt (1999) Vogt, N. P. 1999, in ASP Conf. Ser. 193: The Hy-Redshift Universe: Galaxy Formation and Evolution at High Redshift, 145
- Vogt et al. (2002) Vogt, N. P., Phillips, A. C., Deep Extragalactic Evolutionary Probe (DEEP) Collaboration, European Network on the Formation, & Evolution of Galaxies (TMR) Collaboration. 2002, American Astronomical Society Meeting, 200, 0
- Vogt et al. (1997) Vogt, N. P., Phillips, A. C., Faber, S. M., Gallego, J., Gronwall, C., Guzman, R., Illingworth, G. D., Koo, D. C., & Lowenthal, J. D. 1997, ApJL, 479, L121
- White & Frenk (1991) White, S. D. M. & Frenk, C. S. 1991, ApJ, 379, 52
- Wilson et al. (2003) Wilson, J. C., Eikenberry, S. S., Henderson, C. P., Hayward, T. L., Carson, J. C., Pirger, B., Barry, D. J., Brandl, B. R., Houck, J. R., Fitzgerald, G. J., & Stolberg, T. M. 2003, in Instrument Design and Performance for Optical/Infrared Ground-based Telescopes. Edited by Iye, Masanori; Moorwood, Alan F. M. Proceedings of the SPIE, Volume 4841, pp. 451-458 (2003)., 451–458
- Zaritsky et al. (1994) Zaritsky, D., Kennicutt, R. C., & Huchra, J. P. 1994, ApJ, 420, 87
- Ziegler et al. (2002) Ziegler, B. L., Böhm, A., Fricke, K. J., Jäger, K., Nicklas, H., Bender, R., Drory, N., Gabasch, A., Saglia, R. P., Seitz, S., Heidt, J., Mehlert, D., Möllenhoff, C., Noll, S., & Sutorius, E. 2002, ApJL, 564, L69