Where are the “Missing” Galactic Baryons?
Abstract
Based on 19 high-resolution N-body/gasdynamical galaxy formation simulations in the CDM cosmology it is shown, that for a galaxy like the Milky Way, in addition to the baryonic mass of the galaxy itself, about 70% extra baryonic mass should reside around the galaxy (inside of the virial radius), chiefly in the form of hot gas. Averaging over the entire field galaxy population, this “external” component amounts to 64-85% of the baryonic mass of the population itself. These results are supported by the recent detection of very extended, soft X-ray emission from the halo of the quiescent, massive disk galaxy NGC 5746. Some of the hot gas may, by thermal instability, have condensed into mainly pressure supported, warm clouds, similar to the Galactic High Velocity Clouds (HVCs). Based on an ultra-high resolution cosmological test simulation of a Milky Way like galaxy (with a gas particle mass and gravity softening length of only 7.6x10³ and 83pc, respectively), it is argued, that the hot gas phase dominates over the warm gas phase, in the halo. Finally, an origin of HVCs as “leftovers” from filamentary, “cold” accretion events, mainly occurring early in the history of galaxies, is proposed.
Subject headings:
cosmology: theory – galaxies: formation – methods: numerical1. Introduction
In the CDM cosmology a disk galaxy like the Milky Way will have a virial mass of 8x10. For a universal baryon fraction 0.15, one would expect the baryonic mass of the Milky Way to be 1.2x10, assuming that the bulk of the baryonic material inside of ( 250 kpc) is deposited onto the central galaxy. However, the baryonic mass (stars + cold gas) of the Milky Way is found to be just 6x10 (e.g., Dehnen & Binney 1998; Sommer-Larsen & Dolgov 2001), so an amount of baryonic mass, as large as the actual mass of the Milky Way itself, appears to be “missing” (e.g., Silk 2004, Maller & Bullock 2004).
On the other hand, on theoretical grounds it has been known for long that galaxies (not only in groups and clusters, but also in the “field”) should be embedded in extended haloes of hot gas (e.g., White & Frenk 1991; Sommer-Larsen 1991), and evidence for hot, dilute gas in the Galactic halo is quite strong (e.g., Sembach et al. 2003). Searches for X-ray emission from the haloes of external, quiescent disk galaxies have until very recently proved unsuccessful (as opposed to star-burst galaxies, e.g., Strickland et al. 2002), which has been taken as an indication that the baryonic mass of such hot haloes is insignificant, due to, e.g., strong AGN driven hot gas outflows at some point during galaxy formation (e.g., Benson et al. 2000).
Based on recent cosmological simulations of disk galaxy formation (not invoking violent AGN feedback) Toft et al. (2002) showed, however, that the X-ray null detections were to be expected. Moreover, they showed that the X-ray luminosity of disk galaxy haloes is expected to be a very steep function of the characteristic circular speed, roughly as . Very recently Pedersen et al. (2006) observed the massive, quiescent, isolated and edge-on, disk galaxy NGC5746 ( km/s), and detected hot halo soft (0.4 keV) X-ray emission at the level predicted by the numerical models (see also Rasmussen et al. 2006 for more detail). As the mass of hot gas inside of for such a galaxy is predicted to be 80% of that of the central galaxy, and the total “external” baryonic mass fraction 110% (section 3), it is clearly of interest to estimate the global external baryonic mass-fraction, averaged over the entire field galaxy population. This is the aim of this Letter: in sec. 2 the code and simulations are briefly described, the results obtained are presented in sec.3, and discussed in sec.4. Issues like formation of warm, mainly pressure supported clouds (“High Velocity Clouds”) through thermal instability of hot halo gas, are also addressed111For images, and an HVC animation, see http://www.tac.dk/~jslarsen/HVC.
2. THE CODE AND SIMULATIONS
The code used for the simulations is a significantly improved version of the TreeSPH code, which has been used previously for galaxy formation simulations (Sommer-Larsen, Götz & Portinari 2003, SLGP03). The main improvements over the previous version are: (1) The “conservative” entropy equation solving scheme suggested by Springel & Hernquist (2002) has been adopted. (2) Non-instantaneous gas recycling and chemical evolution, tracing 10 elements (H, He, C, N, O, Mg, Si, S, Ca and Fe), has been incorporated in the code following Lia et al. (2002a,b); the algorithm includes supernovæ of type II and type Ia, and mass loss from stars of all masses. (3) Atomic radiative cooling depending both on the metal abundance of the gas and on the meta–galactic UV field, modeled after Haardt & Madau (1996) is invoked, as well as simplified treatment of radiative transfer, switching off the UV field where the gas becomes optically thick to Lyman limit photons on scales of 1 kpc.
For the present project, the formation and evolution of 15 individual galaxies, known from previous work to become disk galaxies at =0, was simulated with the above, significantly improved, TreeSPH code. At least two different numerical resolutions were used to simulate each galaxy. Moreover, many of the galaxies were also simulated with different physical prescriptions for the early () star-bursts (and related SNII driven energy feedback) found previously to be required, in order to produce realistic disk galaxies. The 15 galaxies were selected from a cosmological LCDM simulation (see below) to represent “field” galaxies, by requiring each galaxy to be at least 1 Mpc from any galaxy group, and at least 0.5 Mpc away from any larger galaxy, at =0. The disk galaxies span a range of characteristic circular speeds of km/s, and a range of virial masses of 6x10¹⁰ to 3x10.
The galaxies (galaxy DM haloes) were selected from a cosmological, DM-only simulation of box-length 10 Mpc (comoving), and starting redshift =39. The adopted cosmology was the flat CDM model, with (, )=(0.3,0.7).
Mass and force resolution was increased in Lagrangian regions enclosing the galaxies, and in these regions all DM particles were split into a DM particle and a gas (SPH) particle according to an adopted universal baryon fraction of =0.15, in line with recent estimates. In this paper, only results of high-resolution simulations, consisting of at least 1.5x10⁵ SPH+DM particles, will be presented (with typical numbers in the range 2-3x10⁵). Comparison to simulations of lower and very high resolution, respectively, will be discussed, though. For galaxies of km/s, == 9.1x10⁴ and =5.2x10⁵ M⊙. Moreover, gravitational (spline) softening lengths of ==190 and =340 pc, respectively, were adopted. For galaxies of km/s, == 7.3x10⁵ and =4.2x10⁶ M⊙, and ==380 and =680 pc. In addition, two galaxies of =180 and 244 km/s, respectively, were re-simulated with the smaller particle masses and gravity softenings above. These very high resolution runs consisted of 1.2 and 2.2 million particles. The gravity softening lengths were fixed in physical coordinates from =6 to =0, and in comoving coordinates at earlier times.
A Kroupa IMF was used in the simulations, and early rapid and self-propagating star-formation (sometimes dubbed “positive feedback”) was invoked (SLGP03). Finally, in order to enable some reuse of previous work, values of =0.65 and =1.0 were employed in the cosmological simulations. These values are slightly different from the and , currently favored. To check the effect of this, one simulation was undertaken with and .
3. RESULTS
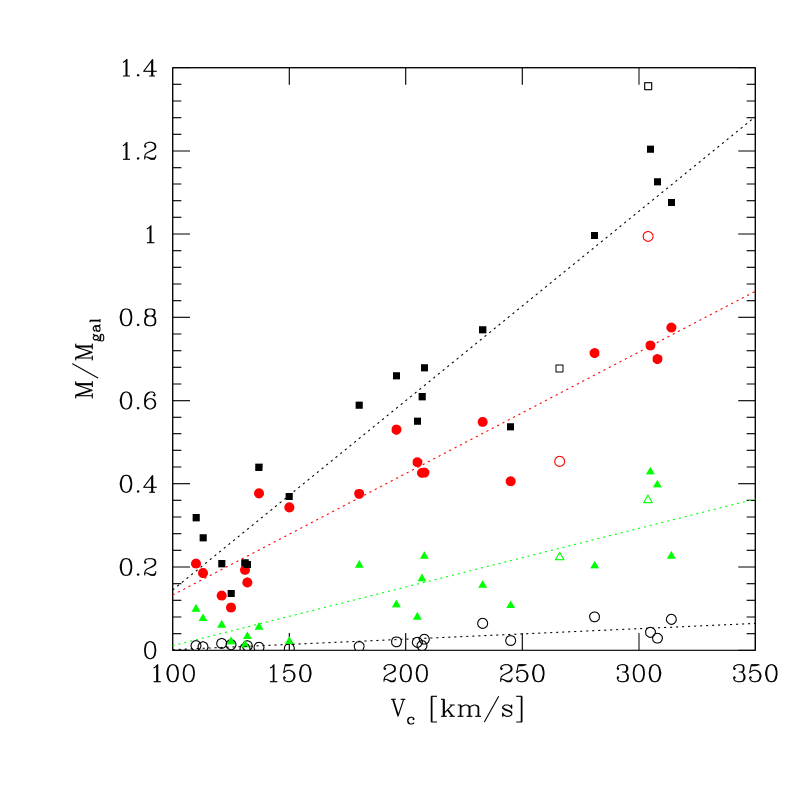
A detailed analysis of the simulation results, in general, will be given elsewhere, e.g., Portinari & Sommer-Larsen (2006); here emphasis will be just on “external” baryonic mass-fractions: For each disk galaxy simulation the distribution of baryonic mass, at =0 and inside of the virial radius, was classified as follows: 1) disk+bulge stars ( kpc, kpc), 2) inner halo stars ( kpc; not in the above region), 3) stellar satellites/outer halo (, and not in the above regions), 4) gas in the galaxy (mainly “cold”: x K; same region as for the disk+bulge stars), 5) outer hot gas (x K; , outside disk+bulge region), and 6) outer cold gas (; outside disk+bulge region). The hot gas is typically at , and hence, in general, much hotter than 3x10⁴ K.
The simple estimate of the galactic baryonic mass would be the combined mass of components 1 and 4. In Fig.1 is shown, for 19 high-resolution disk galaxy simulations, the mass of the other components relative to this baryonic galaxy mass. Components 3 and 6 have been combined, since most of the “external” cold gas is located in satellite galaxies. As can be seen, the importance of the three resulting “external” components increases with : at 100 km/s, the external baryonic mass-fraction is only about 20%, at 220 km/s (like the Milky Way) this fraction increases to 70%, and at 300 km/s it is about a factor 1.1. At all , the hot gas is the dominant external component.
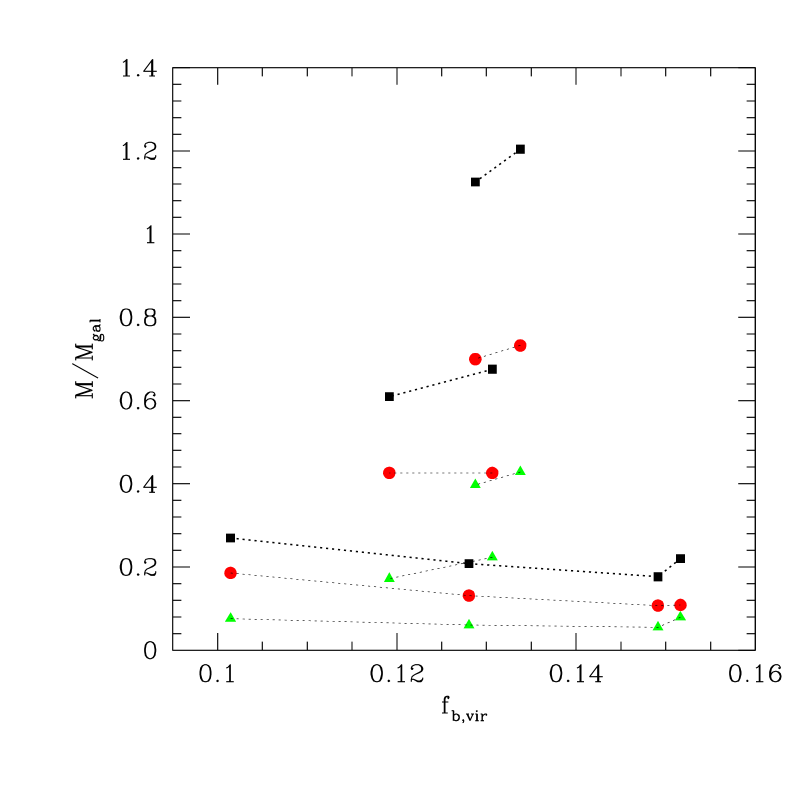
Before inferring the implications of these results, their dependence on the physics invoked in the simulations, as well as on numerical resolution, should be assessed. To this end is compared in Fig.2 the results of various simulations of three galaxies, all run at high resolution, with different prescriptions for SNII feedback. For a small galaxy, of 110 km/s, is shown results for four different simulations: two with early, self-propagating star-formation (SPSF), and associated strong feedback (for two different threshold densities =0.1 and 0.25 cm-3; SLGP03), one with early fast star-formation, but no SPSF (this reduces the early feedback considerably), and one with no early fast star-formation at all (this corresponds to the very weak feedback case). Fig.2 shows that a) the stronger the feedback the smaller is the resulting baryon fraction inside of the virial radius, and b) the quantities shown in Fig.1 are quite robust to such a dramatic change of feedback physics (the two lower feedback simulations result in galaxies with smaller specific angular momenta and stellar disks, which are kinematically too hot compared to observed disks — hence the results for these have not been included in Fig.1). Also shown are data for SPSF simulations, with the above two thresholds, for 205 km/s and a 305 km/s galaxies, respectively. As can be seen, these results are quite robust as well.
To test for resolution effects, results for 7 galaxies with in the range 170-250 km/s, run at low resolution (the main one of SLGP03) and high resolution, but identical feedback descriptions, were compared. It was found that the hot gas fraction decreased by 284%, and the total “external” baryonic mass fraction by 186%, increasing the mass resolution by a factor of eight, and the force resolution by a factor of two. For a single galaxy of 305, the corresponding numbers were 23 and 13%. To test the effects of going to very high resolution, results for two galaxies, of =180 and 244 km/s, were compared at 1 and 2, respectively (results at =0 were not available, but at both redshifts gas cool-out and star formation is very well underway). It was found that in going from high to very high resolution, the hot gas fraction is reduced only by about 5% more, and the total external baryon fraction did not change at all. On basis of the above, only simulations run at high resolution were used in the present analysis.
4. Discussion
To estimate the global importance of the external baryons in the mass budget of disk galaxies, the global distribution of disk galaxy circular velocities (the “velocity function”) is required. Galaxy velocity functions have been estimated by, e.g., Gonzalez et al. (2000) and Desai et al. (2004). Most published velocity functions refer to the general morphological mix of disk, lenticular and elliptical galaxies, in the field or in clusters, but Gonzalez et al. (2000) give an expression for field disk galaxies, viz.
| (1) |
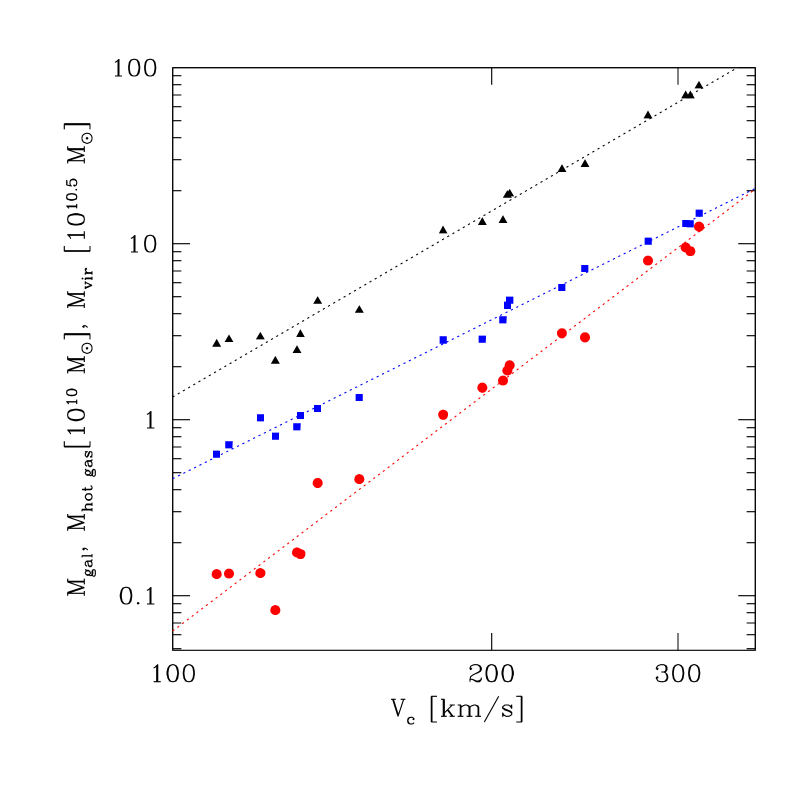
where Mpc-3, , =2.5 and km/s. Next, one has to determine the relation between and the combined baryonic mass of the disk+bulge stars and gas in the galaxy. In Fig.3 this relation is shown for the 19 high resolution simulations. The relation is very well fitted by a power law
| (2) |
Thirdly, the external baryonic mass-fraction, , is parameterized as a function of by a linear fit to the data shown in Fig.1, resulting in
| (3) |
The fit is valid in the range 100-330 km/s, and extrapolates to zero at =68 km/s; in the following =0 is assumed for km/s, to obtain a lower limit to the global baryonic external mass-fraction (actually, at 100 km/s, is expected to start increasing with decreasing , as SNII feedback increasingly suppresses gas cool-out and star-formation: for a 3x10⁵ particle simulation of a =41 km/s galaxy, an external baryon fraction of 1.4 was found).
The globally averaged external baryonic mass-fraction can now be expressed as
| (4) |
where is the maximum circular speed of disk galaxies. Using eqs.[1]-[3], and assuming =350 km/s (disk galaxies of such circular speeds are certainly observed), =0.64 is obtained. Increasing to 500 km/s (which must be considered an observational upper limit), results in an increase of to 0.72. Fitting to the various external components individually, shows that hot gas contributes 70% to , inner halo stars 5%, and outer halo stars, satellite stars and cold gas in satellites 25%. Assuming that the above results on external mass fractions also apply to field elliptical/lenticular galaxies (see Fig.1), and applying the field galaxy velocity function of Desai et al. (2004), increases the estimate of to 0.72 and 0.85, for =350 and 500 km/s, respectively (in principle, very strong AGN feedback, not included in the current simulations, could lower hot gas fractions of E/S0 galaxies; on the other hand E/S0s are (contrary to disk galaxies), in general, observed to be embedded in hot gas haloes). Finally, since, in particular, the larger galaxies host a number of smaller galaxies within , the velocity functions should actually be reduced accordingly at the low end. Hence, the above estimates are, in fact, lower limits.
The above results, taken at face value, provide the explanation why only about half of the baryonic mass, inside of the virial radius of galaxies like the Milky Way, is actually found in stars and cold gas in the galaxies. Given the ramifications of this result, it is important to test its robustness: Although 0.15 is indicated by standard big bang nucleosynthesis, various CMB results and direct measurements of in galaxy clusters, lower values are still not excluded. To test the effect of adopting 0.10, five galaxies were re-simulated with this value, at the resolution of SLGP03. The results of these 5 simulations were compared to a sample of 39 simulations run with 0.15 at the resolution of SLGP03. It is found that hot gas fractions, as well as total external baryonic mass fractions, increase by 30-50% (at a given ) going from 0.15 to 0.10. This is mainly due to the decreased efficiency of hot gas cool-out, and the resulting increase of the virial radius at a given circular speed of the central disk galaxy.
To test the effect of adopting =0.7 and =0.9, rather than the 0.65 and 1.0 used in the main simulations, one simulation was run with the former parameters at the resolution of SLGP03. Comparing to the above 39 simulations it was found that the hot gas, as well as, total external fraction increase by 5-10%. This is likely mainly due to the Hubble time being 7% less, allowing less time for hot gas cool-out.
4.1. Thermal instability of hot halo gas, and HVCs
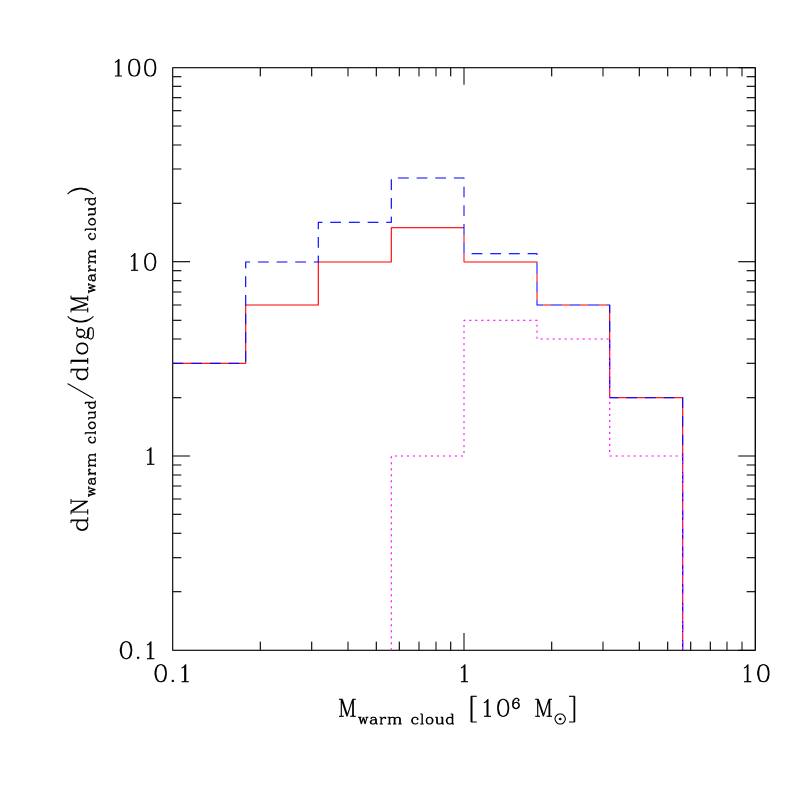
The hot, dilute halo gas may be susceptible to thermal instability, causing the formation of a two-phase medium, consisting of a hot phase ( K) and a warm phase ( K), in approximate pressure equilibrium (e.g., Burkert & Lin 2000; Maller & Bullock 2004, Kaufmann et al. 2005). This may not change the general picture, since warm clouds, once formed, may quickly be destroyed again due to various physical processes. It is, however, important to estimate the fraction of halo gas in warm clouds, at any given time. To estimate this for a realistic, cosmological simulation very high numerical resolution is required, and the following approach was adopted: for a “standard” high-resolution simulation of a Milky Way like galaxy (=224 km/s, =8x10, =256 kpc), at =0.4, each gas particle, at 300 kpc, was split into 12 equal mass gas particles, to achieve very high resolution of the gas phase inside of . The simulation was then continued for 0.2 Gyr, whence each gas particle, at 50 kpc, was again split into 8 equal mass gas particles, to achieve ultra-high gas phase resolution in the region where most of the warm clouds reside (see below). The resulting ultra-high resolution gas particle mass is 7.6x10³ , and gravity softening length =83pc. The simulation was then continued for an additional 0.5 Gyr. In Fig.4 is shown, for 50 kpc, the distribution of warm cloud masses, at =0.3 and 0.7 Gyr. The integrated warm cloud mass decreases somewhat with time (20%), to 5x10 at =0.7 Gyr, or about 2% of the total mass of hot halo gas at 50 kpc. Also shown, is the mass distribution of warm clouds, at 50 kpc, in the very high resolution simulation, at =0.7 Gyr. To the cloud resolution limit of this simulation, 2x10, the agreement between the two simulations is quite good. Moreover, with a resolution limit of 3x10 for the ultra-high resolution simulation, the peak at 7-8x10 appears well resolved. It hence seems unlikely that the mass contribution from warm clouds of mass less than about 3x10 is significant; such clouds will in any case quickly be destroyed by various physical processes, e.g., Maller & Bullock (2004).
From the very high resolution simulation, the mass in warm clouds at 50256 kpc, is about 75% of that within 50 kpc. Assuming this ratio, the total mass of warm clouds, at , down to 3x10, estimates to 10. It seems unlikely that inclusion of warm clouds of 3x (which can not be resolved by the current simulation) will increase this estimate by more than a factor of a few. Putman (2006) estimates the total gas mass of the HVC system of the Milky Way to 4-6x10, assuming that the HVCs are distributed to distances of 60 kpc (a reasonable assumption according to the present findings). This is in fair agreement with, though somewhat larger than, the above estimates. Moreover, the hot gas in the halo of the simulated Milky Way like galaxy, has 10-3.5,10-4 and 10-4.5 cm-3 at 10, 50 and 100 kpc. This is in reasonable agreement with the lower limit of 10-4 cm-3, deduced by Quilis & Moore (2001) from the observed head–tail structure of many Galactic HVCs (also displayed by many of the simulated warm clouds)1.
The warm clouds are mainly confined by the pressure of the ambient halo gas, though some of the most massive display high density cores, and have a ratio of gravitational to thermal energy of about 0.5. Moreover, they typically appear to be seeded by warm filamentary structures, which are leftovers from earlier “cold” accretion (e.g., Birnboim & Dekel 2003; Keres et al. 2005; Sommer-Larsen 2005 — details will be given in Putman & Sommer-Larsen 2006). No additional warm clouds appear to form, despite that the necessary condition for onset of thermal instability, viz. , is satisfied everywhere in the hot halo gas ( is the sound crossing time, which is taken to be , where is the local SPH smoothing length and is the sound speed: is the timescale for radiative cooling). The mass of hot gas within is 2.3x10, so the ratio of warm cloud mass to hot gas mass is at most a few percent. Although fully cosmological simulations at even higher resolution are required to address these issues completely, the above results strongly suggest that the hot gas phase is the dominant one in the halo. It is also worth noting that Pedersen et al. (2006) found that the predicted halo X-ray luminosity and surface brightness profile of large disk galaxies, simulated at a resolution which was, though high, not sufficiently high to resolve warm halo clouds, matches the observed X-ray properties of NGC5746 very well. This would not be expected if a substantial fraction of the halo gas was in the warm phase.
I have benefited from discussions with J. Binney, A. Dekel, R. Bower, J. Fynbo, L. Hernquist, T. Kaufmann, A. Loeb, L. Portinari, M. Putman and J. Silk.
The Dark Cosmology Centre is funded by the DNRF.
References
- Benson et al. (2000) Benson, A. J., Bower, R. G., Frenk, C.S., & White, S.D.M. 2000, MNRAS, 314, 557
- Birnboim & Dekel (2003) Birnboim, Y. & Dekel, A. 2003, MNRAS, 345, 349
- Burkert & Lin (2000) Burkert, A., & Lin, D.N.C.. 2000, ApJ, 537, 270
- Dehnen & Binney (1998) Dehnen, W.,& Binney, J. 1998, MNRAS, 294, 429
- Desai et al. (2004) Desai, V. et al. 2004, MNRAS, 351, 265
- Gonzalez et al. (2000) Gonzalez, A.H., et al. 2000, ApJ, 528, 145
- Haardt & Madau (1996) Haardt, F., & Madau, P. 1996, ApJ, 461, 20
- Kaufmann et al. (2005) Kaufmann et al. 2005, MNRAS, submitted (astro-ph/0507296)
- Keres et al. (2005) Keres, D., Katz, N., Weinberg, D. H. & Dave, R. 2005, MNRAS, 363, 2
- Lia et al. (2002a) Lia, C., Portinari, L., Carraro, G. 2002, MNRAS, 330, 821
- Lia et al. (2002b) Lia, C., Portinari, L., Carraro, G. 2002, MNRAS, 335, 864
- Maller & Bullock (2004) Maller, A.H., & Bullock, J. 2004, MNRAS, 355, 694
- Pedersen et al. (2006) Pedersen, K., Rasmussen, J., Sommer-Larsen, J., Toft, S., Benson, A.J., & Bower, R.G. 2006, New Astronomy, in press (astro-ph/0511682)
- Portinari & Sommer-Larsen (2006) Portinari L., & Sommer-Larsen, J. 2006, MNRAS, to be submitted
- Putman (2006) Putman, M.E. 2006, ApJ, submitted
- Putman & Sommer-Larsen (2006) Putman, M.E., & Sommer-Larsen, J. 2006, ApJ, to be submitted
- Quilis & Moore (2001) Quilis, V., & Moore, B. 2001, ApJ, 555, L95
- Rasmussen et al. (2006) Rasmussen, J., Sommer-Larsen, J., Pedersen, K., Toft, S., Benson, A. J. & Bower, R. G. 2005, ApJ, submitted
- Sembach et al. (2003) Sembach, K.R., et al. 2003, ApJS, 146, 165
- Silk (2004) Silk, J. 2004, in “Where Cosmology and Fundamental Physics Meet, 23-26 June, 2003, Marseille, France” (astro-ph/0401032)
- Sommer-Larsen (1991) Sommer-Larsen, J. 1991, MNRAS, 250, 356
- Sommer-Larsen (2005) Sommer-Larsen, J. 2005, in the proceedings of the ”Island Universes: Structure and Evolution of Disk Galaxies” conference held in Terschelling, Netherlands, July 2005, ed. R. de Jong (Springer: Dordrecht)
- Sommer-Larsen & Dolgov (2001) Sommer-Larsen J., & Dolgov, A. 2001, ApJ, 551, 608
- Sommer-Larsen, Götz & Portinari (2003) Sommer-Larsen J., Götz M., Portinari L., 2003, ApJ, 596, 46 (SLGP03)
- Springel & Hernquist (2002) Springel, V. & Hernquist, L. 2002, MNRAS, 333, 649
- Strickland et al. (2002) Strickland, D.K. et al. 2002, ApJ, 568, 689
- Toft et al. (2002) Toft et al. 2002, MNRAS, 335, 799
- White & Frenk (1991) White, S.D.M., & Frenk, C.S. 1991, ApJ, 379, 52