STAR FORMATION AND EXTINCTION IN REDSHIFT GALAXIES: INFERENCES FROM SPITZER MIPS OBSERVATIONS11affiliation: Based, in part, on data obtained at the W.M. Keck Observatory, which is operated as a scientific partnership among the California Institute of Technology, the University of California, and NASA, and was made possible by the generous financial support of the W.M. Keck Foundation. Also based in part on observations made with the Spitzer Space Telescope, which is operated by the Jet Propulsion Laboratory, California Institute of Technology under a contract with NASA.
Abstract
Using very deep Spitzer MIPS m observations, we present an analysis of the bolometric luminosities and UV extinction properties of more than 200 spectroscopically identified, optically selected () galaxies in the GOODS-N field. The large spectroscopic sample of rest-UV selected galaxies is supplemented with photometrically identified near-IR-selected (“BzK” and “DRG”) galaxies and sub-mm sources at similar redshifts in the same field, providing a representative collection of relatively massive ( M⊙) galaxies at high redshifts. We focus on the redshift range , for which the m observations provide a direct measurement of the strength of the mid-IR PAH features in the galaxy spectra; the rest-frame m luminosities () are particularly tightly constrained for the objects in our sample with precise spectroscopic redshifts. We demonstrate, using stacked X-ray observations and a subset of galaxies with H measurements, that provides a reliable estimate of for most star forming galaxies at . We show that the range of in the optical/near IR-selected samples considered extends from L⊙ to L⊙, with a mean L⊙. The LIRG population at is essentially the same population of galaxies that are selected by their optical/near-IR colors. Objects with LIRG to ULIRG luminosities are present over the full range of stellar masses in the samples, from M⊙ to M⊙. We use the MIPS m observations for an independent examination of dust extinction in high redshift galaxies, and demonstrate that, as in the local universe, the obscuration () is strongly dependent on bolometric luminosity, and ranges in value from to within the sample considered. However, the obscuration is times smaller at a given (or, equivalently, a similar level of obscuration occurs at luminosities times larger) at than at . We show that the values of and obscuration inferred from the UV spectral slope generally agree well with the values inferred from for L⊙. As found previously by several investigators, for “ultraluminous” objects with L⊙ it is common for UV-based estimates to underpredict by a factor of . Using the specific star formation rate of galaxies (SFR per unit stellar mass) as a proxy for cold gas fraction, we find a wide range in the evolutionary state of galaxies at , from galaxies that have just begun to form stars to those which have already accumulated most of their stellar mass and are about to become, or already are, passively-evolving.
Subject headings:
cosmology: observations — dust, extinction — galaxies: evolution — galaxies: high redshift — galaxies: stellar content — infrared: galaxies1. Introduction
The most direct method currently available for tracing the bolometric luminosities of high redshift star-forming galaxies () has been from their submillimeter emission (e.g., Smail et al. 1997; Hughes et al. 1998; Barger et al. 1998). Unfortunately, current sensitivity limits of bolometers and submillimeter wave interferometers allow for only the most luminous starburst galaxies to be detected at high redshifts via their dust emission. Further compounding the problem is the coarse spatial resolution provided by such instruments, making it difficult to distinguish the counterpart(s) to the submillimeter emission for subsequent followup, although the recently developed method of radio-detection has been a breakthrough in alleviating this problem for most, but not all, bright submillimeter galaxies (e.g., Chapman et al. 2005). Regardless, the dust properties of the vast majority of star-forming galaxies at high redshift remained uninvestigated until recently.
The rest-frame far-infrared (FIR) wavelength region is still inaccessible for the typical galaxy at redshifts , so we must look to other portions of the spectrum to directly examine dust properties. Our understanding of the mid-IR properties of local and high redshift galaxies advanced considerably with the launch of the Infrared Space Observatory (ISO), which was sensitive enough to detect the mid-IR emission of L⊙ galaxies at (e.g., Flores et al. 1999; Elbaz et al. 2002; Pozzi et al. 2004; Rowan-Robinson et al. 2004). These observations revealed the almost ubiquitous presence of mid-IR dust emission features in star forming galaxies in both the local and universe, and suggested the possibility of using the mid-IR dust emission of galaxies as a tracer of bolometric luminosity (Boselli et al. 1998; Adelberger & Steidel 2000; Dale et al. 2000; Helou et al. 2000; Förster Schreiber et al. 2003).
These advances now continue with the highly successful Spitzer Space Telescope, providing the same sensitivity as ISO in probing dust emission from L⊙ galaxies at . The progress made with Spitzer is particularly important for studying galaxies at because this epoch was until recently largely uninvestigated, yet is believed to be the most active in terms of star formation and the build up of stellar and black hole mass (e.g., Dickinson et al. 2003; Rudnick et al. 2003; Madau et al. 1996; Lilly et al. 1996; Steidel et al. 1999; Shaver et al. 1996; Fan et al. 2001; Di Matteo et al. 2003; Giavalisco et al. 1996). The sensitivity afforded by the Spitzer MIPS instrument allows us to examine the typical galaxy at , rather than a limited slice of the most luminous population, a problem which, as alluded to before, limits the usefulness of submillimeter observations.
It is fortuitous that the rest-frame mid-IR spectral features observed in local and star-forming galaxies are redshifted into the Spitzer IRS spectral and MIPS imaging passbands at . The mid-IR spectral region from m is rich with emission lines believed to arise from the stochastic heating of small dust grains by UV photons (see review by Genzel & Cesarsky 2000). These unidentified infrared bands (UIBs) are generally attributed to the and stretching and bending vibrational modes of a class of carbonaceous molecules called polycyclic aromatic hydrocarbons (PAHs; e.g., Puget & Leger 1989; Tielens et al. 1999), which we assume hereafter. In the typical spectrum of a star-forming galaxy, these PAH emission lines, along with various fine-structure metal and HI recombination lines (e.g., Sturm et al. 2000), are superposed on a mid-IR continuum thought to result from dust emission from very small grains, or VSGs (Desert et al., 1990). In star-forming galaxies, the global PAH emission is mainly attributed to UV radiation from OB stars and has been found to correlate with global star formation rate (e.g., Förster Schreiber et al. 2004b; Förster Schreiber et al. 2003; Roussel et al. 2001), although variations with ionizing intensity and metallicity are also observed (e.g., Engelbracht et al. 2005; Hogg et al. 2005; Alonso-Herrero et al. 2004; Helou et al. 2001; Normand et al. 1995).
Until now, the only way to estimate the bolometric luminosities of most galaxies at independent of extinction was via their stacked X-ray and radio emission: unfortunately these data are not sufficiently sensitive to detect individual galaxies at (e.g., Reddy & Steidel 2004; Nandra et al. 2002; Brandt et al. 2001). The Spitzer data considered in this paper are useful in assessing the bolometric luminosities of galaxies on an individual basis. One is still limited because detailed mid-IR spectroscopy is feasible only for the most luminous galaxies at (e.g., Yan et al. 2005; Houck et al. 2005), but galaxies at (with L⊙) can be detected in deep m images. We employ MIPS m data to study the rest-frame mid-IR properties of optical and near-IR selected galaxies at redshifts . We describe the optical, near-IR, X-ray, and mid-IR data in § 2 and 3. Our large sample of spectroscopic redshifts for optically-selected galaxies allows us to very accurately constrain the rest-frame mid-IR fluxes of galaxies. In § 4, we describe our method for estimating photometric redshifts for near-IR samples of galaxies where spectroscopy is less feasible. The procedure for estimating infrared luminosities from MIPS data is outlined in § 5.1. We discuss the infrared luminosity distributions of m detected and undetected sources in § 5.2 and 5.3. The dust attenuation properties of optical and near-IR selected galaxies and the correlation of these properties with bolometric luminosity are discussed in § 6 and § 7. The stellar populations and composite rest-frame UV spectral properties of faint m galaxies are discussed in § 8. In § 9 we examine in more detail the mid-IR properties of massive galaxies at . We conclude in § 10 by discussing the viability of optical and near-IR color criteria in selecting LIRGs and ULIRGs at and what the Spitzer MIPS observations can reveal about the mass assembly of galaxies at high redshift. A flat CDM cosmology is assumed with km s-1 Mpc-1 and .
2. Sample Selection and Ancillary Data
2.1. Optical and Near-IR Selection
| ccSurface density of candidates. Errors are computed assuming Poisson statistics. | ||||||||
|---|---|---|---|---|---|---|---|---|
| Sample | Limits | aaNumber of candidates. | bbNumber of directly-detected X-ray sources, including spectroscopically-confirmed galaxies. | (arcmin-2) | ddNumber of spectroscopically confirmed objects with . Note that we only obtained spectra for those and DRG galaxies that satisfy the criteria. | eeMean redshift of sample for . For the /PE sample, this is the mean redshift of the photometric redshift distribution observed for /PE galaxies (e.g., Daddi et al. 2004;Reddy et al. 2005). For the DRGs, this is the mean redshift of the spectroscopic redshift distribution observed for DRGs with in four of the fields of the optical survey (Reddy et al., 2005). | ffNumber of non-AGN galaxies (i.e., those with no direct X-ray detections) with spectroscopic redshifts . For the /SF sample, this number includes both spectroscopically-confirmed /SF galaxies (all of which are in the sample) and those with secure photometric redshifts. For the /PE sample, this includes all candidates without direct X-ray detections. For the DRG sample, this number includes galaxies with photometric redshifts . | ggFraction of MIPS m detections to Jy ( ) among the galaxies. |
| (BX/BM/LBG) | 1571 | 23 | 313 | 219 | 0.65 | |||
| /SF | 221 | 32 | 53 | 82 | 0.82 | |||
| /PE | 17 | 4 | 0 | 13 | 0.54 | |||
| DRGhhThe DRG sample includes both star-forming galaxies and those with
little star formation. As discussed in Reddy et al. (2005), those with spectra
(i.e., those DRGs which also satisfy the criteria) are likely
to be currently forming stars.
|
73 | 19 | 5 | 24 | 0.71 |
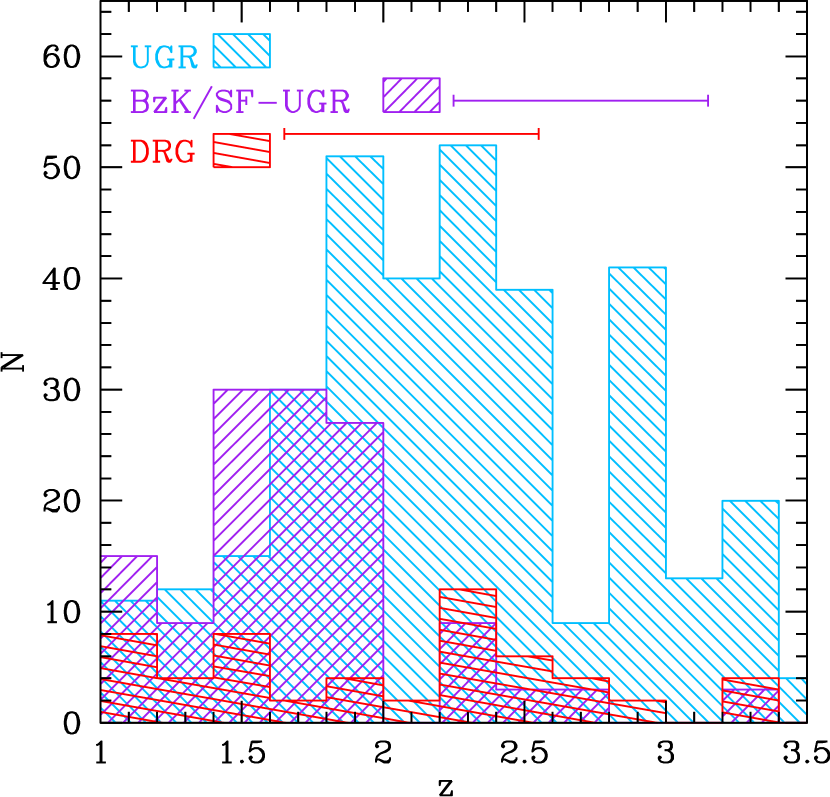
The star-forming galaxies studied here were drawn from the sample of galaxies in the GOODS-N field selected based on their observed colors to (Adelberger et al., 2004; Steidel et al., 2004). The optical images used for the selection of candidates cover an area by . We refer to “BM” and “BX” galaxies as those which are selected to be at redshifts and , respectively (Adelberger et al. 2004; Steidel et al. 2004). In addition to BX/BM galaxies, we also consider galaxies selected using the LBG criteria (Steidel et al., 2003). The BX/BM and LBG candidates make up our , or optically, selected sample. We obtained rest-frame UV spectra with the blue channel of the Low Resolution Imaging Spectrograph (LRIS-B) on Keck I for 386 candidates. The numbers of candidates and spectroscopically confirmed galaxies in the sample are summarized in Table 1. The spectroscopic redshift distribution of galaxies in the GOODS-N field is shown in Figure 1. For efficiency, we preferentially targeted for spectroscopy those candidates with -band magnitudes in the range (AB units) and gave lower priorities for fainter objects where redshift identification is more difficult from absorption lines and brighter objects where the contamination fraction (from low redshift interlopers) is larger. The star formation rate distribution of spectroscopically-confirmed galaxies is similar to that of all galaxies in the targeted redshift range to (Vega; Reddy et al. 2005; see also Steidel et al. 2004 for a discussion of spectroscopic bias of galaxy properties with respect to the photometric sample of galaxies).
Our deep near-IR and -band imaging, in addition to publicly available deep optical imaging, allows us to select both star-forming galaxies and those with little current star formation in the GOODS-N field. Details of the optical and near-IR images are provided in Reddy et al. (2005). The near-IR selection of star-forming galaxies is done using the criteria of Daddi et al. (2004), resulting in a “/SF” sample (e.g., Daddi et al. 2004; Reddy et al. 2005). The near-IR selected samples of galaxies with very little current star formation are constructed by considering the and colors of candidates satisfying the /PE and Distant Red Galaxy (DRG) criteria (e.g., Reddy et al. 2005; Daddi et al. 2004; Franx et al. 2003). Approximately of DRGs to (Vega) have signatures of intense star formation (Papovich et al. 2005; Reddy et al. 2005; van Dokkum et al. 2004)111In order to ensure our sample is complete, we only consider DRGs to .. The and band images cover a large area by near-IR standards (), but are still less than half the area of the optical images. The number of near-IR selected candidates and their surface densities are presented in Table 1. For the remaining analysis, we use AB units for optical () magnitudes and Vega units for near-IR () magnitudes.
2.2. X-Ray Data
The very deep Chandra X-ray data in the GOODS-N field
(Alexander et al., 2003) allow for an independent means of assessing the
presence of AGN in the samples, which can be quite significant for
near-IR selected samples (Reddy et al., 2005). In addition, we can stack
the X-ray data for those galaxies lying below the X-ray detection
threshold to determine their average emission properties
(e.g. Laird et al. 2005; Lehmer et al. 2005; Reddy & Steidel 2004;
Nandra et al. 2002; Brandt et al. 2001). The X-ray data and stacking
methods are discussed in detail in Reddy & Steidel (2004) and
Reddy et al. (2005). The numbers of directly-detected X-ray sources in
each sample considered here are summarized in Table 1.
3. Mid-IR Data
The mid-IR data are obtained from the Spitzer Multiband Imaging Photometer (MIPS) instrument. The micron data were taken as part of the GOODS Legacy Survey (P.I.: M. Dickinson) between May 27 and June 6, 2004. They consist of 24 AORs (Astronomical Observation Requests) of approximately 3 hours each. The combined data reach a depth equivalent to hours integration at any point in the mosaicked image. The data are publicly available since August 2004 in the Spitzer archive. The basic calibrated data (BCD) produced by the Spitzer pipeline were used as the starting point for the data reduction. As explained in detail by Fadda (2006), there were several artifacts which added noise to the images, hampering the detection of faint sources. These artifacts include image latencies from previous observations of bright objects or image dark spots present on the pick-off mirror that are projected in different positions by the cryogenic scan mirror during observations. Other variations come from the variable zodiacal light. We have corrected each BCD image for these effects using the procedure described by Fadda (2006). The final mosaic consists of 7198 BCDs combined using MOPEX (Makovoz & Marleau, 2005). The final reduced m mosaic of the GOODS-N region has a pixel size of and covers the entirety of our optical images and the measured depth is approximately Jy. The large beam-size of MIPS ( at m) combined with the effects of blending make aperture photometry impractical. Instead, we have chosen to use a PSF fitting method to extract m fluxes for our galaxies, similar to the method used to extract IRAC fluxes for galaxies as discussed in Shapley et al. (2005).
We first compute an empirical PSF using a two-pass approach. In the first pass, we take the median flux profile of several tens of distinct MIPS point sources across the mosaic to create a rough empirical PSF. This PSF is then used to subtract sources in proximity to the tens of MIPS point sources in order to better determine the PSF profile out to larger radii. This is important for the MIPS PSF which contains up to of the point source flux in the Airy rings. The effects of source confusion are mitigated by employing the higher spatial resolution Spitzer IRAC data in the GOODS-N field to constrain the MIPS source positions. The empirical PSF, normalized to unit flux, is fit to these positions and the fluxes are extracted. The PSF used here extends to radius, and we apply a aperture correction based on the observed curves-of-growth of MIPS point source profiles from the First Look Survey.
The number of MIPS detections ( ) and non-detections in each sample are summarized in Table 1. Virtually all of the directly-detected X-ray sources are detected at m and all have optical/X-ray flux ratios indicating that AGN dominate the X-flux (Reddy et al., 2005). Submillimeter galaxies are often associated with direct X-ray detections (e.g., Alexander et al. 2005; Reddy et al. 2005) even though their bolometric luminosities may still be dominated by star-formation. Since we are primarily interested in the mid-IR emission as a tracer of star formation, we have excluded all directly-detected X-ray sources (almost all of which are AGN; Reddy et al. 2005) for most of the analysis, unless they happen to coincide with a radio-detected SMG from the Chapman et al. (2005) (SC05) sample. We caution that the resulting sample of SMGs is not meant to be uniform or complete: of SMGs are not associated with radio sources, either because of their higher redshifts or radio faintness (e.g., Chapman et al. 2005; Smail et al. 2002). Furthermore, the submillimeter observations are not uniform over the field. Nonetheless, it is of obvious interest to at least compare the mid-IR properties of this limited set of radio-detected SMGs to those of galaxies in other samples.
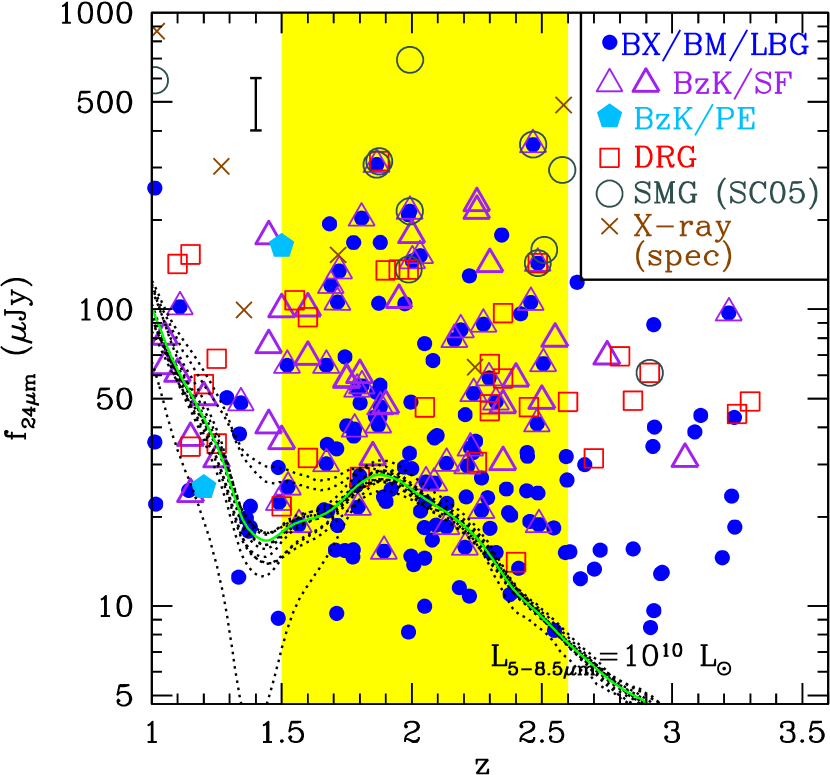
The MIPS m filter directly samples the rest-frame luminosity
from m () for redshifts . We used the mid-IR spectral shapes of star-forming galaxies
(listed in Table 2) as templates in order to K-correct the m fluxes to determine .
Figure 2 shows the expected m fluxes of the
galaxies listed in Table 2 as a function of
redshift. These galaxies were chosen to cover a large range in SFRs
(from quiescent spiral galaxies to starbursts and LIRGs/ULIRGs). The
mid-IR spectra are obtained from either ISO (for local galaxies;
Förster Schreiber et al. 2004a) or Spitzer IRS (for
hyper-luminous galaxies; Yan et al. 2005) observations. Some
properties of these galaxies are summarized in
Table 2. The mid-IR spectrum of each galaxy is
redshifted, convolved with the MIPS m filter, and the fluxes
are normalized to have L⊙ to
produce the dotted curves in Figure 2. The small
dispersion between the templates over redshifts
reflects small changes in the broadband m fluxes of galaxies
due to changes in the relative strengths of the various PAH emission
lines and the ratio of PAH-to-continuum flux. The solid curve in the
figure shows the average of all the template galaxies. The prominent
peak at is primarily due to the m feature
shifting into the MIPS m filter.
| NameaaAll galaxies are compiled from Förster Schreiber et al. (2004a) and Roussel et al. (2001), except for IRS9 and NGC7714 which are taken from Yan et al. (2005). The bolometric luminosity of IRS9 is constrained within a factor of 2-3 (Yan et al., 2005). |
bbRedshifts for local galaxies are obtained from
NASA/IPAC Extragalactic Database (NED).
|
( L⊙) |
|---|---|---|
| M82 | 0.000677 | 4.8 |
| NGC253 | 0.000811 | 1.8 |
| M83 | 0.001711 | 1.9 |
| M51 | 0.002000 | 2.4 |
| NGC1808 | 0.003319 | 3.8 |
| NGC1097 | 0.004240 | 3.8 |
| NGC1365 | 0.005457 | 8.7 |
| NGC520 | 0.007609 | 6.5 |
| NGC7714 | 0.009333 | 5.6 |
| NGC3256 | 0.009386 | 40 |
| NGC6240 | 0.024480 | 60 |
| IRS9 | 1.83 | 1800 |
4. Photometric Redshifts of Near-IR Selected Galaxies
Figure 2 illustrates the sensitive dependence of the K-correction on the redshift (e.g., galaxies with a given observed can have a factor of 3 spread in depending on their redshift in the range ). Our large spectroscopic sample gives us the distinct advantage of knowing the precise redshifts for the optically selected galaxies, removing the added uncertainty introduced by photometric redshifts where the precise location of the PAH features with respect to the MIPS m filter is unknown, adding considerable uncertainty to the inferred infrared luminosities (e.g., Papovich et al. 2005). As we show below, the typical error in the photometric redshifts derived for near-IR selected galaxies (even when using data across a large baseline in wavelength, from UV through Spitzer IRAC), is . This error in redshift translates to at least a factor of three uncertainty in .
Nonetheless, photometric redshifts are the only practical option for optically faint galaxies where spectroscopy is not feasible. This is true for many of the DRGs and /PE galaxies. We supplement our spectroscopic database of optically selected galaxies with photometric redshifts of near-IR selected galaxies. We made use of the HyperZ code to determine photometric redshifts (Bolzonella et al., 2000). To quantify the uncertainties in photometric redshifts, we tested the code on galaxies with spectroscopic redshifts, fitting to the photometry. The magnitudes are obtained from the v1.1 release of the GOODS ACS catalogs (Giavalisco et al., 2004). Errors in the optical and near-IR magnitudes are determined from Monte Carlo simulations described by Erb et al. (2006b) and Shapley et al. (2005).
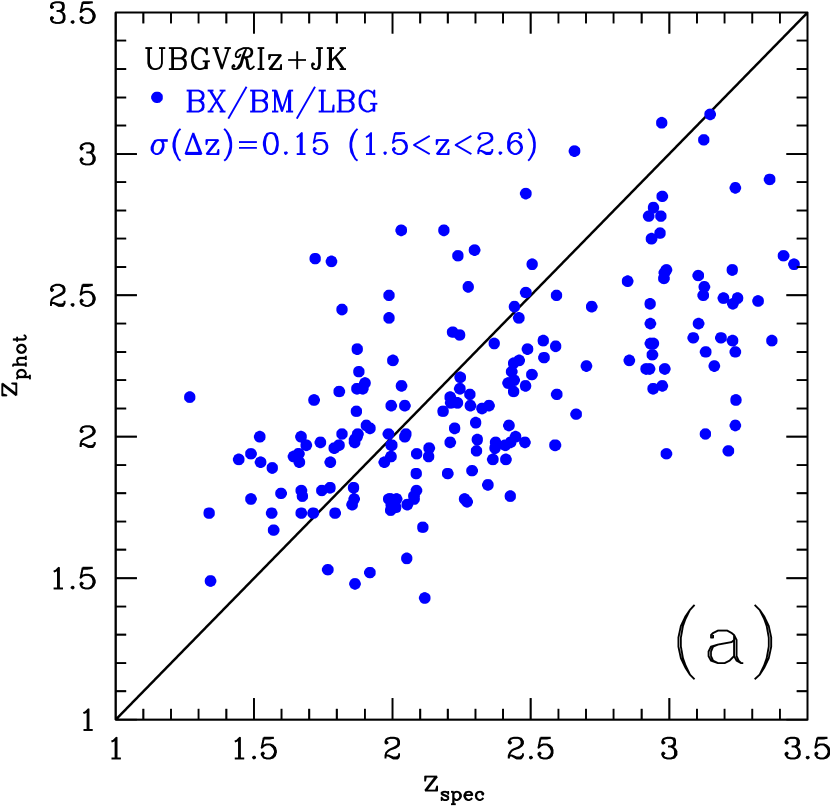
The between the modeled and observed colors was calculated for each galaxy for a number of different star formation histories (with exponential decay times , , , , , , , , and Myr, and ) as a function of redshift. The best-fit photometric redshift is the redshift at which is minimized. As a figure of merit of the resulting fit (and for easy comparison with other studies), we compute
| (1) |
The results are shown in the left panel of Figure 3. The dispersion in is for galaxies with spectroscopic redshifts . The actual error in redshift is typically . Both the Shapley et al. (2005) code (which uses Bruzual & Charlot (2003) models) and the Benítez (2000) code gave similar results. We found that adding Spitzer IRAC data does little to tighten the scatter between photometric and spectroscopic redshifts for most galaxies, reflecting the absence of any distinct features (e.g., strong spectral breaks) across the IRAC bands for galaxies. We note from the left panel of Figure 3 that photometric redshifts systematically underestimate the true redshifts of galaxies. This should not significantly affect our subsequent analysis since we only consider galaxies up to , and most of the /SF and DRG galaxies have photometric redshifts .
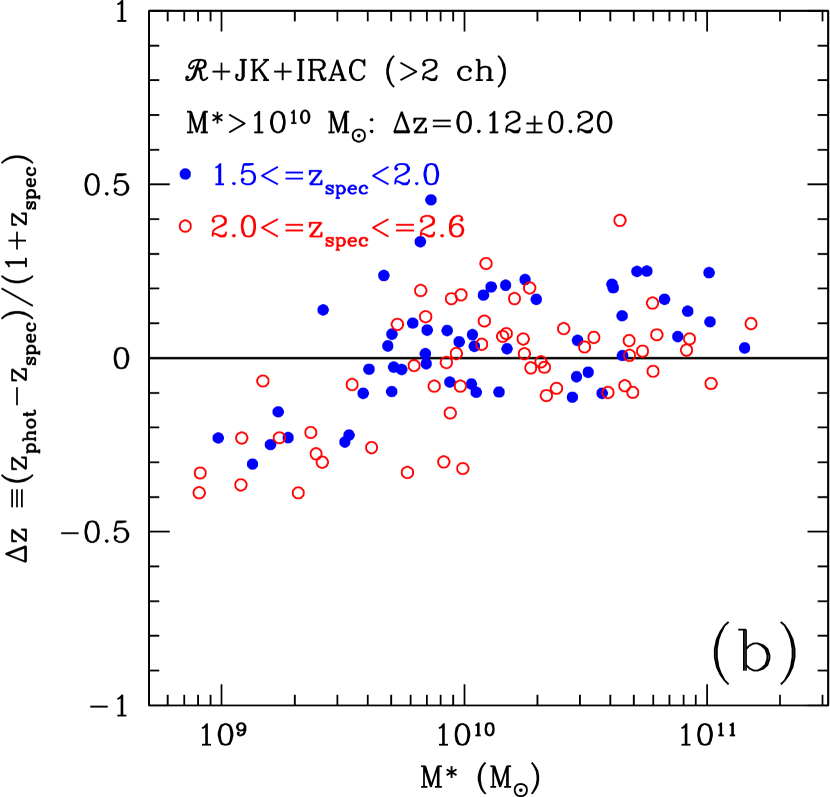
The IRAC data are nonetheless a powerful tool in discerning the more massive galaxies from the less massive ones. Since most of the optically-faint DRGs and /PE galaxies are on average amongst the more massive galaxies at (e.g., Figure 18 of Reddy et al. (2005)), we have incorporated the IRAC data in the photometric redshift fits. The right panel of Figure 3 shows as a function of inferred stellar mass for galaxies computed for the best-fit model, normalizing to the observed colors222We assume a Salpeter IMF in calculating the stellar mass.. The scatter in for galaxies with stellar masses M⊙ is , and we will assume this value for the error in photometric redshifts of the DRG and /PE galaxies. To extend the comparison presented by Reddy et al. (2005) between and selected samples of star-forming galaxies by examining their mid-IR properties, we compute photometric redshifts for /SF galaxies that do not satisfy the criteria. For the /SF galaxies, we assume an error of , according to Figure 3a.
We obtained 51 secure photometric redshift fits for /SF galaxies not selected by the criteria (out of 95 such objects), and their (arbitrarily normalized) photometric redshift distribution is shown in Figure 1. Also shown is the (arbitrarily normalized) photometric redshift distribution for 28 (out of 49) non X-ray detected DRGs for which we were able to derive secure photometric redshifts . The remaining DRGs either have or (and are irrelevant to the analysis considered below) or had photometry that was inconsistent with the Bruzual & Charlot (2003) models considered here, resulting in a large value between the model and observed colors. The DRGs examined here appear to span a very large range in redshift from , a result similar to that found by Papovich et al. (2005) for DRGs in the GOODS-South field. We obtained good photometric redshift fits for only two of the /PE galaxies: one at and the other at . We reiterate that for purposes of redshift identification, we only assumed the photometric redshifts for those galaxies for which we were able to obtain good SED fits (i.e., with ) to the observed data. There were a number of objects for which the photometric redshift errors were relatively large () or had derived redshifts that were much larger () or smaller () than of interest here, and we excluded such objects from our analysis. Hence, the photometric redshift distributions in Figure 1 should not be attributed to the populations as a whole. For the remaining analysis we consider only optically-selected galaxies with spectroscopic redshifts and near-IR selected galaxies with photometric redshifts between where the m fluxes directly trace the flux at rest-frame m. This is indicated by the shaded region in Figure 2.
5. Infrared Luminosities of Optical, Near-IR, and Submillimeter Selected Galaxies at
5.1. Inferring Infrared Luminosities from
The conversion between and infrared luminosity will largely depend on the assumed spectral template relating the mid-IR emission of galaxies to their total infrared luminosities. Fortunately, the deep X-ray data allow us to determine whether scales with infrared luminosity (or star formation rate) independent of any assumed template, adopting the local empirical relationship between X-ray and FIR luminosity for star-forming galaxies. Figure 4 shows the ratio of to stacked X-ray luminosity of (X-ray undetected) galaxies in bins of : we only considered optically-selected galaxies with spectroscopic redshifts since it is for these galaxies which we are able to most accurately constrain the rest-frame X-ray luminosities. Since X-ray emission is sensitive to star formation on time-scales of Myr (see § 6), Figure 4 shows results excluding galaxies with inferred ages Myr. Each bin contains sources except the faintest bin which includes 45 galaxies undetected at m with ages Myr. The X-ray data for galaxies in each bin were stacked using the procedure described in Reddy et al. (2005). The mean value of the mid-IR-to-X-ray luminosity ratio is . The X-ray luminosities of local star-forming galaxies are found to tightly correlate with their infrared emission for galaxies with L⊙ (e.g., Ranalli et al. 2003). Using the X-ray luminosity as a proxy for infrared luminosity therefore implies that the rest-frame mid-IR fluxes follow the total infrared luminosity () for the vast majority of optically-selected galaxies at 333Another commonly used definition of is the total luminosity from m. This will differ from by only a few percent, and for the remaining analysis, we take , as defined by Sanders & Mirabel (1996).. The mid-IR fluxes must also follow the infrared luminosity for most near-IR selected star-forming galaxies as well given the large overlap () between optical and near-IR selected samples of star-forming galaxies (Reddy et al., 2005). As we show below, the conversion we assume between rest-frame mid-IR and infrared luminosities reproduces the average infrared luminosities predicted from stacked X-ray analyses (§ 6.1).
To quantify the relationship between rest-frame mid-IR and total infrared luminosity with a minimum number of assumptions, we have made use of the data compiled by Elbaz et al. (2002), which include IRAS and m measurements and ISO observations of 149 local star-forming galaxies with in the range L⊙. The mean and dispersion of the IR/MIR flux ratio for the sample of 149 galaxies is . Note the large dispersion of a factor of 2.2 in the IR/MIR flux ratio. The dispersion in the IR/MIR flux ratios between galaxies may be driven partly by changes in the mid-IR line strengths as the aromatic carriers are dehydrogenated and/or destroyed depending on the intensity of the ambient UV ionizing field (e.g., Alonso-Herrero et al. 2004; Helou et al. 2001; Dale et al. 2001; Normand et al. 1995). Metallicity effects and a changing distribution of dust with respect to HII regions also likely contribute to the observed factor of dispersion in the IR/MIR ratios. Nonetheless, the mean IR/MIR flux ratio is similar to that inferred from the Dale et al. (2001) template SED for a median . Based on the sample of 149 galaxies from Elbaz et al. (2002), we assume to convert to .
It is worth noting that the relationship between and total IR luminosity for local star-forming galaxies may be described by a more complicated function, such as a two power-law fit (e.g., Elbaz et al. 2002). These complicated relationships may not apply to galaxies at for several reasons. First, the IR/MIR ratio may change depending on the relative contribution of older stellar populations in heating PAH and larger dust grains. The heating of dust by cooler stars is expected to be more prevalent for the less luminous local galaxies with older stellar populations, on average, than for galaxies with relatively younger stellar populations. Second, it is found that galaxies have metallicities that are on average dex lower than those of local galaxies at a given stellar mass (Erb et al., 2006a). Therefore, the metallicity dependence of the IR/MIR ratio found for local galaxies (e.g., Engelbracht et al. 2005) suggests that we may not be able to ascribe the IR/MIR ratio for a galaxy of a given stellar mass at to a galaxy at with the same stellar mass. A third possibility, and one that is suggested by the results of this paper and other studies (e.g., Adelberger & Steidel 2000; Calzetti & Heckman 1999), is that the dust obscuration of galaxies at a given bolometric luminosity changes as function of redshift, a result that may reflect dust enrichment and/or a changing configuration of dust as galaxies age. Therefore, the relative distribution of PAH and larger dust grains within galaxies may also change as a function of redshift. Because of these uncertainties, and since the primary motivation of our study is to independently establish the validity of MIPS observations to infer the infrared luminosities of galaxies, we adopted the simplest conversion that assumes only that the typical IR/MIR luminosity ratio for local galaxies with a wide range in infrared luminosity applies at . By taking an average over the local galaxies, we ensure that the derived is not more than a factor of away from that predicted using the IR/MIR ratio of any individual galaxy. As we show below, our constant conversion reproduces within the uncertainties the results that we obtain from stacked X-ray and dust-corrected UV estimates of .
In addition to the stacked X-ray and dust-corrected UV estimates, we also have spectroscopic H observations for a small sample of 10 galaxies in the GOODS-North field (Erb et al., 2006c) with clean (i.e., not blended) MIPS detections. Once corrected for extinction, the H fluxes of these galaxies provide estimates of their total (bolometric) luminosities, which we take to be the sum of the and observed Å luminosity (uncorrected for extinction):
| (2) |
In Figure 5 we show the comparison between estimated from the sum of the MIPS-inferred and observed Å luminosity () with estimated from the spectroscopic H observations (). The results indicate that within the uncertainties the two estimates of track each other very well (with a scatter of dex) over the range of typical of galaxies in optical/near-IR selected samples (§ 7), at least for this limited sample of objects. The agreement between the MIPS and H-inferred estimates suggests that our conversion relation between and works reasonably well. Nonetheless, for comparison with our constant conversion relation, we also consider the effect on our results of assuming a two power-law conversion suggested by Elbaz et al. (2002). As we show below, assuming the two power-law conversion does not change the main conclusions of our study.

The far-infrared luminosity () is typically defined to be the luminosity from m (Helou et al., 1988). Soifer et al. (1987) found for galaxies in their Bright Galaxy Sample. Modeling of the warm and cool components of the dust emission in UV-bright galaxies indicates a conversion factor of (Calzetti et al., 2000). We take a median value of in converting the inferred of galaxies to a FIR luminosity. Generally, uncertainties in the conversion between and are much smaller than the uncertainties in converting to .
Hereafter we assume uncertainties in the total infrared luminosities as follows. For galaxies and radio-selected SMGs with spectroscopic redshifts, we assume an uncertainty in of dex, corresponding to the dispersion in the conversion between and . For near-IR selected galaxies and DRGs, the photometric redshift error will add an additional dex scatter. The total uncertainty in for galaxies and DRGs with photometric redshifts is dex.
5.2. Infrared Luminosity Distributions
Figure 2 summarizes the observed fluxes of galaxies as a function of redshift. In this figure, all direct X-ray detections were removed from the , and DRG samples, unless they happened to coincide with a radio-detected submillimeter galaxy (SMG) from Chapman et al. (2005), or unless they have spectroscopic redshifts in the sample (crosses in Figure 2). The and SMG samples include objects outside the region covered by our near-IR imaging. The overlap between the samples considered here is discussed extensively in Reddy et al. (2005). The observed m fluxes for objects in the various samples generally span a large range, from our sensitivity limit of Jy to Jy.
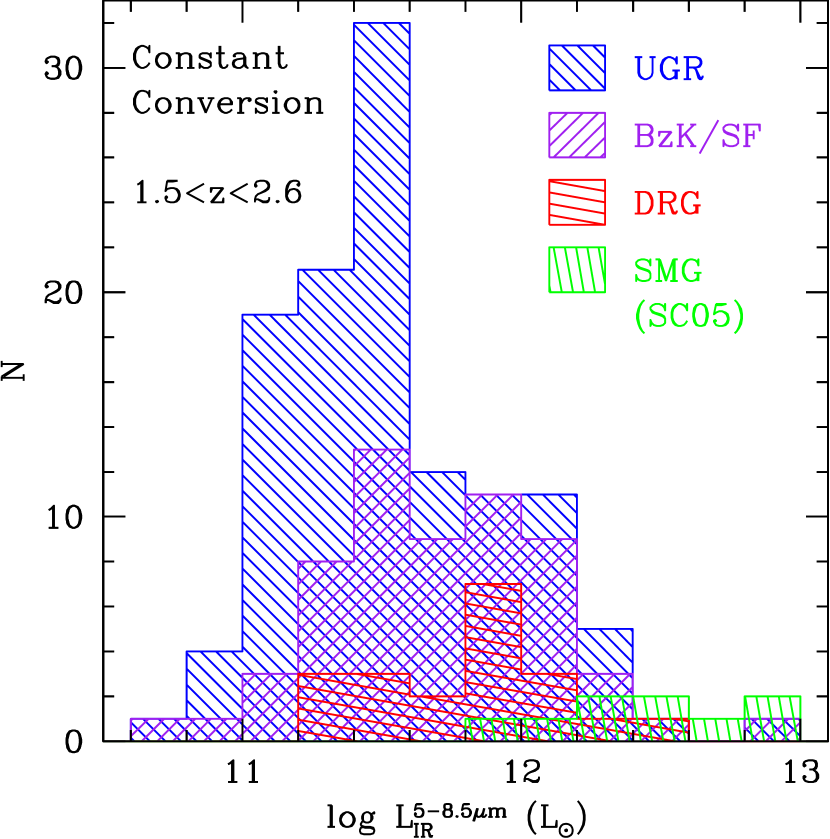
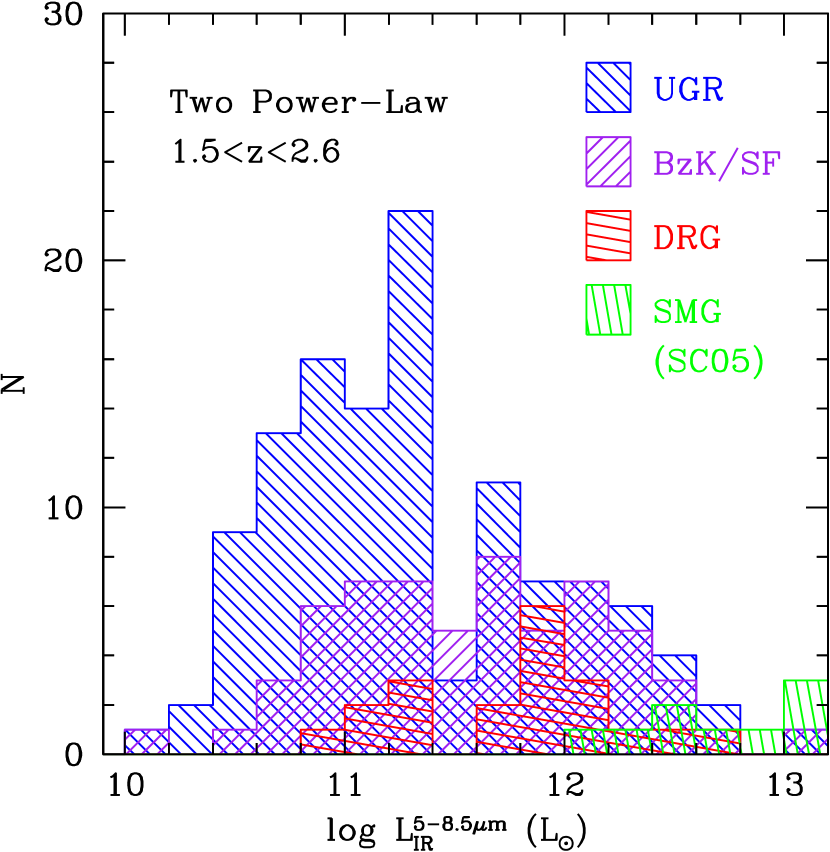
For a more meaningful comparison, we have computed for galaxies using the prescription described in § 5.1. Figure 6 shows the distribution of as inferred from for galaxies in the , /SF, DRG, and radio-detected SMG (Chapman et al., 2005) samples with either spectroscopic or photometric redshifts . As in Figure 2, we have excluded directly detected X-ray sources from the distributions unless they coincide with a radio-detected SMG source. We show the resulting distributions assuming the constant conversion and two power-law conversion relations in the left and right panels, respectively. The distributions assuming the two power-law conversion are bimodal. However, the distributions of observed UV luminosities and dust correction factors of galaxies are approximately gaussian (e.g., Steidel et al. 2004; Reddy et al. 2006). Assuming the Calzetti et al. (2000) law to convert the observed luminosities to dust-corrected luminosities then implies that the bolometric luminosity distribution of galaxies should be gaussian, a result not in accordance with the bimodal distribution computed assuming the two power-law conversion. More generally, we expect to find gaussian distributions of luminosity for galaxies in photometric surveys since such galaxies are typically selected on a continuous range of observed colors and/or magnitudes. The bimodality in Figure 6b is likely due to the sparse data used to establish the two power-law relation for galaxies with L⊙ (see Figure 5d of Elbaz et al. 2002). This range of happens to encompass the typical IR luminosity of galaxies as inferred from X-ray and dust-corrected UV estimates (Reddy & Steidel, 2004) and it is partly for this reason that we favored our simple constant conversion relationship.
Regardless of the conversion used, we find that the bulk of the galaxies in the and /SF samples and detected at m have inferred infrared luminosities comparable to those of local luminous infrared galaxies (LIRGs), with L⊙. Galaxies in the sample with Jy (corresponding to the sensitivity limit) have L⊙ for the constant conversion and L⊙ for the two power-law conversion (the two power-law distribution is broader than that obtained using the constant conversion). Both the and /SF samples also host galaxies which, based on their inferred , would be considered ultra-luminous infrared galaxies (ULIRGs) with L⊙. Note that if we excluded all direct X-ray detections, including the submillimeter sources, the maximum inferred of and /SF galaxies is L⊙, an infrared luminosity which is similar to the detection limit of the Chandra 2 Ms data for a galaxy at assuming the Ranalli et al. (2003) conversion between X-ray and FIR luminosity.
The /SF sample distribution shown in Figure 6 includes galaxies that do not satisfy the criteria (i.e., /SF– galaxies). These galaxies (to ) have a mean IR luminosity that is identical to that of galaxies to . The average IR luminosity of galaxies is times fainter than galaxies since the sample includes galaxies which extend to fainter magnitudes than those in the sample. Therefore, while the /SF– galaxies have redder colors than required to satisfy the criteria, it appears that their infrared luminosities are still comparable to those of galaxies (see also the discussion in § 6), a result consistent with that obtained in X-ray stacking analyses (Reddy et al., 2005). Figure 6 indicates the DRG galaxies with photometric redshifts between also span a large range in , from luminosities characteristic of LIRGs to ULIRGs. We find a luminosity distribution of DRGs to that is in good agreement with the distribution found by Papovich et al. (2005) for DRGs (to approximately the same depth) in the GOODS-South field444The DRG sample of Papovich et al. (2005) extends to in AB magnitudes, or in Vega magnitudes, over an area twice as large as studied here.. We note that galaxies and DRGs to have the same inferred as galaxies selected in other ways (e.g., using the /SF criteria).
The inferred for the one /PE selected galaxy with is L⊙. The mean flux of MIPS-detected (and non X-ray detected) /PE galaxies without redshifts is Jy which, at the mean redshift of /PE galaxies (e.g., Reddy et al. 2005; Daddi et al. 2004) of , corresponds to L⊙. The m detection rate (; Table 1) of non X-ray detected /PE galaxies implies some contamination by star-forming galaxies; this is not unexpected given that photometric scattering can have a significant effect on samples constructed by color selection techniques (Reddy et al., 2005).
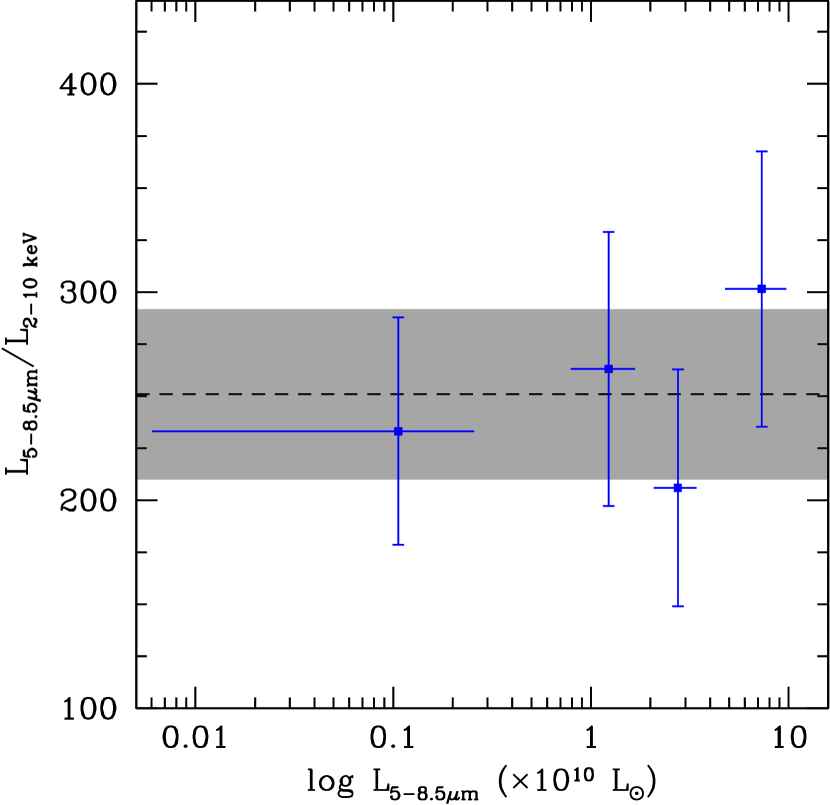
The radio-detected submillimeter galaxies to mJy analyzed here have inferred of L⊙, which can be directly compared with their bolometric luminosities calculated based on the submillimeter data presented by Chapman et al. (2005). The m-inferred bolometric luminosities () are sensitive to the assumed characteristic dust temperature associated with a greybody fit to the dust SED and the emissivity. For example, a change in the assumed dust temperature from K (the median value for the sample of radio-detected SMGs in Chapman et al. 2005) to a cooler temperature of K results in a factor of decrease in the inferred FIR luminosities. Figure 7 shows the comparison between m and m inferred bolometric luminosities of radio-detected SMGs. We also show the point corresponding to IRS9 from the Yan et al. (2005) sample of hyperluminous sources with IRS spectroscopy — this source has independent constraints on its FIR luminosity based on MIPS and m and MAMBO millimeter measurements. The infrared luminosity of IRS9 is L⊙ (constrained to within a factor of ) based on these multi-wavelength measurements (Yan et al., 2005).
Figure 7 shows that the IR/MIR flux ratio for IRS9 is comparable (to within ) to those of the local star-forming galaxies listed in Table 2— these local galaxies are orders of magnitude fainter than IRS9. Judging the validity of our conversion for the hyper-luminous galaxies at is difficult given that very few of these galaxies have independent constraints on their bolometric luminosities. On the other hand, the submillimeter ( m) inferred infrared luminosities of bright SMGs are systematically a factor of higher than predicted using our conversion between and . The crosses in Figure 7 demonstrate that the systematic offset cannot be completely accounted for if we assume a two power-law conversion between and — there are still of SMGs with that are factor of larger than predicted from their m fluxes, and the distribution of SMG points when considering the two-power law conversion is not symmetric about the line of equality (solid line in Figure 7). One possibility is that the submillimeter estimates are in fact correct and that our assumed conversion between mid-IR and IR luminosities does not apply to SMGs. The IRS sample considered here consists of just one hyper-luminous galaxy at , and if we ignore this galaxy then the systematic offset of SMGs may indicate a breakdown of our assumed conversion for the most luminous sources at redshifts with L⊙. The second possibility is that the submillimeter estimates overpredict the infrared luminosities of SMGs and that our MIR-to-IR conversion is correct. This may not be surprising since the conversion between submillimeter flux and bolometric luminosity is very sensitive to the assumed dust temperature, and a decrease in the assumed temperature of just a few degrees can reduce the inferred bolometric luminosity by a factor of (see example above). Finally, it is possible that neither the submillimeter or mid-IR inferred infrared luminosities of bright SMGs is correct. We note that it is common for these luminous galaxies to host AGN, and this can alter the observed mid-IR and IR fluxes beyond what would be expected given pure star formation (e.g., Armus et al. 2004; Fadda et al. 2002; Almaini et al. 1999; Fabian & Iwasawa 1999). As another example, Arp 220 has anomalously low PAH emission for its bolometric luminosity (when compared with other ULIRGs), suggesting that the galaxy contains a buried quasar and/or a heavily dust-enshrouded starburst such that the extinction at rest-frame m is no longer negligible (e.g., Haas et al. 2001; Charmandaris et al. 1997). Spitzer IRS observations of bright radio-detected SMGs will be useful in quantifying the relationship between the m and bolometric luminosities of these ultraluminous sources.
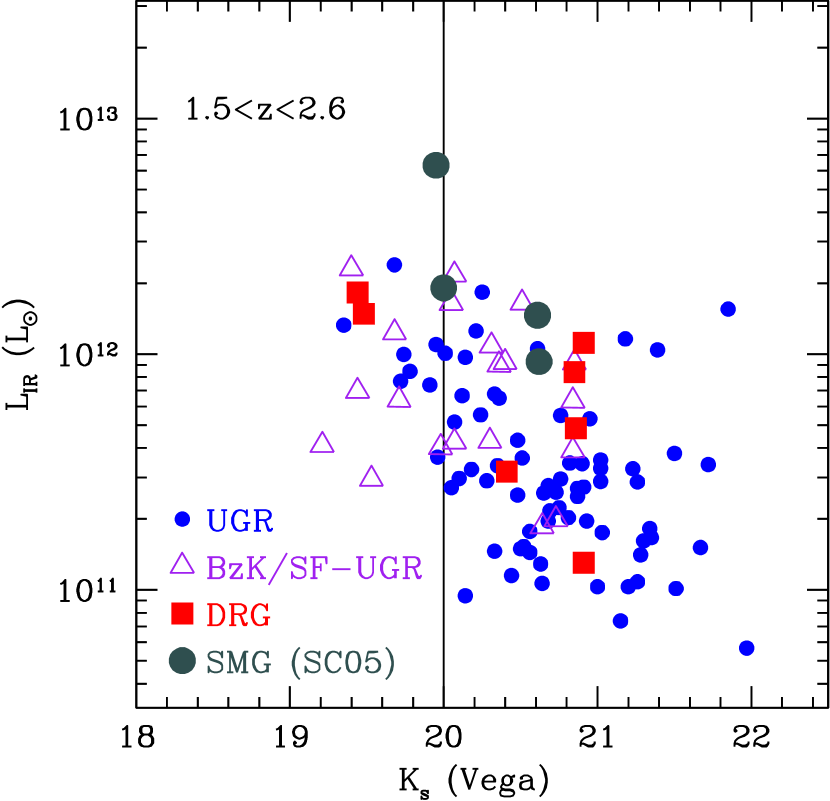
A relevant line of investigation is to determine what the various optical and near-IR color and magnitude selections imply for the infrared luminosity distributions of the galaxies they select. Figure 8a shows the inferred of galaxies with redshifts as a function of magnitude. We have assumed the IR/MIR flux ratio of for the radio-detected SMGs shown in the figure. Galaxies with (e.g., K20 samples: Cimatti et al. 2002a; Cimatti et al. 2002b) have L⊙, similar to the value found by Daddi et al. (2005) for selected galaxies in the GOODS-N field. Alternatively, we find L⊙ for , , and DRG galaxies with . As stated in § 5.1, the uncertainties on any individual value of are dex for galaxies with spectroscopic redshifts and dex for near-IR selected (; DRG) galaxies with photometric redshifts. At any given magnitude, the range in spans an order of magnitude assuming our constant conversion and larger than an order of magnitude assuming the two power-law conversion of Elbaz et al. (2002). Finally we note that galaxies with at which show some signature of star formation (i.e., those that are MIPS detected) generally have infrared luminosities that are a factor of two larger than those of galaxies with . As discussed elsewhere, there is also a population of massive galaxies with little detectable star formation (e.g., van Dokkum et al. 2004; Reddy et al. 2005).
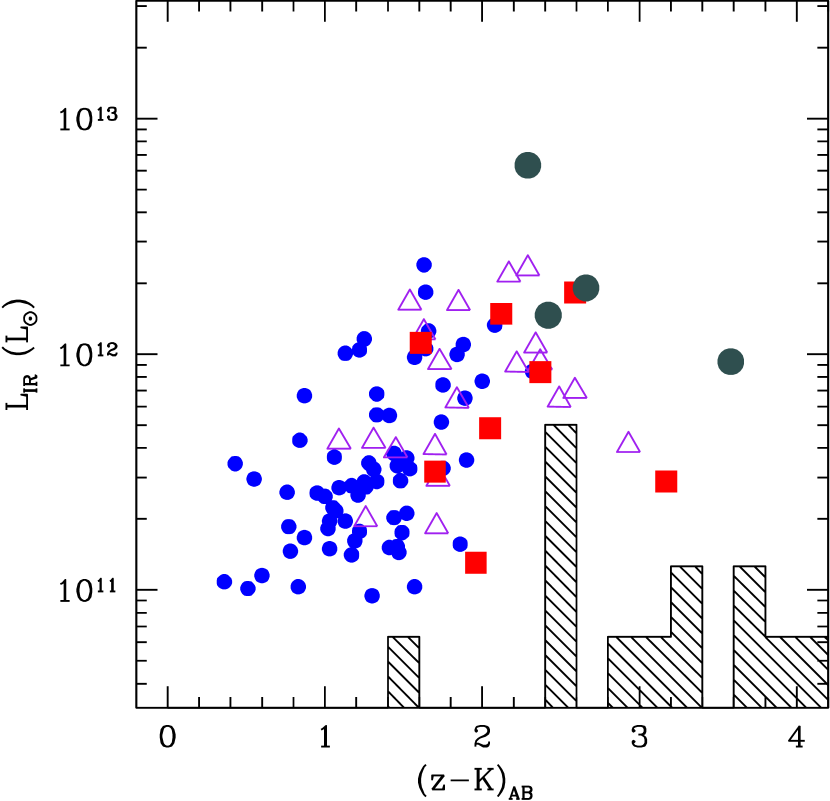
We investigate this quiescent population of massive galaxies in the context of their star-forming counterparts by examining as a function of color (Figure 8b). The color probes the Balmer and Å breaks for galaxies at the redshifts of interest here, and is also sensitive to the current star formation rate (e.g., Reddy et al. 2005; Daddi et al. 2004). Figure 8b shows that galaxies with redder color (up to ) have higher inferred (and larger SFRs if the bolometric luminosity is attributed to star formation) on average than galaxies with bluer colors, a trend similar to that found when stacking X-ray data (Reddy et al., 2005). A more interesting result is indicated by the histogram which shows the distribution in color of DRGs and /PE galaxies that are undetected at m. Of the 13 MIPS-undetected DRGs and /PE galaxies, 7 have . Reddy et al. (2005) found DRGs with to have little X-ray emission and had colors similar to those of IRAC Extremely Red Objects (IEROs; Yan et al. 2005). The lack of m detections for these red sources further supports the notion that they have little current star formation. It also rules out the possibility that they harbor Compton-thick obscured AGN as an explanation for their lack of X-ray emission, since we would then expect them to be bright at m.
5.3. Stacked m Flux
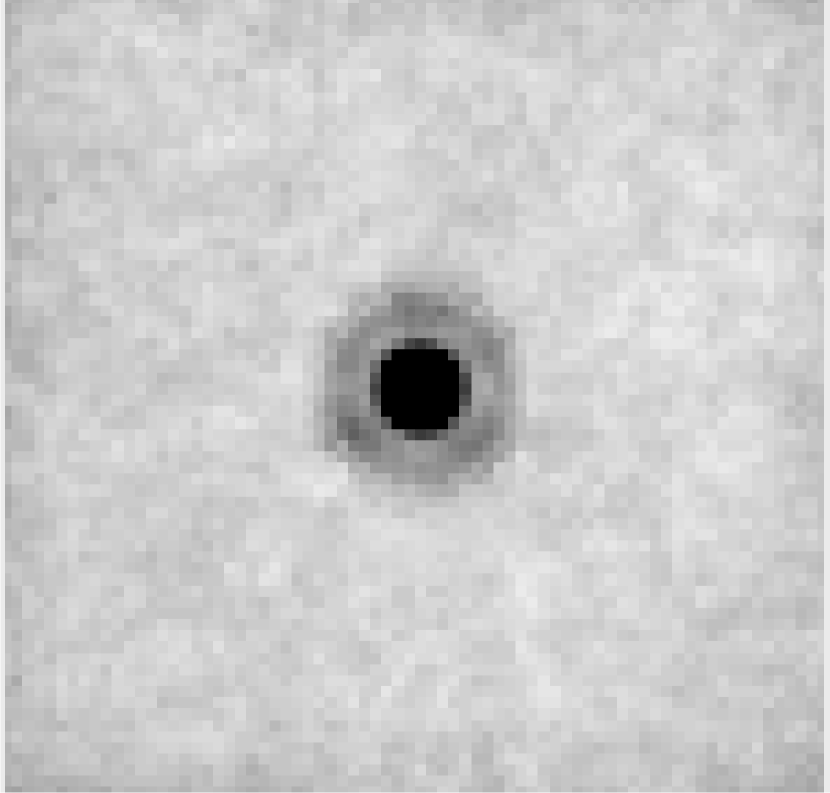
The high quality and depth of the MIPS data enable us to study the average properties of galaxies that are (individually) undetected at m by stacking their emission. The data were stacked by considering all galaxies undetected at m and X-ray wavelengths. To avoid contaminating the stacked signal, we only added galaxies to the stack if there were no bright MIPS sources within of those galaxies. To ensure a clean signal, we extracted sub-images around each undetected galaxy, subtracted all detected point sources within those sub-images using the empirical PSF, and added the sub-images together. The stacked flux was measured in a manner similar to the measurement of detected MIPS sources. Figure 9 shows the stacked image of MIPS-undetected galaxies with spectroscopic redshifts . The mean flux per object is Jy, where the error is the dispersion of the background in the stacked image. At a mean redshift of , this flux corresponds to L⊙. Combining this result with the mean of MIPS-detected galaxies implies a mean across the entire sample, neglecting “confused” sources, of L⊙. This mean value does not change significantly if we add in directly-detected X-ray sources (including radio-detected SMGs to mJy) because of their small number compared to the typical (less luminous) galaxy. The mean value of L⊙ is in excellent agreement with the average of L⊙ found from stacked X-ray/radio and dust corrected UV estimates (Reddy & Steidel, 2004). This suggests that the non-detection of galaxies at m is due to them having lower SFRs and not because they are deficient in PAH emission for a given . The advantage of the m data over X-ray/radio data is that we can estimate bolometric luminosities for individual (LIRG) galaxies at rather than ensembles of galaxies.
Combining our estimate of the MIPS-inferred average IR luminosity of galaxies with the stacked radio results of Reddy & Steidel (2004), we find that the radio-IR relation appears valid on average for the sample. To quantify the radio-IR ratio for the sample, we compute the “q” parameter (Condon et al., 1991):
| (3) |
where is the rest-frame GHz flux density in units of W m-2 Hz-1 and
| (4) |
where and are the IRAS and m flux densities in Jy (Helou et al., 1988). The implied “q” value for the sample is if we assume . This value of is in excellent agreement with the value of found for L⊙ galaxies in the IRAS 2 Jy sample (Yun et al., 2001). We also stacked the m data for undetected /PE and DRG galaxies in the same manner as described above, which yielded a mean flux per object of Jy. As noted in § 5.2, most of these sources have very red colors, and their low-level mid-IR and X-ray emission indicate they have low SFRs. Galaxies with Jy are discussed further below.
6. Dust Attenuation in Optical and Near-IR Selected Galaxies
Aside from inferring the infrared luminosity distributions, we can use the MIPS data to examine the relationship between dust extinction and rest-frame UV spectral slope. Meurer et al. (1999) found a relation between the rest-frame UV spectral slope, , and the attenuation of local UV-selected starburst galaxies, parameterized by the ratio , where is the rest-frame Å luminosity uncorrected for extinction. This relation appears to fail, however, for the most luminous starbursts such as ULIRGs (Goldader et al., 2002) and radio-detected SMGs (Chapman et al., 2005). A greater proportion of the star formation in galaxies with L⊙ will be obscured by dust as compared with LIRG-type starbursts (e.g., see § 7). Therefore, whatever UV emission is able to escape from the optically-thin regions of ULIRGs will constitute a lower fraction of the total bolometric luminosity. As a result, the rest-frame UV light can substantially underpredict (by a factor of ) the bolometric luminosities of the most luminous starbursts, such as radio-detected SMGs (Chapman et al., 2005). Normal (“quiescent”) star forming galaxies also appear to deviate from the Meurer et al. (1999) relation, such that is lower for a given amount of UV reddening than in starburst galaxies (e.g, Laird et al. 2005; Bell 2002) a result that may be tied to the varying ratio of current to past-average star formation rate of normal star forming galaxies (Kong et al., 2004). Alternatively, the star formation in local quiescent galaxies (i.e., those with low SFRs) is more distributed than in local starbursts so that a failure of the starburst reddening law may reflect a different distribution of dust with respect to the star forming regions in quiescent galaxies. Observations of radio-detected SMGs and quiescently star-forming galaxies suggests that the Meurer et al. (1999) and Calzetti et al. (2000) laws do not apply to these sources.
The rest-frame UV spectral and mid-IR data of galaxies allow us to investigate how well the high redshift galaxies follow the local dust attenuation relation. The full SED modeling of galaxies in the GOODS-N field yields estimates of the best-fit star formation history (), age, mass, SFR, and color excess for each galaxy (Erb et al. 2006b; Shapley et al. 2005). The mean fractional uncertainty in is as determined from Monte Carlo simulations. To convert to we assumed that mag of extinction at Å () corresponds to (e.g., Calzetti et al. 2000). For most galaxies, the best-fit star formation history is close to that of a constant star formation history (with decay time-scale ). The most massive galaxies at (with stellar masses M⊙) are generally better fit with declining star formation histories. We have assumed a CSF model for galaxies unless such a model provides a much poorer fit to the observed data than a declining star formation history.
6.1. Results for Optically Selected Galaxies
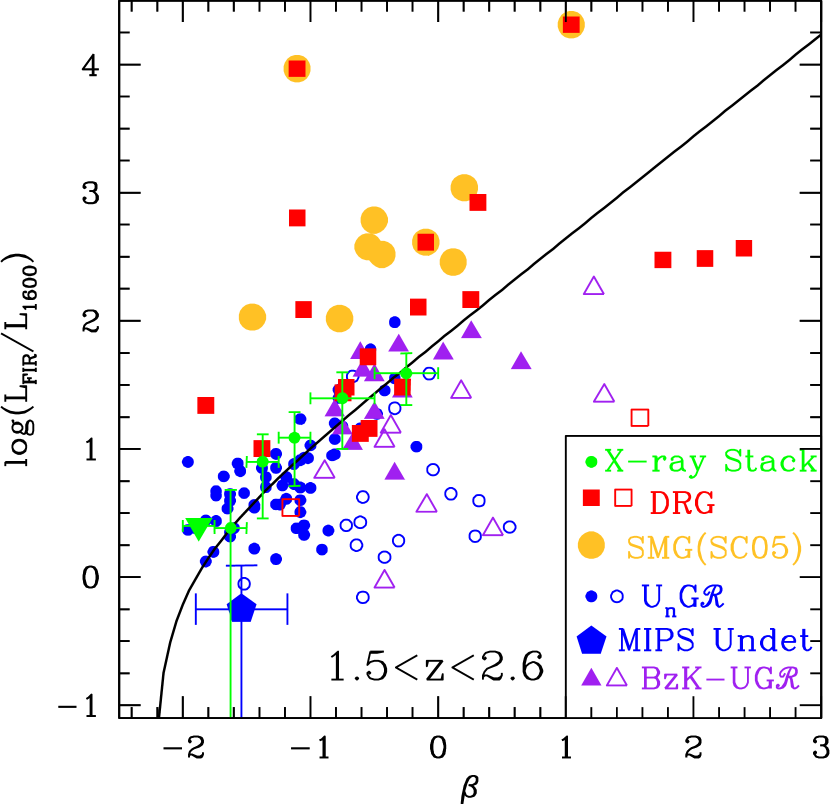
Figure 10 shows versus for spectroscopically-confirmed galaxies with redshifts . The FIR luminosity is computed from using the procedure described in § 5.1. We estimated the rest-frame Å luminosity from either the , , or magnitude depending on the redshift of the galaxy. The majority of galaxies with inferred ages Myr (solid circles) appear to agree well with Meurer et al. (1999) relation, shown by the solid curve555Assuming the two power-law conversion to compute results in a similar distribution of points around the Meurer et al. (1999) relation but with larger scatter..
galaxies with the youngest inferred ages ( Myr; open circles) exhibit a large offset from the Meurer et al. (1999) relation in the sense that they exhibit redder UV colors for a given dust obscuration than older galaxies which do follow the relation. Note that we have assumed a CSF model for the young galaxies shown in Figure 10. The inferred ages of these galaxies are typically smaller than Myr, which is approximately the dynamical time across the galaxy. Assuming such small (and unrealistic ages) will cause us to overestimate for these sources. The change in that results from fixing the age of the young galaxies to Myr () is not enough to completely account for the offset of the young galaxies from the Meurer et al. (1999) relation. This suggests that Calzetti et al. (2000) law may not be applicable to these young galaxies because of a different configuration of dust with respect to the star-forming regions, in which case a grayer extinction law may be appropriate. As one example, the well-studied lensed Lyman Break Galaxy MS1512-cB58 has an inferred age of Myr and millimeter continuum observations suggest that its infrared luminosity is smaller than one would predict from its UV reddening (Baker et al., 2001). Regardless of the assumed extinction law, these young galaxies in the samples examined here have similar bolometric (sum of observed IR and UV) luminosities as older galaxies (see § 7).
The deep X-ray data in the GOODS-N field allow us to estimate (X-ray inferred) average infrared luminosities for well-defined samples of galaxies (e.g., Reddy et al. 2005; Laird et al. 2005; Nandra et al. 2002; Brandt et al. 2001). The green points in Figure 10 show the expected dust absorption inferred from the X-ray data as a function of . These points were determined by stacking the X-ray data for non X-ray detected galaxies (with ages Myr) in bins of . We only considered stacking galaxies with ages Myr since the X-ray emission is sensitive to the star formation rate once O and B stars evolve to produce high mass X-ray binaries, which is roughly years after the onset of star formation. The average X-ray flux per bin was converted to a FIR flux using the Ranalli et al. (2003) relation. Dividing the average FIR flux per bin by the average Å luminosity of objects in each bin yields the green points. The horizontal error bars indicate the bin width and the vertical error bars indicate the dispersion in stacked X-ray flux (computed using the procedure described in Reddy et al. (2005) and Reddy & Steidel (2004)) added in quadrature with the dispersion in the FIR/X-ray luminosity relation found by Ranalli et al. (2003). The X-ray results reproduce the Meurer et al. (1999) relation very well, providing an independent confirmation that typical galaxies abide by the local dust obscuration relation for starburst galaxies. The X-ray and mid-IR data indicate that the UV slope can be used to deduce the extinction corrections for these typical galaxies and that such galaxies have UV light that is only moderately extinguished in most cases. The agreement between the MIPS inferred FIR luminosities and X-ray inferred FIR luminosities (obtained with the empirically-determined Ranalli et al. (2003) relation) suggests that the Ranalli et al. (2003) relation provides a reasonable description for most of the galaxies considered here. For comparison, adopting the Persic et al. (2004) relation would yield FIR luminosities five times in excess of those predicted from the m fluxes for the vast majority of galaxies.
We compute the average dust obscuration of galaxies undetected at m using the stacking results of § 5.3, and the result is denoted by the large pentagon in Figure 10. The stacked m FIR luminosity of MIPS undetected galaxies is divided by their average rest-frame Å luminosity. For these galaxies, is on average times larger than their inferred indicating they are significantly less obscured than galaxies detected at m. These undetected galaxies also have relatively blue rest-frame UV SEDs (as indicated by their average ) compared to m detected galaxies. Furthermore, the results of Figure 4 indicate these faint sources have lower X-ray emission than m detected galaxies. All of these observations combined suggest that galaxies are undetected at m because they have lower SFRs and are less obscured than galaxies with brighter m fluxes. We further explore the nature of these MIPS undetected sources in § 8.
6.2. Results for Near-IR and Submillimeter Selected Galaxies
Also shown in Figure 10 are /SF galaxies to not satisfying the criteria. As pointed out in § 5.2, these /SF selected galaxies have inferred that are comparable to those of galaxies to the same limit, but of course with redder colors and a mag fainter on average than galaxies to the same limit. The results of Figure 10 suggest that /SF galaxies lying outside the color range selected by the criteria also follow the Meurer et al. (1999) relation. Similar to the results found in § 6.1 for most galaxies, the mid-IR data indicate that the UV light from most /SF galaxies appears to be moderately extinguished and that the UV slope can be used to estimate their attenuation.
Almost all of the radio-detected SMGs considered here have inferred dust absorption factors (when we assume the m-inferred bolometric luminosities) that are at least a magnitude larger than predicted by the Meurer et al. (1999) relation for a given rest-frame UV slope. The discrepancy is not as substantial (i.e., it is reduced by a factor of ) if we inferred of the SMGs from their m fluxes assuming our conversion between MIR and IR luminosity. The criteria are designed to select objects where followup spectroscopy is feasible, and this usually implies setting a limit to the allowed (or ) of objects in the sample. However, given that at least half the galaxies with L have UV slopes comparable to that of the typical galaxy, it is not uncommon to find such dust-obscured galaxies in optical surveys.
Of the limited sample of DRGs with photometric redshifts , at least half lie above the local starburst attenuation law. We are able to find DRGs that agree with the Meurer et al. (1999) relation since the MIPS data studied here are significantly deeper (by a factor of ) than the data considered in Papovich et al. (2005). In particular, we find the surface density of DRGs between with of arcmin-2 (this is a lower limit since there are number of DRGs without photometric redshifts, some of which may truly lie at redshifts ), which is at least a factor of higher than in Papovich et al. (2005). Our results suggest that the DRG population consists of galaxies with a very wide range in star formation rate, from galaxies with little or no star formation (DRGs with very red colors; § 5.2) to those which are heavily obscured and rapidly forming stars.
6.3. Relationship between and Obscuration as a Function of Luminosity
Figure 10b shows galaxies with ages Myr within the samples, color-coded by their . Virtually all objects with in the range L⊙ have which appear to reproduce their obscuration as inferred from the Meurer et al. (1999) and Calzetti et al. (2000) laws. There is some weaker evidence that the galaxies with the lowest SFRs (undetected at m) as indicated by the green pentagon in Figure 10b follow a different extinction law. More pronounced, however, is the systematic offset of the most luminous galaxies considered here with L⊙. These ultraluminous galaxies have rest-frame UV slopes that underpredict their obscuration by a factor of . The main results of Figure 10b indicate that the relationship between UV reddening and obscuration is strongly dependent on the bolometric luminosity, but that most LIRG galaxies at follow the local relation.
7. Relationship Between Dust Obscuration and Bolometric Luminosity
The bolometric luminosity of star-forming galaxies can be well-approximated by the sum of the IR and UV luminosities as indicated in Equation 5. Figure 11 shows as a function of dust obscuration for objects in the various samples assuming a constant conversion relation between mid-IR and total IR luminosity. Typical (LIRG) galaxies at will have where of the bolometric luminosity is emitted in the infrared. The bolometric luminosity is strongly correlated with dust obscuration: galaxies with larger bolometric luminosities are more dust obscured than less luminous galaxies. The best-fit linear trend for spectroscopically-confirmed galaxies detected at m is
| (5) |
(solid line in Figure 11; we note that the two axes are not independent of each and may partly account for the tight scatter in the correlation). galaxies undetected at m are indicated by the pentagon. These undetected galaxies have an average bolometric luminosity of L⊙ and have UV luminosities that are a factor of less dust obscured than the typical m detected galaxy. Approximately half of the bolometric luminosity of these m undetected galaxies is emitted in the UV. Galaxies with inferred ages Myr (yellow symbols in Figure 11) have comparable to those of older galaxies at , suggesting that these young galaxies have similar IR/MIR ratios as older galaxies. Therefore, the deviation of the young galaxies from the Meurer et al. (1999) law as noted in § 6 suggests that we have over-estimated for these young sources and/or they may follow a steeper (e.g., SMC-like) extinction law.
We note that galaxies with have bolometric luminosities and dust obscuration comparable to galaxies to that are not optically selected. This implies that objects missed by optical selection but which appear in the near-IR selected sample are not missed because they are more dust obscured, a result corroborated by X-ray stacking analyses (Reddy et al., 2005). The bright radio-detected SMGs have the highest inferred bolometric luminosities among all galaxies considered here, of order L⊙ with dust obscuration factors . Galaxies in the , , and radio-detected SMG samples detected at m mostly follow the linear relation denoted by the solid line in Figure 11. For SMGs, , so assuming the submillimeter estimates of (rather than the mid-IR estimates shown in Figure 11) will move the SMGs in a direction parallel to the trend.
DRGs detected at m span a large range in . About half the DRGs follow the linear trend established for optically selected galaxies at . The remaining half of DRGs have similar bolometric luminosities to those which follow the trend, but the UV luminosities are a magnitude more attenuated than what we would have predicted from the Meurer et al. (1999) law. The SED analysis (§ 4) demonstrates that all of the DRGs which follow the trend are all relatively young galaxies (ages Gyr) and have lower stellar masses ( M⊙). In contrast, DRGs which are offset from the trend are all older (ages Gyr) and all have masses M⊙. The offset could be explained naturally if the dust masses of galaxies increase as they age, a natural consequence of star formation. Note that if the massive, metal-rich DRGs have stronger PAH flux for a given IR luminosity than the younger galaxies, then this would serve to only increase the offset between the massive DRGs and the trend. In fact, stacking the X-ray data for the younger and older DRGs indicates they have very similar bolometric luminosities, confirming the results obtained by inferring from the PAH flux. The results of Figure 11 suggest that much of the dust in galaxies with the largest stellar masses was produced by star formation prior to the episode currently heating the dust. Therefore, such galaxies will have larger dust obscuration for a given bolometric luminosity. Assuming the two power-law conversion of Elbaz et al. (2002) would result in a trend with a slope larger than given in Equation 5, but with approximately the same intercept within the uncertainties, so our conclusions would be unchanged.
As galaxies are enriched with dust as they age, then we expect to see an even greater difference in dust obscuration between galaxies and those at the present epoch. To investigate this, we examined versus for the sample of local galaxies compiled by Bell (2003), shown by crosses in Figure 11. The local sample includes the ULIRGs studied by Goldader et al. (2002). Unfortunately, the UV and IR data for local LIRG and ULIRGs are relatively sparse. However, of the small sample of local galaxies with L⊙, almost all ( of ) lie to the right of the linear trend at and at least half occupy the same region as the old, massive DRGs at . In fact, an interesting corollary to the above discussion is that massive, star-forming DRGs at are more analogous to local ULIRGs than bright SMGs at , both in terms of bolometric luminosity and dust-obscuration. Local ULIRGs undoubtedly carry a significant amount of dust into their current star formation episodes (e.g., Goldader et al. 2002), so it not surprising that they have similar dust-obscuration factors as massive, star-forming DRGs at . On the other hand, most galaxies lying on the trend, including many bright SMGs, are likely undergoing their first major episode of star formation and have relatively low dust-to-gas ratios, unlike the more massive (offset) DRGs and local galaxies.
The offset between and galaxies can be seen at fainter bolometric luminosities where the local sample includes more galaxies (). Restricting our analysis to galaxies in the Bell (2003) sample with comparable to those of m undetected galaxies, we find that the local sample is on average times more dust obscured than m undetected galaxies at . Further, recent GALEX results indicate that local near-UV selected galaxies with L⊙ have a mean dust obscuration factor of ; this is times larger than the inferred dust obscuration of a L⊙ galaxy at (Burgarella et al., 2005). To summarize, the important result from Figure 11 is that galaxies of a given bolometric luminosity are on average a factor of less dust obscured at than at the present epoch, confirming the trend first noted by Adelberger & Steidel (2000) between galaxies at , , and ; this result is also suggested by the work of Calzetti & Heckman (1999). Again, this result could be anticipated if successive generations of star formation add to already existing dust within galaxies and/or if the dust distribution within galaxies becomes more compact with time (e.g., via the effects of mergers which tend to drive gas and dust to the central kpc of the system). The net result of dust enrichment and a more compact distribution of dust (e.g., after a merger event) is an increase in the dust column density towards star-forming regions. The relationship between dust obscuration and (i.e., Eq 5) indicates that for the mean of the selected sample of galaxies of L⊙, the average dust obscuration is . This factor is in excellent agreement with the mean attenuation of inferred from stacked X-ray analyses (Reddy & Steidel, 2004). One would observe a factor of attenuation in a galaxy one order of magnitude less luminous at than at . The implication is that, while it is true that a larger fraction of star formation at high redshifts occurs in dustier systems, the dust obscuration we observe for galaxies of a given has less of an impact on observations of high redshift galaxies than one would have surmised on the basis of present day galaxies.
8. Properties of m Faint Galaxies
8.1. Ages and Masses of Faint m Galaxies
In addition to the information gleaned from the stacking analysis described above, we also have detailed information on the stellar populations of galaxies with faint mid-IR emission. Optical and near-IR selected galaxies undetected at m appear to have a distribution in ages which is similar to that of m detected galaxies (left panel of Figure 12), so young ages cannot explain why they are undetected at m. Alternatively, although we find a large range in inferred stellar mass of galaxies with Jy, the mean stellar mass of undetected objects is dex lower in than m detected galaxies (right panel of Figure 12). Regardless of these small differences in the stellar populations of m detected and undetected sources, the X-ray data indicate that the primary reason why galaxies are undetected at m is because they have lower SFRs (Figure 4). We demonstrate in the next section how the rest-frame UV spectral properties of galaxies can be used to interpret their m emission.
8.2. Composite UV Spectra
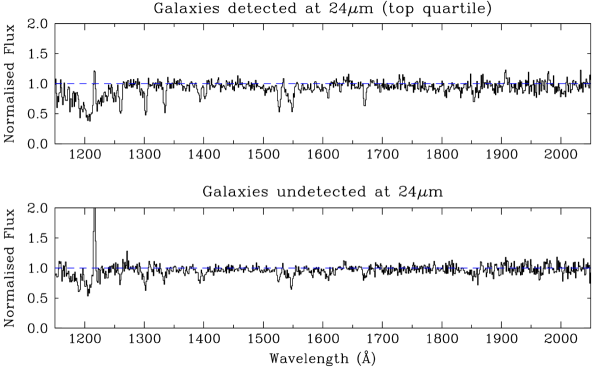
A unique advantage of our optical selection is the efficiency with which we are able to obtain rest-frame UV spectra for these galaxies, and this spectroscopy allows for an independent probe of the physical conditions in the ISM. While the S/N of any individual spectrum is typically too low to accurately measure interstellar absorption line widths, we can take advantage of the large number of spectra by stacking them to create a higher S/N composite spectrum. To investigate differences in the ISM as a function of infrared luminosity, we constructed composite UV spectra for (a) the top quartile of m detected galaxies, and (b) all galaxies undetected at m. In order to stack the spectra, we first de-redshifted them by the systemic redshift. The systemic redshift was inferred from a weighted combination of the measured absorption and/or emission line redshifts, following the procedure of Adelberger et al. (2003). We used the Rix et al. (2004) prescription to normalize the composite spectra to the underlying stellar continua. The detected and undetected composite spectra consist of and galaxies, respectively, and are shown in Figure 13. For comparison, the mean m flux of MIPS detected and undetected galaxies is Jy and Jy, respectively; both sub-samples have . Table 3 lists the measured rest-frame equivalent widths of several interstellar absorption lines in the composite spectra. The primary difference between the rest-frame UV spectra of m detected and undetected galaxies is that the latter have interstellar absorption lines that are a factor of 2 weaker than the lines in the m detected galaxies. Because the line strengths are controlled by the combination of the velocity spread in outflowing interstellar material and the covering fraction of optically-thick material, this indicates that galaxies weak in mid-IR emission are likely to have more quiescent ISM than m-bright galaxies, a result expected if those galaxies undetected by MIPS have lower SFRs, and hence lower energy input into the ISM and a lower level of dust enrichment, than m detected galaxies.
| Line | aaTransition wavelength in Å. | Detected WλbbMeasured rest-frame equivalent width in Å.
|
Undetected WλbbMeasured rest-frame equivalent width in Å.
|
|---|---|---|---|
| Si II | 1260.4 | 2.58 | 0.99 |
| OI + Si II | 1303.3 | 2.27 | 1.58 |
| C II | 1334.5 | 2.05 | 0.94 |
| Si II | 1526.7 | 2.36 | 1.32 |
| Fe II | 1608.5 | 0.87 | 1.15 |
| Al II | 1670.8 | 1.85 | 1.15 |
| Al III | 1854.7 | 1.66 | 0.55 |
| Al III | 1862.8 | 0.81 | 0.64 |
Comparing the mid-IR detections with nondetections, we find the latter have significantly stronger Ly emission than the former. The emergent Ly profiles of galaxies will depend strongly on a number of physical parameters including the spectrum of UV radiation (i.e., the stellar IMF), presence of outflows, and dust covering fraction. Neglecting all of these effects, galaxies with larger SFRs will have stronger Ly emission. However, given that the bolometric luminosity of star-forming galaxies scales with dust-obscuration (e.g., Figure 11), we might expect m detected galaxies to have larger dust column densities than undetected galaxies; this may partly explain the absence of Ly emission in m detected galaxies. In addition, the velocity spread of the ISM will also affect the emergent Ly profile: the larger velocity spread in m detected galaxies, as indicated by their stronger interstellar absorption lines, implies most Ly photons will have larger scattering path-lengths and are more likely to be attenuated by dust and/or scattered out of resonance (e.g., Hansen & Peng Oh 2005; Adelberger et al. 2003).
Finally, we note that the stacked X-ray analysis of m-undetected galaxies confirms they have lower SFRs than m-detected galaxies. Therefore, galaxies are undetected at rest-frame m primarily because they have lower SFRs and not because they are deficient in mid-IR PAH luminosity for a given . If such undetected galaxies had depressed MIR/IR flux ratios, we would not have expected to see as large a difference in the strengths of their interstellar absorption lines as compared with m detected galaxies.
9. Mid-IR Properties of Massive Galaxies at
The epoch between and appears to be the most active in terms of the buildup of stellar mass (e.g., Dickinson et al. (2003), see also § 1), but significant numbers of massive galaxies ( L⊙) already appear to be in place by redshifts . The subsequent evolution of these massive galaxies and their relation to the local population of massive and passively evolving elliptical galaxies is an important question. It is useful to determine, therefore, what the mid-IR properties of massive galaxies tell us about their bolometric luminosities.
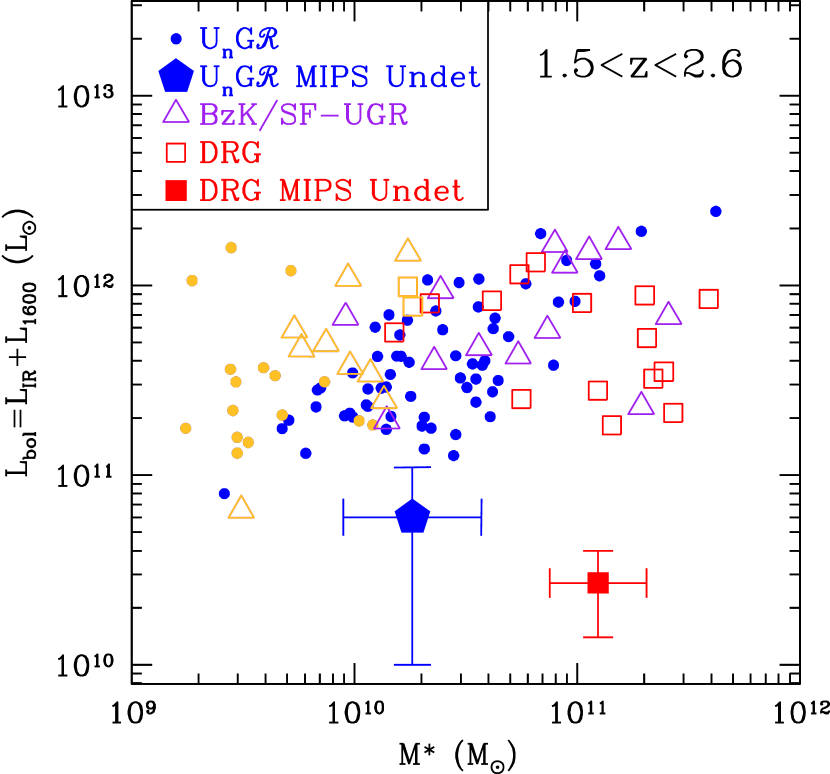
Figure 14 shows the bolometric luminosity of galaxies in the , , and DRG samples as a function of best-fit stellar mass. The mass modeling comes from the SED analysis where we have fit for the ++IRAC photometry assuming a constant star formation (CSF) model. As discussed elsewhere, the stellar mass is the most well determined parameter from the SED analysis and is relatively insensitive to the assumed star formation history (Shapley et al. 2005; Papovich et al. 2001). There are several interesting aspects worth considering in Figure 14. First, we note that galaxies with the youngest inferred ages ( Myr) have low stellar masses ( M⊙) and span a large range in bolometric luminosity from LIRG- to ULIRG-type galaxies. Among galaxies with spectroscopic redshifts , we note a trend of increasing with stellar mass; galaxies with M⊙ have infrared luminosities typical of ULIRGs. The /SF and DRG criteria cull M⊙ galaxies with a large range in bolometric luminosity, from L⊙ to L⊙. Optically selected sources undetected at m have stellar masses similar to those of detected galaxies, but with a factor of lower. As noted before, the m emission from these galaxies appears to be primarily dependent on their current star formation rate. Finally, we note that DRGs undetected at m have similar stellar masses as those which are detected ( M⊙), but are on average times less bolometrically luminous. As noted in § 5.2, these m-undetected DRGs have very red colors. Their faint m emission corroborates the results of X-ray stacking analyses that indicate these galaxies have very little current star formation (Reddy et al., 2005).
The results of Figure 14 suggest that galaxies with large stellar masses at span a large range in bolometric luminosity, from galaxies with little star formation to ULIRG-type systems. The range is likely larger than what one would infer from Figure 14 since we have excluded directly-detected X-ray sources that may be heavily star-forming galaxies and/or host AGN. Figure 14 suggests that of massive galaxies ( M⊙) with redshifts in optical and near-IR surveys have L⊙ (or SFRs , assuming the SFR calibration of Kennicutt 1998a). Our results imply that most galaxies with large stellar masses ( M⊙) have levels of star formation that exceed those of LIRGs.
10. Discussion
10.1. Selection of LIRGs and ULIRGs at
In § 5.2 we showed that optical and near-IR selected samples to , or , host galaxies with a wide range in infrared luminosity, from a few times L⊙ up to the most luminous objects at these redshifts with L⊙. Typical galaxies in these samples have infrared luminosities in the range L⊙, similar in luminosity to, but with dust-obscuration a factor of lower than (see § 7), local LIRGs. One advantage of optical (i.e., rest-frame UV) selection of LIRGs and ULIRGs at high redshift is that it allows for the kind of efficient spectroscopic followup necessary to accurately interpret the nature of m emission from these galaxies. As shown in § 4, the K-correction depends sensitively on redshift such that even for “good” photometric redshift estimates with , the corresponding uncertainty in the rest-frame m luminosity increases by a factor of 5. A particularly unique aspect of our study combining the optical sample with MIPS observations is that the spectroscopic database can be used to assess the physical conditions of the ISM in galaxies as function of , providing an additional method for probing the detailed nature of m galaxies at (§ 8.2). Aside from the constraints on the mid-IR luminosities possible with spectroscopic redshifts, precise positions of sources from higher spatial resolution and shorter wavelength data enable the deblending of most galaxies. The deblending procedure made possible by optical, near-IR, and Spitzer IRAC observations enable accurate identification and photometry of faint galaxies well below the MIPS m confusion limit and will provide a more complete “census” of the LIRG population at redshift than possible using MIPS observations alone.
Further, selection by optical colors gives important information on the unobscured component of the star formation in galaxies and complements well the information on the obscured component probed by the m observations. Objects with lower star formation rates will have bolometric luminosities that are typically dominated by the observed UV emission and objects with larger star formation rates will have bolometric luminosities that are dominated by the observed IR emission. The transition between the UV and IR dominated regimes (i.e., where ) at occurs for galaxies with L⊙, or about (Figure 11). A comparison with the sample of Bell (2003) shows that the bolometric luminosities begin to be dominated by IR emission (i.e., ) for galaxies which are two orders of magnitude more luminous at than at the present epoch. As discussed in § 7, this is plausibly explained as a result of higher dust-to-gas ratios in the local galaxies. More generally, galaxies of a given dust obscuration are anywhere from 2-100 times more luminous at than locally (Figure 11), with the greatest difference for galaxies with relatively low . The implication of these observations is that while it is certainly true that a larger fraction of the star formation at high redshifts occurs in dustier galaxies, selection via rest-frame UV colors (and performing followup spectroscopy) is easier at high redshift than locally for galaxies at a given bolometric luminosity. Optical selection is therefore arguably the most promising and spectroscopically efficient method for selecting LIRGs (which undoubtedly account for a significant fraction of the star formation rate density and far-infrared background; e.g., Adelberger & Steidel 2000) at .
As demonstrated in § 5.2 and in Reddy et al. (2005), ULIRGs and SMGs at these redshifts also often appear in optical and near-IR selected samples; of the most luminous SMGs have enough unobscured star formation that they satisfy the optical criteria (Chapman et al., 2005). Accounting for the obscured portion of star formation in these ultraluminous sources of course requires the longer wavelength data since rest-frame UV slopes underpredict their (§ 6). In some sense, m observations are a more powerful method of estimating of these ultra-luminous sources since their detection significance at m is typically times larger and the beamsize is a factor of smaller than at m. The ability to uniformly cover large areas of the sky with MIPS observations provides an additional advantage over current submillimeter surveys which suffer from areal and depth incompleteness, thus making it difficult to constrain the volumes probed. Using m observations to assess the global energetics of ultraluminous sources of course requires that we accurately calibrate the ratios for these objects.
We have demonstrated that the typical galaxy in optical and near-IR samples of galaxies has corresponding to that of LIRGs. A related issue is whether most LIRGs at can be selected by their rest-frame UV or optical colors. A direct comparison of the number counts of MIPS sources to the number of m detected and galaxies to Jy (the GOODS-N MIPS m sensitivity limit) is not possible since (a) we primarily relied on the -band data to deblend sources in the m imaging and (b) the redshift distribution of MIPS sources to Jy is not yet well established. Nonetheless, including both optical and near-IR selected LIRGs at ensures that we must be reasonably “complete” for both optically-bright (and m-faint) LIRGs in the optical sample and optically-faint (and m-bright) LIRGs in the near-IR selected and DRG samples. Galaxies with LIRG luminosities will predominantly have near-IR magnitudes bright enough to be considered in our analysis (i.e., according to the left panel of Figure 8). Objects not selected by these various criteria will likely either fall at different redshifts, not have LIRG luminosities, and/or may be scattered out of the color selection windows due to photometric error (e.g., Reddy et al. 2005). As an example of one form of photometric scatter, in the course of the Lyman Break Galaxy Survey, we relied on photometry based on images of the HDF-North field taken at the Palomar Hale m Telescope (Steidel et al., 2003). We subsequently imaged a larger portion of the GOODS-North field using the Keck I Telescope (Steidel et al., 2004). Our photometric analysis indicates that of the BX/BM objects to identified in the Palomar imaging, about were recovered as BX/BM objects in the Keck imaging. A small fraction of the remaining were recovered using LBG selection. The level of scatter between different photometric realizations in other fields is also typically and is mostly due to the narrow photometric windows used to select BX/BM galaxies. Regardless of these photometric effects, it is highly unlikely that there exist large numbers of LIRGs at with such different optical and near-IR properties that they would be completely absent from all the samples considered here. Finally, our knowledge of the exact positions of optical and near-IR selected galaxies from the higher spatial resolution -band and IRAC data allows us to mitigate the effects of confusion (see § 3), so we should be reasonably complete for galaxies which are detected at m to Jy but which might otherwise be confused with brighter sources. It is therefore reasonable to conclude that the LIRG population at is essentially the same population of galaxies that are selected in optical and near-IR samples.
10.2. Mass Assembly at High Redshift
We demonstrated that LIRGs and ULIRGs are present over the full range of stellar mass, from M⊙ to M⊙, for galaxies in the samples considered here (Figure 14). To assess the significance of the current star formation in the buildup of stellar mass, we have computed the specific star formation rate, , defined as the SFR per unit stellar mass. We show the observed for galaxies in our sample as function of stellar mass in Figure 15. The correlation between and could have been predicted from Figure 14 since the range of is similar over the range of considered here. We also note that the correlation is accentuated since (a) is not independent of and (b) there are presumably galaxies with low and low that would be missing from the optical and near-IR samples (irrespective of the MIPS detection limit). Furthermore, the upper envelope of points in Figure 15 is defined by our cut to exclude luminous AGN based on the Chandra X-ray data. Nonetheless, we find that star-forming galaxies with large stellar masses M⊙ without an AGN signature have specific SFRs that are to orders of magnitude lower than those of young galaxies (yellow symbols), implying that the current star formation contributes more significantly to the buildup of stellar mass in low mass galaxies than high mass galaxies at . This change in specific SFR as a function of mass has been observed at later epochs as well (e.g., Bell et al. 2005). The shifting of the relationship to lower specific SFRs at later epochs for galaxies with large stellar masses has been referred to as “downsizing” (Cowie et al., 1996).
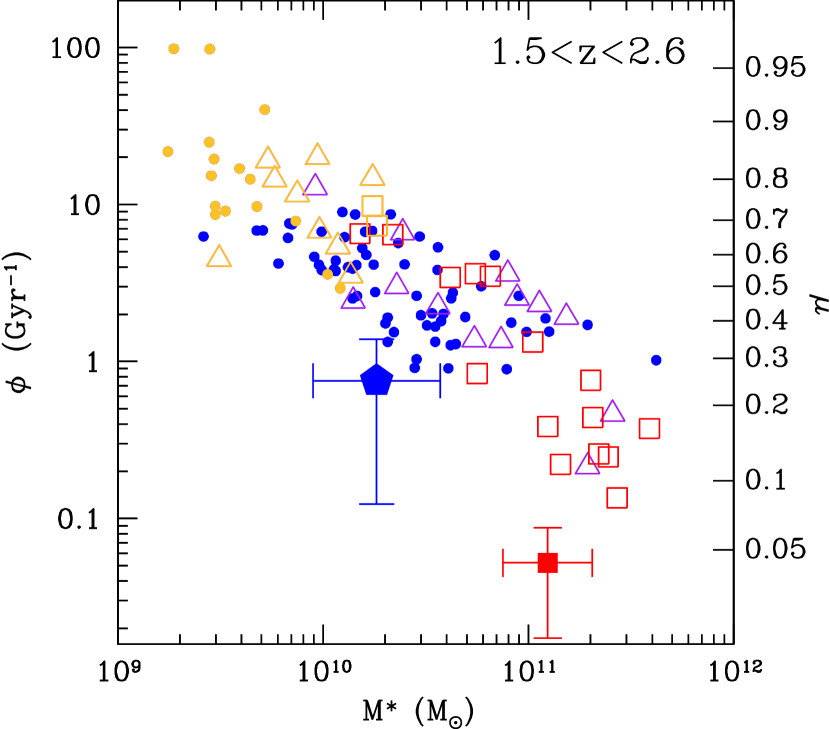
The most massive, star-forming DRGs at these redshifts with large dust-to-gas ratios (see Figure 11) also have the lowest for MIPS-detected galaxies at . Papovich et al. (2005) demonstrate that the integrated specific SFR of these massive DRGs at is magnitudes larger than for galaxies with similar masses ( M⊙) at lower redshifts , based on a comparison with the COMBO-17 sample (Bell et al., 2005). This decrease in suggests that M⊙ galaxies have built up most of their stellar mass by . In fact, the mass-doubling time becomes increasingly large for these massive galaxies if we assume the case of an exponentially declining star formation model. In this case, will evolve with time as
| (6) |
where is the ratio of the gas mass that is lost due to outflows to that formed in stars and is the star formation decay timescale as defined in § 4. Given some initial SFR, a CSF model (i.e., with ) will track straight through the points corresponding to galaxies with M⊙, but such a model would predict a at that is times larger than observed at in the COMBO-17 survey (Bell et al., 2005). Therefore, a declining star-formation history may be more appropriate for describing the future evolution of galaxies with large stellar masses at . In particular, Erb et al. (2006a) find that a model that assumes a super-solar yield of metals (i.e., ratio of mass of metals ejected into the ISM to mass of metals locked in long-lived stars) of Z⊙ and an outflow rate of () appears to best-fit the observed metallicities of galaxies at as a function of gas fraction. If all star-forming galaxies at follow a similar evolutionary track as the M⊙ galaxies (i.e., follow an exponentially declining star formation history with large outflow rate), then the scatter of galaxies with a given specific SFR simply reflects the range in the final stellar masses and dark matter halo masses (see also discussion in Erb et al. 2006a).
We can directly relate the specific SFR with the cold gas fraction, . If we assume that the SFR is proportional to the cold gas mass, , to the power according to the Schmidt law (Kennicutt, 1998b), then
| (7) |
It then follows that
| (8) |
where is a constant that depends on the constant of proportionality between the SFR and gas mass surface densities in the Schmidt law and the total gas mass at virialization (i.e., when star formation commences). There is a one-to-one correspondence between the specific SFR, , and gas fraction, , such that galaxies with large specific SFRs will have a larger fraction of cold gas than galaxies with small specific SFRs. Erb et al. (2006b) demonstrate that decreases as a function of stellar mass for a large sample of galaxies with H spectroscopy, with a mean across the sample of . The mean specific SFR for these galaxies is Gyr-1. Using these mean values to estimate , we show the range of on the right-hand axis of Figure 15. Young galaxies with ages less than Myr in our sample also have the largest gas fractions () and largest specific SFRs (Figure 15) compared with older galaxies at . These results strongly suggest that the young galaxies have large reservoirs of cold gas and have just begun forming stars. Similarly, galaxies with the largest stellar masses have lower specific SFRs and therefore lower cold gas fractions () and are likely to cease star-formation in a relatively short time. The correlation between and revealed by Figure 15 is actually expected from the trend between and inferred from the H spectroscopic analysis of Erb et al. (2006b). Furthermore, Erb et al. (2006a) find a tight trend between metallicity and gas fraction such that galaxies with lower are more metal-rich. These galaxies will therefore be more dust-obscured since metallicity is directly proportional to dust-to-gas ratio. Our analysis confirms our expectation that the most dust-obscured objects at (i.e., the DRGs with the largest dust-to-gas ratios, Figure 11) also have low gas fractions as demonstrated in Figure 15. Figure 15 indicates that the trend in gas fraction versus stellar mass (or, metallicity versus gas fraction) found for -selected galaxies with H spectroscopy (Erb et al., 2006a) also applies to galaxies selected by their near-IR colors.
Combining the optical and near-IR samples, we find a wide range in the evolutionary state of galaxies at , from those which are just starting to form stars to those which have already accumulated most of their stellar mass and are about to become passive or already are. Almost all DRGs with the reddest color () are undetected at m and in the deep Chandra X-ray data (e.g., see right panel of Figure 8 and Figure 16 in Reddy et al. 2005). The specific SFRs of these red DRGs are the lowest observed for the galaxies considered here; they have cold gas fractions of less than , confirming that they have essentially shut-off star formation by . The star-forming DRGs with M⊙ (which are dusty and metal-rich as inferred from their large dust-to-gas ratios; cf., Figure 11) are likely to reach this passively-evolving state by redshifts . A simple model which assumes a high outflow rate proportional to the SFR and exponentially declining star formation history (i.e., the model which appears to best-fit the observed metallicities of galaxies as function of gas fraction; Erb et al. 2006a) is sufficient to explain the presence of galaxies with large stellar masses and little star formation by without invoking AGN feedback, despite the fact that a large AGN fraction of is observed among galaxies with large stellar masses (Reddy et al., 2005).
11. Conclusions
We use Spitzer MIPS data to examine the bolometric luminosities and extinction properties of optical and near-IR selected galaxies at redshifts in the GOODS-North field. At these redshifts, the mid-IR ( m) features associated with polycyclic aromatic hydrocarbon (PAH) emission, which are ubiquitous in local and star-forming galaxies, are shifted into the MIPS m filter. Extensive multi-wavelength data in the GOODS-North field, including very deep Chandra X-ray data, allow us to test the validity of inferring the bolometric luminosities of high redshift galaxies from their rest-frame m emission. Galaxies at are selected by their optical () and near-IR ( and ) colors, and for comparison we also consider radio-detected submillimeter galaxies (SMGs; Chapman et al. 2005). The optically-selected sample is advantageous because we have knowledge of the precise redshifts of galaxies from spectroscopy, allowing for the most accurate estimates of the rest-frame mid-IR luminosities of galaxies. In addition to our spectroscopic sample, we use deep optical, near-IR, and Spitzer IRAC data to derive photometric redshifts for galaxies and those with red colors (Distant Red Galaxies; DRGs). The principle conclusions of this study are as follows:
1. Using local templates to -correct the observed m fluxes, we find that the rest-frame m luminosity () of galaxies correlates well with their stacked X-ray emission. A subset of galaxies with H measurements have H-inferred bolometric luminosities that correlate very well with their -inferred bolometric luminosities (with a scatter of dex). These observations suggest that provides a reliable estimate of for most star forming galaxies at .
2. We find that the optical and near-IR selected galaxies span a very wide range in infrared luminosity from LIRG to ULIRG objects. We find a mean infrared luminosity of L⊙ for galaxies in the optical and near-IR samples, in excellent agreement with the value obtained from a stacked X-ray analysis. The optical and near-IR selected star-forming galaxies likely account for a significant fraction of the LIRG population at . Galaxies with have greater than times that of galaxies with . Non-AGN galaxies with the reddest near-IR colors () are mostly undetected at m suggesting they have low SFRs, a conclusion supported by stacked X-ray analyses.
3. We demonstrate using m and X-ray stacking analyses that galaxies undetected to Jy are faint because they have lower SFRs and/or lower obscuration than m detected galaxies, and not because they are deficient in PAH emission at a given . We infer that typically half of the bolometric luminosity of these m-undetected galaxies is emitted in the UV. Comparing the rest-frame UV composite spectra of m-undetected galaxies with those in the top quartile of detected objects shows that the latter have low-ionization interstellar absorption lines that are times stronger than the former, indicating some combination of more turbulent interstellar media and a larger neutral gas covering fraction. This is consistent with our conclusion that galaxies undetected at m have lower SFRs than m-detected galaxies, and therefore a lower input of kinetic energy and dust into their ISM.
4. The m (and deep X-ray) data indicate that galaxies whose current star-formation episodes are older than Myr and have infrared luminosities L⊙ appear to follow the local relation between rest-frame UV slope and dust obscuration, implying that such galaxies at have moderate amounts of dust extinction and that their UV slopes can be used to infer their extinction. Galaxies younger than Myr have rest-frame UV colors that are redder than expected given their inferred , indicating they may obey a steeper extinction law. These young galaxies have the lowest stellar masses, but span the same range in bolometric luminosity as galaxies with larger stellar masses.
5. Galaxies with L⊙, including radio-detected SMGs, are typically times more dust obscured than their UV spectral slopes would indicate, assuming their m-inferred infrared luminosities. The m-inferred infrared luminosities of radio-detected SMGs are systematically a factor of times lower than those predicted by their m fluxes; adopting the m estimates implies dust attenuation factors that are times larger than their UV spectral slopes would indicate. Regardless, such galaxies will often be blue enough to satisfy the criteria, so finding these dust obscured galaxies in optical surveys is not uncommon.
6. A comparison between the dust obscuration in and galaxies suggests that galaxies of a given bolometric luminosity are much less dust obscured (by a factor of ) at high redshift than at the present epoch. This result is expected (a) as galaxies age and go through successive generations of star formation and dust production and (b) if the distribution of dust and star formation in galaxies becomes more compact over time (e.g., through mergers or interactions) resulting in greater dust column densities towards star-forming regions. We find that star-forming Distant Red Galaxies (DRGs) with stellar masses M⊙ and ages Gyr have bolometric luminosities and dust-obscuration factors similar to those of local ULIRGs, suggesting that such DRGs, like local ULIRGs, carry relatively large amounts of dust into their current episodes of star formation.
7. Galaxies with the largest stellar masses at ( M⊙) also span a large range in bolometric luminosity, from those which have red near-IR colors () with little current star formation to those ULIRG objects found among optical and near-IR selected massive galaxies. Our results suggest of massive galaxies ( M⊙) in optical and near-IR surveys with redshifts have L⊙ (SFRs ), comparable to and exceeding the luminosity of LIRGs.
8. Similar to lower redshift studies, we find a trend between specific SFR (SFR per unit stellar mass) and stellar mass at which indicates that the observed star formation contributes more to the buildup of stellar mass in galaxies with low stellar masses than in those with larger stellar masses at . This trend between specific SFR and stellar mass indicates a strong decrease in cold gas fraction as function of stellar mass, consistent with results from near-IR spectroscopic observations, and suggests that galaxies with large stellar masses ( M⊙) at will quickly cease star formation. Combining optical and near-IR selected samples, we find a large range in the evolutionary state of galaxies at , from those which have just begun to form stars and which have large gas fractions to those which are old, massive, and have little remaining cold gas.
References
- Adelberger & Steidel (2000) Adelberger, K. L. & Steidel, C. C. 2000, ApJ, 544, 218
- Adelberger et al. (2004) Adelberger, K. L., Steidel, C. C., Shapley, A. E., Hunt, M. P., Erb, D. K., Reddy, N. A., & Pettini, M. 2004, ApJ, 607, 226
- Adelberger et al. (2003) Adelberger, K. L., Steidel, C. C., Shapley, A. E., & Pettini, M. 2003, ApJ, 584, 45
- Alexander et al. (2005) Alexander, D. M., Bauer, F. E., Chapman, S. C., Smail, I., Blain, A. W., Brandt, W. N., & Ivison, R. J. 2005, submitted to ApJ
- Alexander et al. (2003) Alexander, D. M., et al. 2003, AJ, 126, 539
- Almaini et al. (1999) Almaini, O., Lawrence, A., & Boyle, B. J. 1999, MNRAS, 305, L59
- Alonso-Herrero et al. (2004) Alonso-Herrero, A., Takagi, T., Baker, A. J., Rieke, G. H., Rieke, M. J., Imanishi, M., & Scoville, N. Z. 2004, ApJ, 612, 222
- Armus et al. (2004) Armus, L., et al. 2004, ApJS, 154, 178
- Baker et al. (2001) Baker, A. J., Lutz, D., Genzel, R., Tacconi, L. J., & Lehnert, M. D. 2001, A&A, 372, L37
- Barger et al. (1998) Barger, A. J., Cowie, L. L., Sanders, D. B., Fulton, E., Taniguchi, Y., Sato, Y., Kawara, K., & Okuda, H. 1998, Nature, 394, 248
- Bell (2002) Bell, E. F. 2002, ApJ, 577, 150
- Bell (2003) —. 2003, ApJ, 586, 794
- Bell et al. (2005) Bell, E. F., et al. 2005, ApJ, 625, 23
- Benítez (2000) Benítez, N. 2000, ApJ, 536, 571
- Bolzonella et al. (2000) Bolzonella, M., Miralles, J.-M., & Pelló, R. 2000, A&A, 363, 476
- Boselli et al. (1998) Boselli, A., et al. 1998, A&A, 335, 53
- Brandt et al. (2001) Brandt, W. N., Hornschemeier, A. E., Schneider, D. P., Alexander, D. M., Bauer, F. E., Garmire, G. P., & Vignali, C. 2001, ApJ, 558, L5
- Bruzual & Charlot (2003) Bruzual, G. & Charlot, S. 2003, MNRAS, 344, 1000
- Burgarella et al. (2005) Burgarella, D., Perez-Gonzalez, P., Buat, V., Takeuchi, T. T., Lauger, S., Rieke, G., & Ilbert, O. 2005, ArXiv Astrophysics e-prints
- Calzetti et al. (2000) Calzetti, D., Armus, L., Bohlin, R. C., Kinney, . A. L., Koornneef, J., & Storchi-Bergmann, T. 2000, ApJ, 533, 682
- Calzetti & Heckman (1999) Calzetti, D. & Heckman, T. M. 1999, ApJ, 519, 27
- Chapman et al. (2005) Chapman, S. C., Blain, A. W., Smail, I., & Ivison, R. J. 2005, ApJ, 622, 772
- Charmandaris et al. (1997) Charmandaris, V., Mirabel, I. F., Tran, D., Laurent, O., Cesarsky, C. J., Gallais, P., Sauvage, M., & Vigroux, L. 1997, in Extragalactic Astronomy in the Infrared, 283–+
- Cimatti et al. (2002a) Cimatti, A., et al. 2002a, A&A, 392, 395
- Cimatti et al. (2002b) Cimatti, A., et al. 2002b, A&A, 391, L1
- Condon et al. (1991) Condon, J. J., Anderson, M. L., & Helou, G. 1991, ApJ, 376, 95
- Cowie et al. (1996) Cowie, L. L., Songaila, A., Hu, E. M., & Cohen, J. G. 1996, AJ, 112, 839
- Daddi et al. (2004) Daddi, E., Cimatti, A., Renzini, A., Fontana, A., Mignoli, M., Pozzetti, L., Tozzi, P., & Zamorani, G. 2004, ApJ, 617, 746
- Daddi et al. (2005) Daddi, E., et al. 2005, astro-ph/0507504
- Dale et al. (2001) Dale, D. A., Helou, G., Contursi, A., Silbermann, N. A., & Kolhatkar, S. 2001, ApJ, 549, 215
- Dale et al. (2000) Dale, D. A., et al. 2000, AJ, 120, 583
- Desert et al. (1990) Desert, F.-X., Boulanger, F., & Puget, J. L. 1990, A&A, 237, 215
- Di Matteo et al. (2003) Di Matteo, T., Croft, R. A. C., Springel, V., & Hernquist, L. 2003, ApJ, 593, 56
- Dickinson et al. (2003) Dickinson, M., Papovich, C., Ferguson, H. C., & Budavári, T. 2003, ApJ, 587, 25
- Elbaz et al. (2002) Elbaz, D., Cesarsky, C. J., Chanial, P., Aussel, H., Franceschini, A., Fadda, D., & Chary, R. R. 2002, A&A, 384, 848
- Engelbracht et al. (2005) Engelbracht, C. W., Gordon, K. D., Rieke, G. H., Werner, M. W., Dale, D. A., & Latter, W. B. 2005, ApJ, 628, L29
- Erb et al. (2006a) Erb, D. K., Shapley, A. E., Pettini, M., Steidel, C. C., Reddy, N. A., & Adelberger, K. L. 2006a, astro-ph/0602473
- Erb et al. (2006b) —. 2006b, submitted to ApJ
- Erb et al. (2006c) —. 2006c, submitted to ApJ
- Förster Schreiber et al. (2004a) Förster Schreiber, N. M., Roussel, H., Sauvage, M., & Charmandaris, V. 2004a, A&A, 419, 501
- Förster Schreiber et al. (2003) Förster Schreiber, N. M., Sauvage, M., Charmandaris, V., Laurent, O., Gallais, P., Mirabel, I. F., & Vigroux, L. 2003, A&A, 399, 833
- Förster Schreiber et al. (2004b) Förster Schreiber, et al. 2004b, ApJ, 616, 40
- Fabian & Iwasawa (1999) Fabian, A. C. & Iwasawa, K. 1999, MNRAS, 303, L34
- Fadda et al. (2002) Fadda, D., Flores, H., Hasinger, G., Franceschini, A., Altieri, B., Cesarsky, C. J., Elbaz, D., & Ferrando, P. 2002, A&A, 383, 838
- Fadda (2006) Fadda, D., et. al. 2006, submitted to AJ
- Fan et al. (2001) Fan, X., et al. 2001, AJ, 121, 54
- Flores et al. (1999) Flores, H., et al. 1999, ApJ, 517, 148
- Franx et al. (2003) Franx, M., et al. 2003, ApJ, 587, L79
- Genzel & Cesarsky (2000) Genzel, R. & Cesarsky, C. J. 2000, ARA&A, 38, 761
- Giavalisco et al. (2004) Giavalisco, M., et al. 2004, ApJ, 600, L93
- Giavalisco et al. (1996) Giavalisco, M., Koratkar, A., & Calzetti, D. 1996, ApJ, 466, 831
- Goldader et al. (2002) Goldader, J. D., Meurer, G., Heckman, T. M., Seibert, M., Sanders, D. B., Calzetti, D., & Steidel, C. C. 2002, ApJ, 568, 651
- Haas et al. (2001) Haas, M., Klaas, U., Müller, S. A. H., Chini, R., & Coulson, I. 2001, A&A, 367, L9
- Hansen & Peng Oh (2005) Hansen, M. & Peng Oh, S. 2005, astro-ph/0507586
- Helou et al. (1988) Helou, G., Khan, I. R., Malek, L., & Boehmer, L. 1988, ApJS, 68, 151
- Helou et al. (2000) Helou, G., Lu, N. Y., Werner, M. W., Malhotra, S., & Silbermann, N. 2000, ApJ, 532, L21
- Helou et al. (2001) Helou, G., Malhotra, S., Hollenbach, D. J., Dale, D. A., & Contursi, A. 2001, ApJ, 548, L73
- Hogg et al. (2005) Hogg, D. W., Tremonti, C. A., Blanton, M. R., Finkbeiner, D. P., Padmanabhan, N., Quintero, A. D., Schlegel, D. J., & Wherry, N. 2005, ApJ, 624, 162
- Houck et al. (2005) Houck, J. R., et al. 2005, ApJ, 622, L105
- Hughes et al. (1998) Hughes, D. H., et al. 1998, Nature, 394, 241
- Kennicutt (1998a) Kennicutt, R. C. 1998a, ARA&A, 36, 189
- Kennicutt (1998b) —. 1998b, ApJ, 498, 541
- Kong et al. (2004) Kong, X., Charlot, S., Brinchmann, J., & Fall, S. M. 2004, MNRAS, 349, 769
- Laird et al. (2005) Laird, E., Nandra, K., Adelberger, K. L., Steidel, C. C., & Reddy, N. A. 2005, astro-ph/0501411
- Lehmer et al. (2005) Lehmer, B. D., et al. 2005, AJ, 129, 1
- Lilly et al. (1996) Lilly, S. J., Le Fevre, O., Hammer, F., & Crampton, D. 1996, ApJ, 460, L1+
- Madau et al. (1996) Madau, P., Ferguson, H. C., Dickinson, M. E., Giavalisco, M., Steidel, C. C., & Fruchter, A. 1996, MNRAS, 283, 1388
- Makovoz & Marleau (2005) Makovoz, D. & Marleau, F. R. 2005, astro-ph/0507007
- Meurer et al. (1999) Meurer, G. R., Heckman, T. M., & Calzetti, D. 1999, ApJ, 521, 64
- Nandra et al. (2002) Nandra, K., Mushotzky, R. F., Arnaud, K., Steidel, C. C., Adelberger, K. L., Gardner, J. P., Teplitz, H. I., & Windhorst, R. A. 2002, ApJ, 576, 625
- Normand et al. (1995) Normand, P., Rouan, D., Lacombe, F., & Tiphene, D. 1995, A&A, 297, 311
- Papovich et al. (2001) Papovich, C., Dickinson, M., & Ferguson, H. C. 2001, ApJ, 559, 620
- Papovich et al. (2005) Papovich, C., et al. 2005, astro-ph/0511289
- Persic et al. (2004) Persic, M., Rephaeli, Y., Braito, V., Cappi, M., Della Ceca, R., Franceschini, A., & Gruber, D. E. 2004, A&A, 419, 849
- Pozzi et al. (2004) Pozzi, F., et al. 2004, ApJ, 609, 122
- Puget & Leger (1989) Puget, J. L. & Leger, A. 1989, ARA&A, 27, 161
- Ranalli et al. (2003) Ranalli, P., Comastri, A., & Setti, G. 2003, A&A, 399, 39
- Reddy et al. (2006) Reddy, N. A., Adelberger, K. L., Steidel, C. C., Shapley, A., Pettini, M., & Erb, D. K. 2006, in preparation
- Reddy et al. (2005) Reddy, N. A., Erb, D. K., Steidel, C. C., Shapley, A., Adelberger, K. L., & Pettini, M. 2005, ApJ, 633, 748
- Reddy & Steidel (2004) Reddy, N. A. & Steidel, C. C. 2004, ApJ, 603, L13
- Rix et al. (2004) Rix, S. A., Pettini, M., Leitherer, C., Bresolin, F., Kudritzki, R.-P., & Steidel, C. C. 2004, ApJ, 615, 98
- Roussel et al. (2001) Roussel, H., Sauvage, M., Vigroux, L., & Bosma, A. 2001, A&A, 372, 427
- Rowan-Robinson et al. (2004) Rowan-Robinson, M., et al. 2004, MNRAS, 351, 1290
- Rudnick et al. (2003) Rudnick, G., et al. 2003, ApJ, 599, 847
- Sanders & Mirabel (1996) Sanders, D. B. & Mirabel, I. F. 1996, ARA&A, 34, 749
- Shapley et al. (2005) Shapley, A. E., Steidel, C. C., Erb, D. K., Reddy, N. A., Adelberger, K. L., Pettini, M., Barmby, P., & Huang, J. 2005, ApJ, 626, 698
- Shaver et al. (1996) Shaver, P. A., Wall, J. V., Kellermann, K. I., Jackson, C. A., & Hawkins, M. R. S. 1996, Nature, 384, 439
- Smail et al. (1997) Smail, I., Ivison, R. J., & Blain, A. W. 1997, ApJ, 490, L5+
- Smail et al. (2002) Smail, I., Ivison, R. J., Blain, A. W., & Kneib, J.-P. 2002, MNRAS, 331, 495
- Soifer et al. (1987) Soifer, B. T., Sanders, D. B., Madore, B. F., Neugebauer, G., Danielson, G. E., Elias, J. H., Lonsdale, C. J., & Rice, W. L. 1987, ApJ, 320, 238
- Steidel et al. (1999) Steidel, C. C., Adelberger, K. L., Giavalisco, M., Dickinson, M., & Pettini, M. 1999, ApJ, 519, 1
- Steidel et al. (2003) Steidel, C. C., Adelberger, K. L., Shapley, A. E., Pettini, M., Dickinson, M., & Giavalisco, M. 2003, ApJ, 592, 728
- Steidel et al. (2004) Steidel, C. C., Shapley, A. E., Pettini, M., Adelberger, K. L., Erb, D. K., Reddy, N. A., & Hunt, M. P. 2004, ApJ, 604, 534
- Sturm et al. (2000) Sturm, E., Lutz, D., Tran, D., Feuchtgruber, H., Genzel, R., Kunze, D., Moorwood, A. F. M., & Thornley, M. D. 2000, A&A, 358, 481
- Tielens et al. (1999) Tielens, A. G. G. M., Hony, S., van Kerckhoven, C., & Peeters, E. 1999, in ESA SP-427: The Universe as Seen by ISO, 579–+
- van Dokkum et al. (2004) van Dokkum, P. G., et al. 2004, ApJ, 611, 703
- Yan et al. (2005) Yan, L., et al. 2005, ApJ, 628, 604
- Yun et al. (2001) Yun, M. S., Reddy, N. A., & Condon, J. J. 2001, ApJ, 554, 803