The relation between accretion rate and jet power in X-ray luminous elliptical galaxies
Abstract
Using Chandra X-ray observations of nine nearby, X-ray luminous elliptical galaxies with good optical velocity dispersion measurements, we show that a tight correlation exists between the Bondi accretion rates calculated from the observed gas temperature and density profiles and estimated black hole masses, and the power emerging from these systems in relativistic jets. The jet powers, which are inferred from the energies and timescales required to inflate cavities observed in the surrounding X-ray emitting gas, can be related to the accretion rates using a power law model of the form log (log (, with and . Our results show that a significant fraction of the energy associated with the rest mass of material entering the Bondi accretion radius ( per cent, for ) eventually emerges in the relativistic jets. The data also hint that this fraction may rise slightly with increasing jet power. Our results have significant implications for studies of accretion, jet formation and galaxy formation. The observed tight correlation suggests that the Bondi formulae provide a reasonable description of the accretion process in these systems, despite the likely presence of magnetic pressure and angular momentum in the accreting gas. The similarity of the and values argues that a significant fraction of the matter entering the accretion radius flows down to regions close to the black holes, where the jets are presumably formed. The tight correlation between and also suggests that the accretion flows are approximately stable over timescales of a few million years. Our results show that the black hole ‘engines’ at the hearts of large elliptical galaxies and groups can feed back sufficient energy to stem cooling and star formation, leading naturally to the observed exponential cut off at the bright end of the galaxy luminosity function.
keywords:
accretion, accretion disks – black hole physics – galaxies:active – galaxies:jets – X-rays: galaxies1 Introduction
The black holes in the hearts of galaxies and galaxy clusters are commonly observed to be associated with powerful relativistic jets. The mechanism by which such jets form and the efficiency with which the energy associated with material entering the accretion radius is converted into jet power at much smaller radii remains the subject of much debate. Such knowledge is important for understanding the nature of the accretion process, galaxy formation and the growth of supermassive black holes.
X-ray studies with Chandra and XMM-Newton, building on earlier work with ROSAT, have shown that the black holes at the centres of galaxies, groups and clusters interact strongly with their environments, blowing clear cavities or ‘bubbles’ in the surrounding X-ray emitting gas (e.g. Böhringer et al. 1993; Fabian et al. 2000, 2003, 2005; Birzan et al. 2004; Forman et al. 2005). Simple arguments based on the energy required to inflate the bubbles and the sound speed of the surrounding gas allow these bubbles to be used as calorimeters, measuring the power released by the jets (e.g. Churazov et al. 2002). Importantly, the exquisite spatial resolution of Chandra means that for the largest, nearby ellipticals we are also able to resolve regions close to the Bondi accretion radii in these systems. Given estimates for the central black hole masses from measured galaxy velocity dispersions, the observed density and temperature profiles of the X-ray emitting gas can be used to estimate the accretion rates onto the black holes (Bondi 1952). Taken together, the accretion rates and jet powers then allow us to estimate the efficiency with which the rest mass of accreted matter is converted into jet power.
The observed luminosities of AGN in elliptical galaxies are typically several orders of magnitude lower than would be predicted from the standard Bondi formulae, assuming a conversion efficiency for matter into radiation of order 10 per cent. However, much of the predicted power may actually be released in the form of jets. This issue was investigated by Di Matteo et al. (2003) and Taylor et al. (2006) who noted that although the central AGN in NGC4486 (M87), NGC4696 and NGC6166 have bolometric luminosities three orders of magnitude below the Bondi predictions (for 10 per cent efficiency), the jet powers inferred from the observed X-ray cavities are comparable to the Bondi values, within a factor of a few. Pellegrini et al. (2003) used related arguments to infer a minimum conversion efficiency for accreted mass into jet power of per cent for the elliptical galaxy IC4296. Here, we extend the work of Di Matteo et al. 2003 and Taylor et al. (2006) to a sample of nine nearby, X-ray bright ellipticals with good X-ray data and optical velocity dispersion measurements.
The origin of the observed galaxy luminosity function and, in particular, the mechanism responsible for truncating star formation in the largest ellipticals is also a subject of much debate (e.g. Benson et al. 2003, Croton et al. 2005; Bower et al. 2005, and references therein). Here, again, significant insight has been provided by XMM-Newton and Chandra observations (e.g. Tamura et al. 2001; Allen et al. 2001; Peterson et al. 2001, 2003) which show that the cooling rates in the cores of galaxies, groups and clusters are much smaller than the values predicted by simple models that do not include feedback. Some widespread form of heating must be operating in galaxies and clusters to stem cooling. We show here that the kinetic power released in jets from the central black hole engines can, in principle, provide this heat and stem further star formation.
2 observations and data analysis
2.1 Target selection
Our target galaxies are bright, nearby ellipticals with accurate central black hole mass measurements or velocity dispersions which allow the black hole masses to be estimated e.g. using the relation of Tremaine et al. (2002). The Chandra archive was searched to identify all such systems with X-ray luminous gaseous halos and obvious jet-induced cavities in the X-ray emitting gas. We have restricted our target list to those systems in which the bubbles are attached (or very close to) to the central AGN, which are therefore likely to be undergoing inflation. We have also required that the Chandra exposure times be sufficient to allow precise measurements of the central density and temperature of the X-ray emitting gas. Finally, we required that the X-ray data allow us to measure the properties of the X-ray emitting gas within one order of magnitude of the Bondi radius, permitting reliable measurements or extrapolations of the gas properties at that radius to be made. These selection criteria are matched by eight galaxies with data in the Chandra archive. For comparison purposes, we also include results for one more distant system, NGC6166, the dominant galaxy of Abell 2199. Although, due to its greater distance, we do not come close to resolving the Bondi radius in this system, the density profile follows a simple power-law form which allows an interesting extrapolation to smaller radii.
2.2 Chandra analysis
| (Mpc) | Date | Exposure (ks) | |
|---|---|---|---|
| NGC507 | 71.4 | 2000 Oct 11 | 19.1 |
| NGC4374 (M84) | 17 | 2000 May 19 | 28.1 |
| NGC4472 | 17 | 2001 Jun 12 | 21.9 |
| NGC4486 (M87) | 17 | 2000 Jul 29 | 33.7 |
| NGC4552 (M89) | 17 | 2001 Apr 22 | 53.4 |
| NGC4636 | 17 | 2000 Jan 26 | 43.2 |
| NGC4696 | 44.9 | 2004 Apr 01 | 86.7 |
| NGC5846 | 24.6 | 2000 May 24 | 19.5 |
| NGC6166 | 135.5 | 1999 Dec 11 | 15.0 |
| log | log | () | () | log | log | ||
|---|---|---|---|---|---|---|---|
| NGC507 | |||||||
| NGC4374 (M84) | |||||||
| NGC4472 | |||||||
| NGC4486 (M87) | |||||||
| NGC4552 (M89) | |||||||
| NGC4636 | |||||||
| NGC4696 | |||||||
| NGC5846 | |||||||
| NGC6166 |
The Chandra observations were carried out using the Advanced CCD Imaging Spectrometer (ACIS) between 1999 December and 2004 April. The ACIS-S array was used as the primary detector as it offers the best sensitivity to soft X-ray emission from the galaxies. The standard level-1 event lists produced by the Chandra pipeline processing were reprocessed using the (version 3.2.1) software package, including the latest gain maps and calibration products. Bad pixels were removed and standard grade selections applied. Where possible, extra information available in VFAINT mode was used to improve the rejection of cosmic ray events. The data were cleaned to remove periods of anomalously high background using the recommended energy ranges and time binning. The net exposure times after cleaning are summarized in Table 1. The analyses of NGC4486 (M87) and NGC6166 have been reported separately by Di Matteo et al. (2001, 2003). For these objects, we have used their density and temperature profiles, scaled to the distances summarized in Table 1.
The temperature and density profiles of the X-ray emitting gas were determined using the methods described by Allen et al. (2004 and references therein). In brief, concentric annular spectra were extracted from the cleaned event lists, centred on the AGN (identified from radio data and/or the presence of an obvious X-ray point source in the Chandra data). These spectra were analysed using XSPEC (version 11.3: Arnaud 1996), the MEKAL plasma emission code (Kaastra & Mewe 1993; incorporating the Fe-L calculations of Liedhal, Osterheld & Goldstein 1995) and the photoelectric absorption models of Balucinska-Church & McCammon (1992). We have included standard correction factors to account for time-dependent contamination along the instrument light path and have incorporated a small correction to the High Resolution Mirror Assembly model in CIAO 3.2.1, which takes the form of an ’inverse’ edge with an energy, E=2.08 keV and optical depth (Herman Marshall, private communication). Only data in the keV energy range were used for our analysis. The spectra for all annuli for a particular galaxy were modelled simultaneously in order to determine the deprojected X-ray gas temperature profiles, under the assumption of spherical symmetry. 111Note that for NGC4696, we have only analysed data from a 35 degree wide slice, covering position angles 15-50 degrees. This excludes the complex structure to the west of the central source discussed by Taylor et al. (2006). For all other sources, the full 360 degrees of position angle were used. Note that for NGC4486, the bright non-thermal emission from the jets was also excluded (Di Matteo et al. 2003). The emission from each spherical shell was modelled as a single phase plasma, with the abundances of all metals in each shell assumed to vary with a common ratio, , with respect to Solar values. (The exception to the latter assumption was the analysis of NGC4486, reported separately by Di Matteo et al. (2003), for which the abundances of key elements were permitted to vary independently in each shell.)
Background spectra were extracted from the blank-field data sets available from the Chandra X-ray Center. These were cleaned in an identical manner to the target observations. In each case, the normalizations of the background files were scaled to match the count rates in the target observations measured in the 9.5-12keV band. Separate photon-weighted response matrices and effective area files were constructed for each region using calibration files appropriate for the period of observation.
Azimuthally-averaged surface brightness profiles were constructed from background subtracted, flat-fielded images with a arcsec2 pixel scale ( raw detector pixels). Together with the deprojected spectral temperature profiles, these were used to determine the X-ray gas density profiles (see e.g. White, Jones & Forman 1997 for details of the technique).
3 Calculation of accretion rates and jet powers
3.1 Black hole masses and accretion radii
For the case of M87, the measurement of the central black hole mass, , is from Tremaine et al. (2002) and is based on the data of Harms et al. (1994) and Macchetto et al. (1997). For the other galaxies in the sample, the black hole masses have been estimated using the correlation between and velocity dispersion, , given by Tremaine et al. (2002)
| (1) |
with and . Our analysis uses a Monte Carlo algorithm to account for the uncertainties in and the slope of the log log relation. Velocity dispersions for the galaxies are drawn from the work of Bernardi et al. (2002) and are summarized in Table 2.
The accretion radius, , is the radius within which the gravitational potential of the central black hole dominates over the thermal energy of the surrounding X-ray emitting gas
| (2) |
Here is the gravitational constant, is the adiabatic sound speed of the gas at the accretion radius, is the gas temperature at that radius, is the mean atomic weight, is the proton mass and is the adiabatic index of the X-ray emitting gas. The results on the accretion radii, summarized in Table 2, account for the uncertainties in the central black hole masses (described above) and gas temperatures.
Tremaine et al. (2002) measure an intrinsic (systematic) dispersion of 0.23 dex in the log log relation, which implies a similar systematic uncertainty in the log values. This systematic uncertainty in dominates over the tabulated measurement errors in most cases. The effects of accounting for this systematic dispersion are discussed in Section 4.
| Galaxy | Lobe | ||||
|---|---|---|---|---|---|
| (kpc) | () | () | () | ||
| NGC507 | E | ||||
| W | |||||
| NGC4374 | N | ||||
| S | |||||
| NGC4472 | E | ||||
| W | |||||
| M87 | W | ||||
| E | |||||
| NGC4552 | N | ||||
| S | |||||
| NGC4636 | NE | ||||
| SW | |||||
| NGC4696 | E | ||||
| W | |||||
| NGC5846 | N | ||||
| S | |||||
| NGC6166 | E | ||||
| W |
3.2 X-ray gas properties at the accretion radii
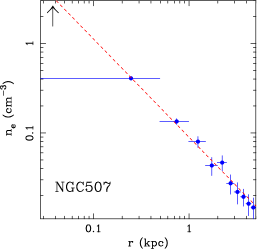
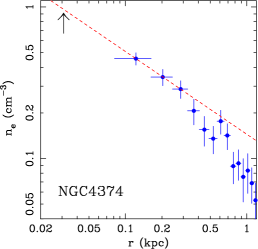
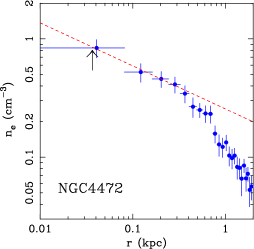
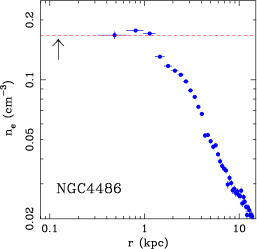
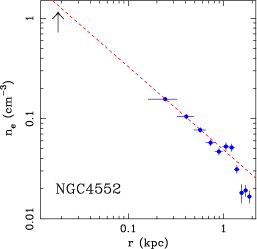
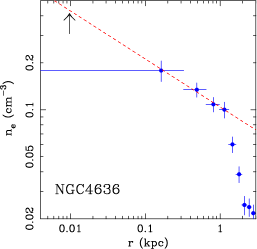
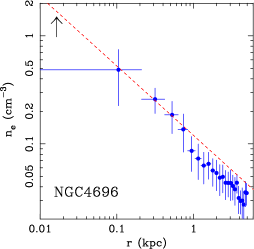
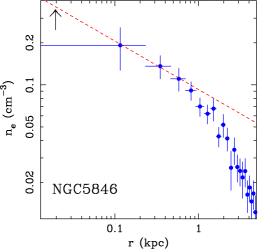
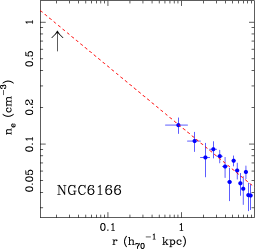
Fig 1 shows the electron density profiles for the central regions of the galaxies, determined from the Chandra X-ray data. In cases where the X-ray emission from the innermost parts is contaminated by non-thermal emission from a central AGN (NGC4374, 4486, 4552, 6166), the affected regions have been excluded. The arrows in the figures mark the locations of the accretion radii. With the exception of NGC 4472, the accretion radii are unresolved by the Chandra data. However, in general, the inner few points of the density profiles can be described by a power-law model of the form with (Table 2). We have used the power-law models to estimate the gas densities at the accretion radii, in each case accounting for uncertainties in the slopes and normalizations. For M87 (NGC4486), the density profile flattens within and so we have assumed that the density at is equal to the value at the innermost measurement radius. (We assign a systematic uncertainty in the slope in this case.) Note that the regions fitted with the power law density models are the regions for which we expect the assumption of spherical symmetry to be most valid, based on the Chandra images.
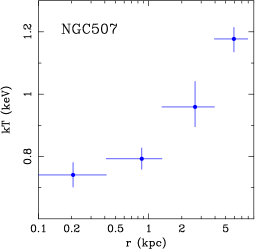
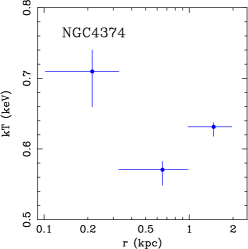
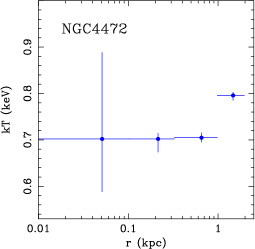
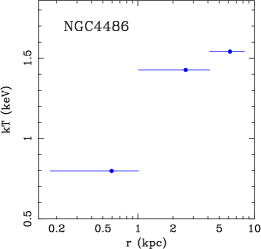
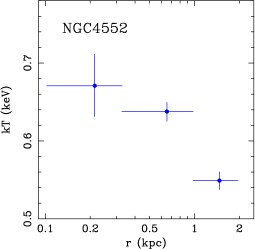
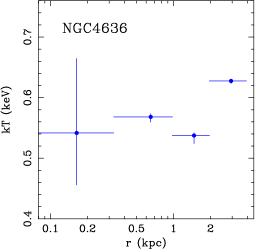
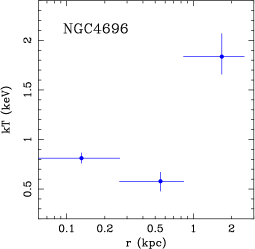
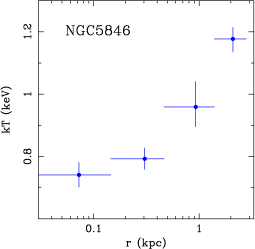
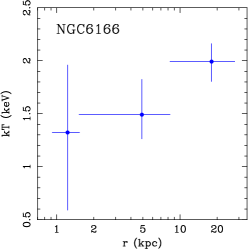
The temperature profiles for the inner regions of the galaxies are shown in Fig. 2. In general, the profiles do not exhibit steep gradients within . We have therefore assumed that the temperatures at the accretion radii can be estimated from the values at the innermost measurement radii. The temperature results are summarized in Table 2. Systematic uncertainties in the temperature estimates are unlikely to affect other results reported here significantly.
3.3 Calculation of the accretion rates
The calculation of accretion rates onto the central black holes follows the work of Bondi (1952). Similar calculations are described by e.g. Di Matteo et al. (2001, 2003), Churazov et al. (2002), Pellegrini et al. (2003) and Taylor et al. (2006).
Under the assumption of spherical symmetry and negligible angular momentum, the rate of accretion of the X-ray emitting gas at the accretion radius can be written as (Bondi 1952)
| (3) |
where is the density of the gas at the accretion radius (we assume ) and is a numerical coefficient that depends upon the adiabatic index of the accreting gas. For an assumed adiabatic index , (Bondi 1952). Note that for , is constant within the accretion flow, making it appropriate to use the gas temperature and density measured at the accretion radius in our calculations, in place of the values at infinity. (In essence, we are modelling the accretion flows as Bondi flows inward of the accretion radii. For , the gravitational potentials of the galaxies start to dominate and the Bondi formulae become inappropriate.)
For an efficiency , relating the accretion rate at the accretion radius to the total energy emitted from within that radius, the maximum power released from the black hole system is
| (4) |
The values of , for an assumed value of are summarized in Table 2. The statistical uncertainties in the results have been estimated from Monte Carlo simulations, which account for the uncertainties in the measurements, the slope of the log log relation and uncertainties in the temperature and density measurements at the accretion radii.
An intrinsic (systematic) dispersion of 0.23 dex in the log log relation (Tremaine et al. 2002) implies a systematic uncertainty of 0.46 dex in both log and log . These systematic errors are comparable to the measurement errors for most galaxies, and dominate for NGC507.
3.4 Calculation of jet power
To estimate the kinetic power of the jets, we first estimated the energy, required to create the observed bubbles in the X-ray emitting gas. For slow expansion rates, this is the sum of the internal energy within the bubble and the work done
| (5) |
where is the thermal pressure of the surrounding, X-ray emitting gas (which can be determined from the observed X-ray temperatures and densities), V is the volume of the cavity and is the mean adiabatic index of the fluid within the cavity. For the case of a bubble filled with relativistic plasma, and . Some additional energy will also be transfered into sound waves (Churazov et al. 2002; Fabian et al. 2003, 2005, 2006; Forman et al. 2003; Ruszkowski et al. 2004). We have neglected this extra energy in our calculations, although the power involved is likely to be smaller than the quoted uncertainties on the jet powers.
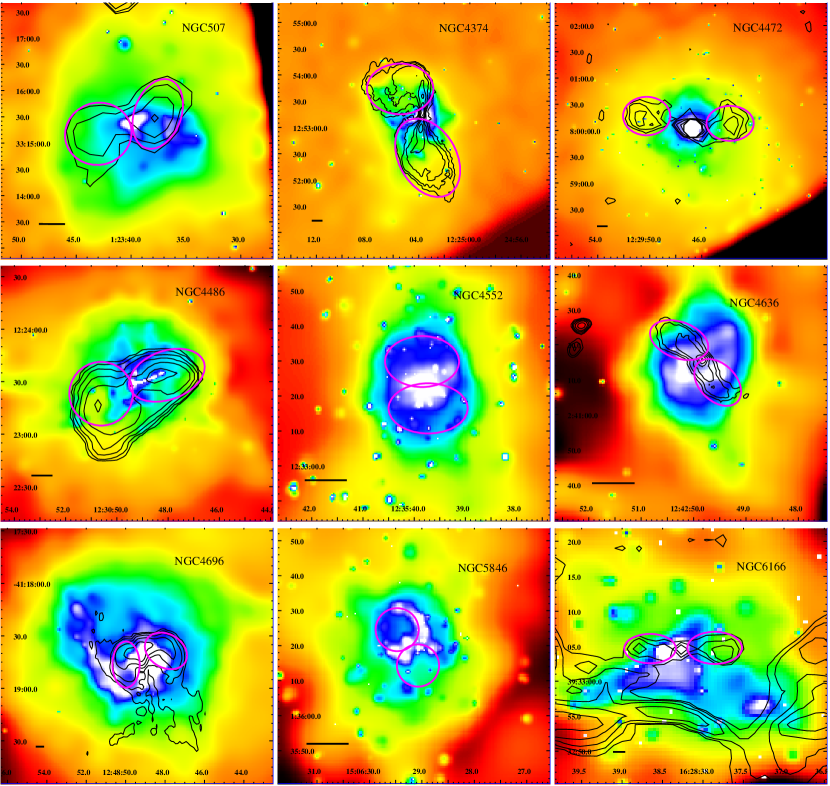
The regions identified with the bubbles are shown in Fig. 3. In general, the bubbles appear to be ‘attached’ to the central AGN and are likely to be undergoing expansion at present. A possible exception to this is NGC4472, where the bubbles may have recently detached. In cases where the edges of the bubbles are not clearly defined in the X-ray data, we have used radio observations to estimate their volumes (Fig. 3). The X-ray and radio data show that in general, the bubbles or cavities are approximately elliptical. We have therefore parameterized the projected areas of the bubbles in terms of a semi-axis length, , along the jet direction and semi-axis width, , across it. This allows the cavities to be modelled as ellipsoids with volumes , where is the unknown depth of the cavity along the line of sight. We model the cavities as prolate ellipsoids with , although systematic uncertainties in , and, especially, mean that our estimates of the bubble volumes should be regarded as uncertain at the factor level.
Following Birzan et al. (2004; see also Dunn & Fabian 2004, Dunn, Fabian & Taylor 2005) we have estimated the ages of the bubbles as
| (6) |
where R is the distance of the bubble centre from the black hole, which provides a reasonable match to some numerical simulations. We note that the bubbles have lower mass density than the surrounding X-ray emitting gas and can therefore be expected to rise with a buoyancy velocity, . Here is the cross-sectional area of the bubble (in the rise direction), is the volume, is the drag coefficient and is the gravitational acceleration. The times required for bubbles of the observed sizes to rise buoyantly through a uniform medium from the galaxy centres to their current radii is approximately . Application of this formula leads to comparable timescales to the values. However, since the bubbles studied here are typically still attached to the jets, we adopt as our relevant timescale.
The power involved in ‘blowing’ the bubbles can be estimated as
| (7) |
The results on are summarized in Table 3. The uncertainties on are determined from Monte Carlo simulations which include the sources of statistical uncertainty mentioned above as well as a factor 2 systematic uncertainty in the bubble volumes.

4 The relation between accretion rate and jet power
Fig 4 shows the results on the accretion power , for an assumed efficiency for the conversion of accreted rest mass into energy, versus the jet power, , determined from the bubble properties. Both powers are in units of . For each galaxy, we have combined the power estimates for both bubbles, with the uncertainties added in quadrature. A clear correlation between the and exists, which can be described by a power law model of the form
| (8) |
Using the fit statistic, which accounts only for errors in the values, we find and , with for 7 degrees of freedom (the quoted uncertainties on and are 68 per cent confidence intervals). Using the BCES() estimator of Akritas & Bershady (1996), which accounts for errors in both axes and the presence of possible intrinsic scatter, we obtain and . The mean deviation about the best fitting BCES model is .
The results on and quoted above do not account for the effects of intrinsic (systematic) scatter in the log log relation. We have used further Monte Carlo simulations to examine these effects, introducing an intrinsic dispersion of 0.46 dex in log . Fits to the simulated data sets using the BCES() estimator give and , in good agreement with the results presented above but with (slightly) larger error bars on the fit parameters.
The results shown in Fig 4 indicate the presence of a strong correlation between and . A power-law model provides a good description of the data. However, in gauging the origin and significance of this correlation, we must also consider effects that could arise from the plotted quantities having factors in common. Both and depend on the distances to the objects. However, , whereas . Thus, the distance dependences cannot lead to the observed positive correlation. Both axes in Fig 4 also depend on the temperature of the X-ray emitting gas. However, the temperature shows little variation from object to object and varies only mildly with radius between the accretion and bubble radii. Moreover, the dependences on temperature are approximately and , which cannot lead to the observed positive correlation. Finally, both axes involve the gas density, measured at the accretion radius for and at the bubble centres for . These radii are very different and the density profiles vary significantly from object to object, meaning that the densities are essentially uncorrelated. (In detail, a mild anti-correlation is observed).
We conclude that the observed correlation between and indicates a tight physical connection between the two quantities.
5 Implications and discussion
We have shown that for supermassive black holes at the centres of large, X-ray luminous elliptical galaxies, a remarkable, tight correlation exists between the ‘Bondi’ accretion rates inferred from the Chandra X-ray data and observed galaxy velocity dispersions, and the power emerging from these systems in relativistic jets. Our result has important implications for the nature of the accretion process and for issues relating to feedback, the growth of black holes and galaxy formation.
The relationship between the Bondi accretion power and jet power can be described by a power law model of the form log log, where and is the power associated with inflating the cavities and providing the internal energy of the plasma that fills them. A significant fraction ( per cent, for ) of the energy associated with the rest mass of material entering the Bondi accretion radius emerges from the systems in relativistic jets. There is a slight indication that this fraction increases as rises, from per cent at , to per cent at . (Here, the quoted uncertainties include all sources of statistical and systematic error discussed in the text, including systematic scatter in the log log relation.)
The existence of such a tight correlation suggests that the Bondi formalism provides a reasonable description of the accretion process in these systems, despite the fact that the accreting gas contains magnetic fields (e.g. Taylor et al. 2006) and, presumably, has some angular momentum. Moreover, the similarity of the and values suggests that a significant fraction of the matter passing through the accretion radius flows all the way down to regions close to the black hole, where it presumably provides the power source for the jets. This provides an important constraint on both accretion and jet formation models. In particular, our results limit the amount of material that may be lost from the accretion flows en route to the region of jet formation and requires that jet formation must be efficient; a few per cent of the energy associated with the rest mass of material entering the accretion radius emerges in the jets.
The origin of the jets may be related to the spin of the central black hole (e.g. Rees 1978; Hughes & Blandford 2003). In that case, the observed tight correlation between jet power and accretion rate may suggest a narrow range of black hole spins for the objects in our sample. The X-ray emitting gaseous halos in the giant elliptical galaxies studied here are likely to have existed for billions of years. The growth of the black holes may therefore have been dominated by gas accretion, which tends to lead to large spin parameters (e.g. Volonteri et al. 2005) and it is possible that the black holes are rotating at close to their maximal rates. However, the detailed interaction between accretion, spin-up and jet power remains to be explored.
The tight correlation between and also suggests that the accretion flows in the galaxies are stable over the periods required for gas to flow from the accretion radii to the base of the jets plus the times required for the bubbles to be inflated. The flow times are of the order a few to a few yr, whereas the bubble ages range from yr (Table 3). Thus, our results suggest that the accretion flows in the present sample of objects are approximately stable over timescales of yr.
The black holes studied here are accreting at rates of a few to a few and converting a few per cent of their accreted rest mass into jet energy. The nuclear luminosities (Pellegrini 2005) are typically 2-4 orders of magnitude lower than the values, so the systems are ‘quiescent’ in terms of their nuclear luminosities. (Orientation and obscuration effects will play some role although are unlikely to modify this conclusion e.g. Di Matteo et al. 2001, 2003; Allen, Di Matteo & Fabian 2000.) It is interesting to note that the measured jet powers are comparable to the bolometric luminosities predicted by standard, radiatively efficient accretion disk models with (Shakura & Sunyaev 1973). Thus, it is possible that the ratio of accretion rate/total emitted power (bolometric luminosity plus jet power) may remain relatively stable as the accretion mode varies from a quasar to optically quiescent phase.
Our results have significant implications for models of galaxy formation and support the idea that feedback from central black holes is important in shaping the bright end of the galaxy luminosity function (see e.g. Croton et al. 2005 and Bower et al. 2005 for recent discussions). For our sample, the efficiency with which energy associated with the rest mass of accreted matter is fed back into the surrounding X-ray emitting gas via the jets is similar to that in the semi-analytic models of e.g. Croton et al. (2005). Those models have been shown to be able to explain the exponential cut off at the bright end of the galaxy luminosity function and the fact that the most massive galaxies tend to be bulge dominated systems in clusters, containing systematically older stars.
Our results show that the supermassive black holes in elliptical galaxies are prodigious energy sources, with the bulk of the energy emerging in the form of relativistic jets rather than radiation. In order for this energy to be coupled back into the surrounding matter, the jets must have a working surface which is provided in these cases by the X-ray emitting gas. For the elliptical galaxies studied here, the power fed back into the X-ray emitting gas is, in principle, sufficient to offset cooling and heat the gas, thereby preventing further star formation. (Note that Best et al. 2006 apply simple scaling arguments to a large elliptical galaxy sample to show that the time-averaged power output from radio sources can, in principle, balance radiative cooling.) Since we expect all large galaxies to contain a supermassive black hole, even at high redshifts, this suggests that a key stage in the formation of such galaxies will be when they first become large enough to maintain an X-ray gaseous halo. (This then provides a working surface for the jets, allowing feedback and preventing further galaxy growth. Although the jets could have been providing power before this point, they are unlikely to have had an effective working surface.) Note, however, that although star formation is truncated when jet feedback becomes efficient, the black hole may continue to grow via accretion from the X-ray gas at approximately the Bondi rate.
A closely related topic is that of cooling flows in galaxies and clusters, and the mechanism responsible for preventing gas cooling to low temperatures (keV). As stated above, the values in the galaxies and groups studied here are sufficient to offset further cooling of the X-ray gas. It is interesting to consider extending the correlation between and to larger systems where the cooling of the gas is more rapid. For the largest cooling flow clusters, the cooling luminosity exceeds . If the black hole masses and accretion rates in these galaxies are not significantly larger than in NGC507 and M87, then the jet power is unlikely to be sufficient to balance cooling and some cooling to very low temperatures and associated star formation can be expected to occur (see also Fabian et al. 2002). This is consistent with observations indicating the presence of vigorous star formation and large molecular gas concentrations in the largest cooling flow clusters, but relatively little in less X-ray luminous systems (e.g. McNamara & O’Connell 1992; Allen 1995; Crawford et al. 1999; Edge 2001).
Finally, we note that although systematic uncertainties have been included in the extrapolation of the gas properties to the Bondi radii and in our estimation of black hole masses and bubble volumes, other sources of systematic uncertainty remain. For example, the assumption that in the calculation of may not be precise, and our assumption that the bubble ages can be estimated as is probably uncertain at the factor level. However, we do not expect such uncertainties to affect the main conclusions drawn here.
Acknowledgements
We thank Roger Blandford, Glenn Morris and Bob Wagoner for helpful discussions. We also thank the anonymous referee for helpful comments. This work was supported in part by the U.S. Department of Energy under contract number DE-AC02-76SF00515. RD and ACF thank PPARC and the Royal Society for support, respectively. GBT acknowledges support from the National Aeronautics and Space Administration through Chandra Award Number GO4-5135X issued by the Chandra X-ray Observatory Center, which is operated by the Smithsonian Astrophysical Observatory for and on behalf of the National Aeronautics and Space Administration under contract NAS8-03060. The National Radio Astronomy Observatory is a facility of the National Science Foundation operated under a cooperative agreement by Associated Universities, Inc.
References
- [1] Allen S.W., 1995, MNRAS, 276, 947
- [2] Allen S.W., Di Matteo T., Fabian A.C., 2000, MNRAS, 311, 493
- [3] Allen S.W., Ettori S., Fabian A.C., 2001, MNRAS, 324, 877
- [4] Allen S.W., Schmidt R.W., Ebeling H., Fabian A.C., van Speybroeck L., 2004, MNRAS, 353, 457
- [5] Akritas M.G., Bershady M.A., 1996, ApJ, 470, 706
- [6] Arnaud, K.A., 1996, in Astronomical Data Analysis Software and Systems V, eds. Jacoby G. and Barnes J., ASP Conf. Series volume 101, p17
- [7] Balucinska-Church M., McCammon D., 1992, ApJ, 400, 699
- [8] Benson A.J., Bower R.J., Frenk C.S., Lacey C.G., Baugh C.M., Cole S., 2003, ApJ, 599, 38
- [9] Bernardi M., Alonso M.V., da Costa L.N., Willmer C.N.A., Wegner G., Pellegrini P.S., Rite C., Maia M.A.G., 2002, AJ, 123, 2990
- [10] Best P.N., Kaiser C.R., Heckman T.M., Kauffmann G., 2006, MNRAS, 368L, 67
- [11] Birzan L., Rafferty D.A., McNamara B.R., Wise M.W., Nulsen P.E.J., 2004, ApJ, 607, 800
- [12] Böhringer H., Voges W., Fabian A.C., Edge A.C., Neuman D.M., 1993, MNRAS, 264, 25
- [13] Bondi H., 1952, 112, 195
- [14] Bower R.G., Benson A.J., Malbon R., Helly R., Frenk C.S., Baugh C.M., Cole S., Lacey C.G., 2005, MNRAS, submitted (astro-ph/0511338)
- [15] Churazov E., Brüggen M., Kaiser C.R., Böhringer H., Forman W., 2001, ApJ, 554, 261
- [16] Churazov E., Sunyaev R., Forman W., Böhringer H., 2002, MNRAS, 332, 729
- [17] Crawford C.S., Allen S.W. Ebeling H., Edge A.C., Fabian A.C., 1999, MNRAS, 306, 857
- [18] Croton et al. 2006, MNRAS, 365, 11
- [19] Di Matteo T., Allen S.W., Fabian A.C., Wilson A.S., Young A.J., 2003, ApJ, 582, 133
- [20] Di Matteo T., Johnstone R.M., Allen S.W., Fabian A.C., 2001, ApJ, 550, L19
- [21] Dunn R.J.H., Fabian A.C., 2004, MNRAS, 355, 862
- [22] Dunn R.J.H., Fabian A.C., Taylor G.B., 2005, MNRAS, 364 1343
- [23] Edge A.C., 2001. MNRAS, 328, 762
- [24] Fabian A.C., Reynolds C.S., Taylor G.B., Dunn R.J.H., 2005, MNRAS, 363, 891
- [25] Fabian A.C., Sanders J.S., Taylor G.B., Allen S.W., Crawford C.S., Johnstone R.M., Iwasawa K., 2006, MNRAS, 366, 417
- [26] Fabian A.C., Sanders J.S., Allen S.W., Crawford C.S., Iwasawa K., Johnstone R.M., Schmidt R.W., Taylor G.B., Dunn R.J.H., 2003, MNRAS, 344, L43 Schmidt R.W., Taylor G.B., Dunn R.J.H., 2003, MNRAS, 344, L43
- [27] Fabian A.C., Allen S.W., Crawford C.S., Johnstone R.M., R.J. Morris, J.S. Sanders, Schmidt R.W., 2002, MNRAS, 332, L50
- [28] Fabian A.C., Sanders J.S., Ettori S., Taylor G.B., Allen S.W., Crawford C.S., Iwasawa K., Johnstone R.M., Ogle P.M., 2000, MNRAS,, 318, L65
- [29] Forman W. et al. , 2005, ApJ, 635, 894
- [30] Harms R.J. et al. 1994, ApJ, 435, L35
- [31] Hughes S.A., Blandford R.D., 2003, ApJ, 585, L101
- [32] Kaastra J.S., Mewe R., 1993, Legacy, 3, HEASARC, NASA
- [33] Liedhal D.A., Osterheld A.L., Goldstein W.H., 1995, ApJ, 438, L115
- [34] Macchetto F., Marconi A., Axon D.J., Capetti A., Sparks W., Crane P., 1997, ApJ, 489, 579
- [35] McNamara B., O’Connell R.W, 1992, ApJ, 393, 579
- [36] Pellegrini S., 2005, ApJ, 624, 155
- [37] Pellegrini S., Venturi T., Comastri A., Fabbiano G., Fiore F., Vignali C., Morganti R., Trinchieri G., 2003, ApJ, 585, 677
- [38] Peterson J.R. et al. 2001, A&A, 365, L104
- [39] Peterson J.R., Kahn S.M., Paerels F.B.S., Kaastra J.S., Tamura T., Bleeker J.A.M., Ferrigno C., Jernigan J.G., 2003, ApJ, 590, 207
- [40] Rees M.J., 1978, Nature, 275, 516
- [41] Ruszkowski M., Brüggen M., Begelman M.C., 2004, ApJ, 611, 158
- [42] Shakura N.I., Sunyaev R.A., 1973, A&A, 24, 337
- [43] Tamura T. et al. 2001, A&A, 365, L87
- [44] Taylor G.B., Sanders J.S., Fabian A.C., Allen S.W., 2006, MNRAS, 365, 705
- [45] Tremaine S. et al. 2002, ApJ, 574, 740
- [46] Volonteri M., Madau P., Quataert E., Rees M.J., 2005, ApJ, 620, 69
- [47] White D.A., Jones C., Forman W., 1997, MNRAS, 292, 419