An Exploratory Chandra Survey of a Well-Defined Sample of 35 Large Bright Quasar Survey Broad Absorption Line Quasars
Abstract
We present 4–7 ks Chandra observations of 35 Broad Absorption Line (BAL) quasars from the Large Bright Quasar Survey, the largest sample of sensitive, 0.5–8.0 keV X-ray observations of this class of quasars to date. The limited ranges in both redshift (–2.90) and ultraviolet luminosity (a factor of ) of the sample also make it relatively uniform. Of 35 targets, 27 are detected for a detection fraction of 77%, and we confirm previous studies that find BAL quasars to be generally X-ray weak. Five of the eight non-detections are known low-ionization BAL quasars, confirming reports of extreme X-ray weakness in this subset ( of optically selected BAL quasars). Those BAL quasars with the hardest X-ray spectra are also the X-ray weakest, consistent with the interpretation that intrinsic absorption is the primary cause of X-ray weakness in this class of quasars as a whole. Furthermore, the observed trend is not consistent with simple neutral absorption, supporting findings from spectroscopic observations of individual targets that BAL quasars typically exhibit complex X-ray absorption (e.g., partially covering or ionized absorbers). Assuming normal quasar X-ray continua and using the hard-band (observed-frame 2–8 keV) X-ray flux to ‘correct’ for the effects of intrinsic absorption at softer energies increases the relative X-ray-to-optical flux ratios to much closer to the range for normal quasars, further indicating that high-ionization BAL quasars are typically neither intrinsically X-ray weak nor suffer from Compton-thick absorption. In general, we find no evidence for correlations between X-ray weakness and ultraviolet absorption-line properties, with the exception of a likely correlation between the maximum outflow velocity of C IV absorption and the magnitude of X-ray weakness. We discuss the implications of our results for disk-wind models of BAL outflows in quasars.
Subject headings:
galaxies: active — quasars: absorption lines — X-rays: galaxies1. Introduction
Since the first surveys with ROSAT, Broad Absorption Line (BAL) quasars have been known to have faint soft X-ray fluxes compared to their optical fluxes (Kopko et al., 1994; Green et al., 1995; Green & Mathur, 1996). Given the extreme absorption evident in the ultraviolet, this soft X-ray faintness was assumed to result from intrinsic absorption with cm-2 (assuming neutral gas). With the 0.5–10 keV response of its detectors, a subsequent ASCA survey was able to raise this lower limit for some objects by an order of magnitude, to cm-2 (Gallagher et al., 1999). In all of these studies, the premise of a typical underlying quasar spectral energy distribution and X-ray continuum was required. This reasonable assumption was justified by the remarkable similarity found between the ultraviolet emission-line and continuum properties of BAL and non-BAL quasars, suggesting that the ionizing continua of the two populations are unlikely to be significantly different (Weymann et al. 1991; hereafter WMFH). The strong correlation found by Brandt, Laor, & Wills (2000; hereafter BLW) for the Bright Quasar Survey quasars (hereafter BQS; Schmidt & Green, 1983) between C IV absorption equivalent width (EWa) and faintness in soft X-rays further supported this assumption. Subsequently, the observation of PG 2112059 with ASCA provided the first direct evidence from X-ray spectroscopy for intrinsic X-ray absorption and a normal underlying X-ray continuum in a BAL quasar (Gallagher et al., 2001).
Gallagher et al. (2002) compiled the results from eight BAL quasars (four with BALs and four with mini-BALs) with enough counts for independent X-ray spectroscopic analysis. They concluded from the spectroscopic evidence that the intrinsic ultraviolet-to-X-ray spectral energy distributions of BAL quasars are consistent with those of typical radio-quiet quasars. Furthermore, complex, intrinsic absorption with cm-2 was generally evident in the X-ray spectra. Subsequently, more spectroscopic observations of individual BAL quasars with Chandra and XMM-Newton have generally upheld these results (e.g., Chartas et al., 2002; Aldcroft & Green, 2003; Chartas et al., 2003; Grupe et al., 2003; Page et al., 2005) with only a few exceptions where intrinsic X-ray faintness cannot be ruled out with the available low signal-to-noise X-ray data (e.g., Mathur et al., 2000; Sabra & Hamann, 2001).
Constraining the physical state of the X-ray absorber, e.g., the column density, ionization state, covering fraction, and velocity structure, is the ultimate goal of spectroscopic X-ray studies of BAL quasars. At present however, only a handful of these generally faint targets have provided data of sufficient quality for detailed spectral analysis. This sample is generally heterogeneous, and thus far there is no outstanding predictor of observed 0.5–10.0 keV flux based on the ultraviolet spectral properties. In other words, though all quasars with broad ultraviolet absorption also apparently have substantial X-ray absorption, there has been no obvious connection found between the characteristics of the ultraviolet and X-ray absorbers as of yet. The one apparent exception to this finding is that low-ionization BAL (LoBAL) quasars – the subset of the BAL quasar population with Mg II and Al III BALs in addition to the typical higher ionization ultraviolet BALs such as C IV and O VI – are notably X-ray weaker than normal BAL quasars (Green et al., 2001; Gallagher et al., 2002).
In this paper, we present exploratory Chandra (Weisskopf et al., 2002) Advanced CCD Imaging Spectrometer (ACIS; Garmire et al. 2003) observations of 35 Large Bright Quasar Survey BAL quasars. These short (4–7 ks) observations are intended to determine the basic X-ray fluxes and rough spectral shapes of the sample, and for those targets that are not detected, sensitive upper limits can be set with these exposure times. This strategy was successfully applied in the survey of ten BAL quasars by Green et al. (2001) who found that normal BAL quasars were systematically X-ray faint. With their high detection fraction (8 out of 10), composite spectral analysis indicated that this weakness could be explained by intrinsic absorption with a partially covering neutral absorber with an average cm-2. Correcting for this level of absorption resulted in underlying spectral energy distributions typical of normal radio-quiet quasars. The present study applies this fruitful approach to a much larger and more uniform BAL quasar sample. A primary goal of this BAL quasar X-ray survey is to investigate the relationship between ultraviolet and X-ray absorption in luminous quasars in an effort to gain insight into the mechanism for launching and maintaining energetic quasar winds.
The sample selection is outlined in §2; in §3 the Chandra observations and X-ray data analysis are described. The possible effects of ultraviolet variability on determining the X-ray weakness relative to the ultraviolet continuum are discussed in §4, and §5 is a description of continuum and ultraviolet absorption-line measurements. The results from X-ray analysis, a comparison with ultraviolet spectroscopic properties, and the implications for disk-wind models are presented in §6 with the summary and conclusions of the study in §7. The cosmology adopted throughout the paper is =70 km s-1 Mpc-1, =0.3, and =0.7.
2. Exploratory Chandra BAL Quasar Sample
In an effort to increase significantly the number of BAL quasars with useful X-ray constraints, we have compiled a large sample of BAL quasars from the Large Bright Quasar Survey (LBQS; Hewett et al., 1995). The targets are optically bright with 111This blue magnitude is related to the more standard Johnson blue magnitude: (Hewett et al., 1995). magnitudes of 16.7–18.8, and they are drawn from a homogeneous, magnitude-limited quasar survey that has effective, well-defined, and objectively applied selection criteria (e.g., Hewett et al., 2001). Six known LoBAL quasars are included.
This sample of BAL quasars offers the advantages of being much larger and more homogeneous than those in previous hard-band X-ray surveys. For comparison, while the Green et al. (2001) sample had comparable sensitivity, the smaller sample size (10 objects) as well as the large ranges in redshift (–2.371) and ultraviolet luminosity (almost a factor of 40) made general conclusions about BAL quasars as a class more difficult to extract. Our sample ranges over narrower spans of both properties with –2.90 and ultraviolet luminosities covering only a factor of . The overall sample is luminous, with to (using the -corrections for non-BAL quasars of Cristiani & Vio 1990).
To date, our sample includes 35 of the 44 BAL quasars from the LBQS with a BAL probability of 1.0 (Hewett & Foltz, 2003) and , the redshift at which the definitive C IV BAL is shifted into the wavelength regime accessible with ground-based spectroscopy. This sample includes all of the confirmed LBQS BAL quasars identified by Weymann et al. (1991) and Green et al. (1995); several more with more moderate absorption were subsequently found by Hewett & Foltz (2003). The LBQS BAL quasar X-ray sample has distributions of and consistent with the complete LBQS BAL quasar sample. The main discrepancy between the X-ray subsample and the complete LBQS BAL quasar sample is that the X-ray subset includes a somewhat larger fraction of quasars with the largest ultraviolet absorption troughs (as indicated by their BALnicity index values; see below for the exact definition of this quantity). These BAL quasars were most readily identified by eye from the LBQS discovery spectra and were therefore the first followed up with higher quality spectroscopy (e.g., WMFH; Korista et al., 1993). The quasars in our sample were selected before the publication of Hewett & Foltz (2003).
Our observed Chandra sample is listed in Table 1 which includes optical photometry, redshift, the flux density at rest-frame 2500 Å (), and Galactic for each object. The values for were calculated by averaging the flux densities in the rest-frame range of Å from the optical spectra obtained from Korista et al. (1993; hereafter KVMW), the Sloan Digital Sky Survey (SDSS; York et al., 2000), or the LBQS (Hewett et al., 1995). The spectra were first normalized using the , , and SDSS (preferred) or LBQS magnitudes by matching the mean flux density in the spectral region corresponding to each filter bandpass to the photometry. Table 1 also includes the BALnicity Index (BI). The BI, roughly equivalent to the C IV EWa in velocity units, specifically includes any contiguous absorption that falls between 3000–25,000 km s-1 blueshifted from the systemic redshift, if the absorption (at least below the continuum) exceeds 2000 km s-1 in width (WMFH); the BI values for the entire sample were obtained from Hewett & Foltz (2003). According to WMFH, a BAL quasar by definition has non-zero BI. Though this definition may omit some quasars with evident broad absorption, all quasars with non-zero BI are definitely BAL quasars.
Only one of the quasars in our sample is known to be formally radio-loud as defined by radio-to-optical flux ratios, or (see Table 1), where = (Stocke et al., 1992) and = (Ivezić et al., 2002). The flux densities at 5 GHz, , are taken from Stocke et al. (1992), and values are from the Faint Images of the Radio Sky at Twenty centimeters survey (FIRST; White et al., 1997) as reported in Hewett et al. (2001). The upper limits assume a limiting flux density for the FIRST survey of 1 mJy. The optical flux densities (in mJy), and , are taken from this paper (Table 1, column 4) and the SDSS, respectively. We obtained values or limits for for three additional quasars from the NRAO VLA Sky Survey (NVSS) with a limiting flux density of mJy (Condon et al., 1998). Of these, a point source within of the optical coordinates of B22111915 had a measured flux density of 64 mJy to give . for the three NVSS objects was calculated by extrapolating from using (see §5).
The four quasars without radio constraints are too far south to be accessible to the VLA. Based on the radio-loud fraction of the LBQS determined from a cross-correlation with the FIRST survey (Hewett et al., 2001), we expect at most () of these to be radio-loud, though a more likely value is based on the lower fraction of radio-detected BAL versus non-BAL quasars (Hewett & Foltz, 2003).
3. X-ray Observations and Data Analysis
Each target was observed at the aimpoint of the back-illuminated S3 CCD of ACIS in faint mode. The exposure times range from 4.3–7.1 ks, and they were chosen to obtain detections ( counts) even with intrinsic absorption up to cm-2 assuming a normal underlying radio-quiet quasar spectral energy distribution. The data were processed using the standard Chandra X-ray Center (CXC) aspect solution and grade filtering. In general, we followed the procedure described in detail in Gallagher et al. (2005), which we outline briefly. Both aperture photometry and the CIAO 3.2222http://cxc.harvard.edu/ciao wavelet detection tool wavdetect (Freeman et al., 2002) were used in the soft (0.5–2.0 keV), hard (2.0–8.0 keV), and full (0.5–8.0 keV) bands to determine the measured counts for a point source in each band. A 60 image around the known optical position of each quasar was searched with wavdetect at the 5 false-positive probability threshold for each band. This threshold, while looser than those typically used in X-ray surveys, is appropriate when source positions are specified a priori. Wavelet scale sizes were 1, 1.414, 2, 2.828, 4, and 5.66 pixels. For aperture photometry, the counts were extracted from circular source cells centered on the full-band X-ray centroid positions (or LBQS optical positions for non-detections) with a 25 radius. Of the 35 observed BAL quasars, 27 were significantly detected in the full band, and 22 (21) were individually detected in the soft (hard) bands. Our required optical/X-ray positional match was . This was met for all but two targets, B10290125 and B12401607, which were discrepant by and , respectively. A careful inspection of coincident optical (from the Digitized Sky Survey333http://archive.stsci.edu/cgi-bin/dss_form) and X-ray sources indicated systematic 1–1 offsets between the two consistent with an absolute astrometric offset in the Chandra observations. For the remainder of the detected sources, the average offset between the X-ray and optical positions was . The background (determined from a source-free annulus surrounding each target) was in all cases negligible (1 count in the source region).
From the deep-field X-ray source counts of Bauer et al. (2004, see their Fig. 4), sources per deg2 are expected at our faintest 0.5–2.0 keV upper limit flux of erg cm-2 s-1. Within a -radius source cell, therefore, the probability of a false match is (per band) for the entire sample of 35 objects. Therefore, even if all three bands are taken to be independent, we do not expect any false matches in this sample.
For each target, to provide a coarse quantitative measure of the spectral shape we calculated the hardness ratio, defined as HR , where and refer to the hard- and soft-band counts, respectively. A typical, radio-quiet quasar has a power-law continuum in the 0.5–10.0 keV band characterized by the photon index, , and the 1 keV normalization, : ( photon cm-2 s-1 keV-1). From spectral fitting of broad-band X-ray data, is found to average for radio-quiet quasars (e.g., George et al., 2000; Reeves & Turner, 2000). The observation dates, exposure times, count rates, and HRs of the quasars in the sample are listed in Table 2.
To transform the observed HR into , the X-ray spectral modeling tool XSPEC (Arnaud, 1996) was used as a simulator. For each observation, the appropriate Galactic column density (see Table 1), auxiliary response file (arf), and redistribution matrix file (rmf) were incorporated into the modeling. The arf and rmf are required to model the response of the telescope-detector system to incident X-rays; they were generated with the CIAO tool psextract for each observation and properly take into account the time-dependent contamination of the ACIS filter (Marshall et al., 2004). The detector response to a grid of incident power-law spectra with varying was then simulated. The observed HR was compared to the modeled HR values, and the exact value of the corresponding was determined by interpolating the grid values (separated by 0.1 in ). The errors in reflect the statistical errors in the HR. The modeled full-band count rate was normalized to the observed full-band count rate to obtain the power-law normalization, . With and , the 0.5–8.0 keV flux, , and the flux density at rest-frame 2 keV, , were calculated. The errors quoted for these two values are the Poisson errors (Gehrels, 1986) from the full-band counts. For the non-detections, was assumed to calculate the limits on and because these quasars are likely to have hard spectra from absorption. Assuming a typical soft quasar continuum with for quasars that are likely absorbed exaggerates the measured X-ray weakness because ACIS-S is significantly more sensitive from 0.5–2.0 keV.
Lastly, =0.384 (Tananbaum et al., 1979) was calculated, where the factor 0.384 is the inverse of the logarithm of the ratio of the frequencies at which the flux densities are measured. We point out that has not been corrected for intrinsic reddening of the ultraviolet quasar continuum. Apparently unreddened quasars exhibit a range of continuum shapes (e.g., Richards et al., 2002), and so it is not clear how to measure accurately or correct for reddening in an individual quasar. However, in an analysis of 224 SDSS BAL quasars, Reichard et al. (2003) found that BAL quasars are in general mildly dust-reddened, with an average of 0.023 and 0.077 for high-ionization (HiBAL) and LoBAL quasars, respectively. At 2500 Å, correcting for this amount of extinction (assuming Small Magellanic Cloud reddening and using the Fitzpatrick & Massa 1999 extinction parameterization) increases the ultraviolet flux density by factors of 1.17 and 1.68, corresponding to decreases in of and for HiBAL and LoBAL quasars, respectively.
The parameter is known to correlate with ultraviolet luminosity, with more luminous quasars being relatively X-ray weaker than less luminous quasars (e.g., Avni & Tananbaum, 1986; Wilkes et al., 1994; Green et al., 1995; Vignali et al., 2003; Strateva et al., 2005). To account for this known correlation, we have calculated the parameter =–, where is the expected based on the 2500 Å monochromatic luminosity, (Eq. 6 of Strateva et al., 2005). This characteristic actually compensates somewhat for the effect on of dust reddening mentioned above, in that an underestimate of the ultraviolet luminosity at 2500 Å will lead to a slight overestimate of the expected relative X-ray luminosity. Therefore, for an average HiBAL quasar (LoBAL quasar), the net effect of dust reddening in is (). We note that LBQS quasars are in general quite blue, and so this is likely at the high end of the average systematic offset for this particular sample. In addition, there is an average uncertainty of in from the scatter in the vs. quasar distribution. The values for and the derived X-ray properties are presented in Table 3.
Based on the X-ray spectral analysis of Gallagher et al. (2002), the observed X-ray continua above rest-frame 5 keV for their spectroscopic sample of BAL quasars were found to be largely free from the effects of intrinsic absorption. In each case, fitting this hard continuum gave , consistent with the photon indices from the final model fits which included complex absorption. If this situation generally holds true, the intrinsic 2 keV flux density can be reasonably estimated by using the X-ray continuum above 5 keV to normalize a typical quasar power-law spectrum. Following this assumption, the counts in the observed-frame 2–8 keV bandpass were used to normalize a power-law model. With this normalization, an “absorption-corrected” value for the 2 keV flux density could be used to estimate an intrinsic , . The final columns in Table 3 list and =– for the 21 hard-band detected BAL quasars, and upper limits for the rest.
4. Ultraviolet Variability and
The LBQS imaging plates were exposed between 1975–86 (Hewett et al., 1995), at least 15 years prior to the first Chandra observations; this observed time difference is reduced by cosmological time dilation by a factor of 2.4–3.9. Given the propensity of quasars to exhibit both ultraviolet and X-ray continuum variability, the mismatch between the epochs of optical and X-ray observations will introduce additional uncertainties into the measurement of . Of the 35 BAL quasars presented, 20 have SDSS photometric data included in Data Release 4.444http://www.sdss.org/dr4/ These high-quality data enable an investigation into the effects of ultraviolet variability in the calculation of .
To examine the potential effects of ultraviolet variability, we directly compared the flux densities at the central wavelengths, 4627 and 4686 Å (using 4261 and 3631 Jy for the magnitude zeropoints) of the LBQS and SDSS filters, respectively (Hewett et al., 1995; York et al., 2000). Of the 20 quasars with SDSS data, 45% (9) gave flux densities within 15% of the flux densities, consistent with the stated LBQS photometric uncertainties (Hewett et al., 1995). The mean and standard deviation of the fractional difference are , indicating that there is no evidence for a significant systematic offset in the blue photometry from the two surveys. Furthermore, while long-term variability increases the uncertainty in by as much as , this effect is typically less than the uncertainty from the X-ray counting statistics, and the additional random error will not adversely affect the calculation of average properties of the sample. To mitigate the effects of ultraviolet variability as much as possible, we have measured from spectra that are normalized using available photometry from the epoch closest to the Chandra observations. We also point out that X-ray variability of a factor of a few causing changes of has been seen in at least one luminous BAL quasar (e.g., PG 2112059; Gallagher et al., 2004). Though it is unknown how often this occurs, a few objects in the total sample might be expected to show such X-ray variability over timescales of years.
For reference, we also examined the effects of calculating by extrapolating from observed-frame blue photometry by assuming a typical quasar ultraviolet continuum described by a power law with spectral index, (Vanden Berk et al., 2001). Specifically, we have calculated the rest-frame 2500 Å flux densities by extrapolating from () as well as the SDSS bandpass nearest to (). We use rather than as data from the same epoch eliminate the effect of variability. The mean and standard deviation of the fractional difference between and is . This would give on average a systematic underestimate of resulting in a mean underestimate of . This result is expected based on the conclusion of Reichard et al. (2003) that BAL quasars typically show more continuum reddening than typical quasars with LoBAL quasars showing the most reddening (Sprayberry & Foltz, 1992). Our measurements of were done using spectra, and so this problem does not affect our results. The fractional differences from both the ultraviolet variability and extrapolation analyses are plotted in Figure 1.
5. Ultraviolet Continuum and Absorption-Line Measurements
In order to characterize the ultraviolet continua and C IV absorption lines of the LBQS X-ray sample, we measured several properties from the available spectroscopy from KVMW, SDSS, or the LBQS discovery spectra (listed in order of preference based on spectral quality). The first measured parameter was the power-law continuum spectral index, , where , derived from fitting a power-law to the continuum-dominated rest-frame spectral regions of 1700–1800, 1950–2050, 2150–2250, and 2950–3100 Å, as available. These values are listed in Table 1.
The BI values for the complete sample (listed in Table 1) were already available. However, for comparison with other quasar samples, the C IV EWa (in Å) is also useful. Though BI and C IV EWa are highly correlated, BI by definition does not include low-velocity absorption, and so a simple unit conversion from BI measured in km s-1 to Å will underestimate the corresponding C IV EWa. For the quasars presented in KVMW, we were able to use their continuum-divided spectra (S. Morris, 2005, priv. comm.). For the rest, we followed the prescription in KVMW by fitting a low-order polynomial to smooth regions of the continuum to normalize the spectrum. Next, we fit a gaussian to the red-wing of the C IV emission-line, and again normalized the spectrum; this was necessary to include low-velocity absorption in the C IV EWa. Spectral regions covering the blueshifted outflow velocities of 0–25,000 km s-1 with relative flux densities were considered absorbed; this specification gave values that agreed best with the values for the 23 BAL quasars presented in Hamann et al. (1993, F. Hamann, 2001, priv. comm.). Our measured C IV EWa values are listed in Table 1.
Based on the correlation of the maximum outflow velocity, , of C IV absorption with found by Laor & Brandt (2002) for the X-ray weak BQS quasars, the quantity is also of interest. Though many quasars in the LBQS X-ray sample have values available in the literature (Lamy & Hutsemékers, 2004), we redid these measurements for the entire sample using electronic spectra to obtain a uniform and consistently measured quantity. As with the C IV EWa, the largest uncertainty in determining is setting the continuum properly, particularly shortward of the C IV emission line. Spectral regions covering the blueshifted outflow velocities of 0–25,000 km s-1 from C IV where the flux dropped to of the continuum level were considered absorbed. Though BAL outflow velocities can be greater than 25,000 km s-1, above this value Si IV absorption can confuse the measurement. We formally define the quantity to be the maximum velocity where the absorption was at least 2000 km s-1 wide. This last requirement was necessary given the variable spectral quality (both in resolution and signal-to-noise ratio) in this region. Those quasars with absorption that starts at outflow velocities km s-1 and clearly continues above this value are given lower limits, km s-1.
Finally, we also measured , the fraction of the absorption between 0 and 25,000 km s-1 that is deeper than of the continuum level. This last quantity was chosen to investigate the possibility that quasars with shallow BALs have lower X-ray absorption column densities, as found for PG 2112059 (Gallagher et al., 2001) and CSO 755 (Shemmer et al., 2005). We confirmed by visual inspection that those BAL quasars with qualitatively shallow troughs had values of . The quantities and are listed in Table 1.
6. Results and Discussion
6.1. General X-ray Properties of BAL Quasars
For the entire sample, we were able to measure or place sensitive upper limits on , a standard indicator of the relative X-ray versus ultraviolet power. Our values of range from –2.48 to with a median value of . This is an enormous range in X-ray-to-optical flux ratio of . In Figure 2, we show the distribution of =– (to account for the luminosity dependence of ) for this sample. For comparison, the distribution of values from the SDSS/ROSAT survey of Strateva et al. (2005) is also plotted. The median quasar in the LBQS BAL quasar sample has an offset of in from the peak of the typical quasar distribution. This indicates that the median BAL quasar is times fainter at rest-frame 2 keV than expected based on its 2500 Å ultraviolet luminosity. The distribution of =–, where is calculated by assuming and using the hard-band count rate to normalize the X-ray continuum (see §3), shifts the BAL quasar population much closer to that of normal quasars, with a median value of =–0.14. The large number of upper limits on (14 of 35) makes the distribution of less well defined than that of . However, it is nonetheless clear that the distribution of does not agree statistically with the Strateva et al. (2005) sample (see Table 4). It is likely that additional absorption is not being properly accounted for with this simple correction. The quartile divisions, medians, and means of the , , and distributions for the entire sample and the subset of known HiBAL quasars are listed in Table 4.
Notably, of the eight BAL quasars with only upper limits to , five of these are LoBAL quasars; all six LoBAL quasars have , the median of the BAL quasars’ distribution. The only detected known LoBAL quasar in the sample, B13310108, has . This result strengthens the conclusion of Green et al. (2001) that LoBAL quasars are significantly X-ray weaker than normal BAL quasars.
To obtain tighter constraints on the average X-ray flux of these LoBAL quasars, we stacked the full, soft, and hard-band images of the five undetected LoBAL quasars aligned by the optical quasar positions, and performed aperture photometry as described in 3 on each composite image. Stacking analysis is a robust technique that has been employed successfully to constrain the average X-ray properties of extremely X-ray faint populations (Green et al., 1995; Brandt et al., 2001, see their Appendix A). The combined exposure time is 28.2 ks. In the source cell of the full/soft/hard band images, 4/3/1 counts were obtained where 1.5/0.4/1.1 counts were expected from the background. According to Poisson statistics, this indicates a significant detection of the LoBAL quasars in the stacked soft band image; the Poisson probability of obtaining counts when 0.4 is expected is . This detection yields an average erg cm-2 s-1 and . Given the larger effective area in the soft band, this does not provide an interesting constraint on the X-ray spectral shape. Taking the mean for the five objects, the average is , times fainter than expected based on the ultraviolet luminosities. This value for the average may result from Compton-thick absorption as has been spectroscopically demonstrated for the LoBAL quasar Mrk 231 (Braito et al., 2004), which has an intrinsic-to-observed 2–10 keV luminosity ratio of .
While is a sensitive indicator of relative X-ray strength or weakness, the X-ray data provide additional information on the shape of the X-ray continuum from the distribution of , which can only be measured for the 27 detected BAL quasars. For those objects with only soft-band detections, is a lower limit; conversely with only a hard-band detection is an upper limit.
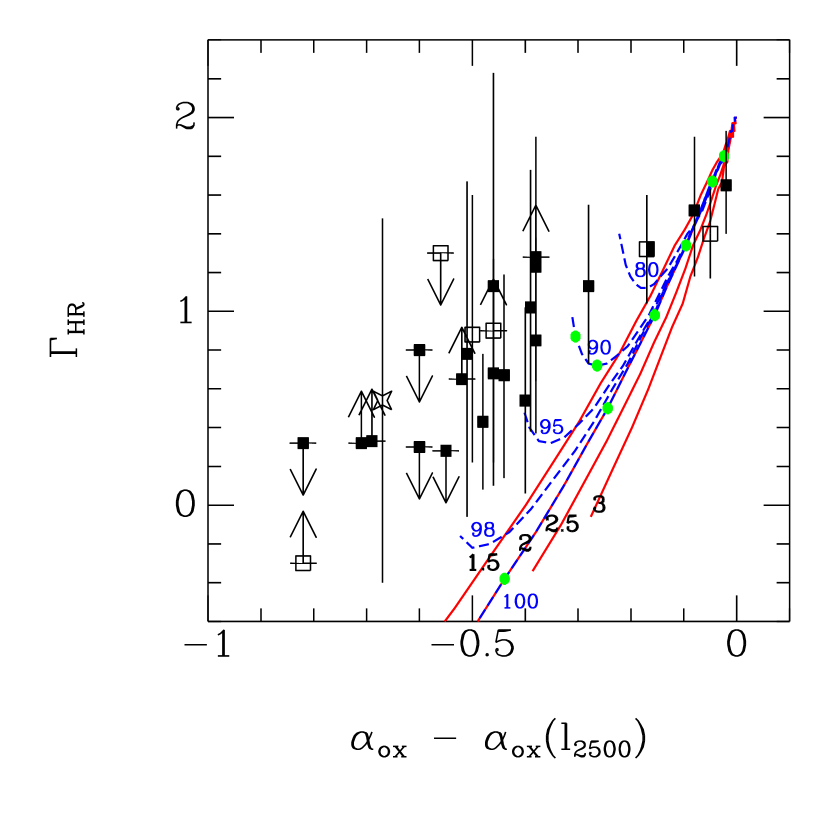
While typical quasars have rest-frame 2–10 keV photon indices of , a quasar exhibiting intrinsic absorption will have an apparently harder X-ray spectrum due to the lack of low-energy X-rays. In this case, intrinsic absorption would lead to a smaller value of ; the lack of soft X-ray photons will also depress . As seen in Figure 3, a plot of versus for the sample of detected BAL quasars, those quasars with the most negative values of tend to have the lowest values of . That is, the X-ray weakest objects also tend to have the X-ray hardest spectra. To test if this apparent trend represents a significant correlation, we used the ASURV Rev. 1.2 (La Valley et al., 1992) software package to perform a non-parametric, bivariate statistical test on the data. ASURV implements the methods described in Isobe et al. (1986) and was designed to handle censored data sets, such as (with both upper and lower limits). For this application, the generalized Kendall’s (Press et al., 1997, Chapter 14) statistic was calculated. From the distribution of this statistic expected from unrelated data, the probability that two variables are correlated can then be estimated; the results of this analysis are presented in Table 5. From the Kendall’s value of 4.055, the probability of no correlation is 0.01. Excluding the radio-loud BAL quasar B22111915 did not significantly alter the result. We therefore consider and to be significantly correlated. Testing vs. also indicates a significant correlation independent of .
There is no obvious reason why and would be correlated if BAL quasars were typically intrinsically X-ray weak; intrinsic absorption provides a reasonable common cause for the correlation. However, the tracks of versus for intrinsic, neutral absorption shown in Figure 3 lie almost entirely to the right of the actual data. This discrepancy does not result from ultraviolet reddening as any corrections to to account for reddening would push the observed BAL quasars’ distribution further to the left. X-ray spectroscopy of BAL quasars has shown that the intrinsic absorption in BAL quasars is typically complex, perhaps due to partial covering and/or ionization, but with the present spectral resolution and signal-to-noise ratio, the specific nature of that complexity is poorly constrained. Empirically, this complexity manifests itself as additional flux at low X-ray energies from what would be expected from a completely neutral absorber. This is also what the data points indicate in Figure 3. The dashed, blue tracks in the figure show the effect of a partially covering neutral absorber in the - plane; though this type of absorption is more consistent with the data points, they are still more X-ray weak than would be expected. A possible explanation for this is Compton scattering, which is not included in the XSPEC absorber models (e.g., wabs and zpcfabs). Compton scattering is likely to have a measurable effect for cm-2 and may account for the depressed values. Unfortunately, satisfactory models for high column density, ionized absorbers are not available in XSPEC.
6.2. Comparison of X-ray and Ultraviolet Properties
A primary goal of this survey is to investigate the relationship between the ultraviolet absorber and X-ray properties to understand better the nature of the BAL wind. To characterize quantitatively the ultraviolet BALs, we use four parameters, BI, the Detachment Index (DI), , and ; all four were measured for the C IV BAL. The second absorption parameter, DI, is defined as a dimensionless measure of the velocity of the onset of absorption normalized to the width of the emission line (WMFH). The values for DI were compiled by Lamy & Hutsemékers (2004); 27 BAL quasars have DI data. The specific definitions and measurements of BI, , and are described in §5 and listed in Table 1.
The parameter was tested against each ultraviolet absorption-line property using two bivariate non-parametric statistics, generalized Kendall’s and Spearman’s (Press et al., 1997, Chapter 14), to search for correlations. We use rather than as the X-ray parameter of interest because is much less sensitive to Poisson noise and is available for all objects in the sample; only detected objects have values of . We consider two parameters to be significantly correlated if at least one test gives a probability that they are not correlated . In addition to the full sample of BAL quasars, the tests were also performed separately for the 24 quasars known to have only high-ionization BALs (indicated with ‘Hi’ in Table 1). We also checked that the presence of the radio-loud BAL quasar B22111915 in the sample did not significantly affect any test results; it did not. The results from these analyses are presented in Table 5, and each absorption-line parameter is plotted against in Figure 4.
For the first two parameters, BI and DI, there is no significant evidence for correlations with . Specifically, the X-ray weakest BAL quasars and the X-ray brightest BAL quasars span the range of BI and DI. One plausible and straightforward explanation for the lack of correlation between BI and is that the ultraviolet and X-ray absorption are not occurring in the same gas; this has already been suggested by absorption studies of individual BAL quasars with spectroscopic X-ray data. This first result is perhaps surprising given that BLW found a highly statistically significant correlation between C IV EWa and for BQS quasars.555We choose to use BI instead of C IV EWa for this analysis as BI values have been uniformly measured for the entire sample and are less sensitive to assumptions about the shape of the C IV emission line. We compare the BQS with our sample results in more detail below in §6.4.
The lack of correlation between DI and is surprising based on prior expectations from disk-wind models. As stated explicitly by Goodrich (1997, §4), one would predict from the geometry of the equatorial disk-wind models of Königl & Kartje (1994) and Murray et al. (1995, hereafter MCGV) that the BAL quasars viewed through lines of sight closest to the plane of the accretion disk would show low-velocity ultraviolet troughs (and thus have low DI values) as well as the largest amounts of overall absorption. We discuss the implications of this result in more detail in §6.5.
The third absorption-line parameter, , does show a significant correlation with , with probabilities that the properties are not correlated of 0.003 from both the Kendall and Spearman tests. (Excluding the radio-loud BAL quasar gives probabilities of 0.009 and 0.007 for the Kendall and Spearman tests, respectively.) Tests of versus (without any dependence on the Strateva et al. 2005 correlation) is similarly signficant. This intriguing result indicates that the most X-ray absorbed BAL quasars (as indicated by their X-ray weakness) are more likely to have high-velocity outflows viewed along the line of sight. In the context of radiatively driven winds, this points toward large radial acceleration of the outflow requiring a very thick X-ray absorber. This is most evident in the extreme objects with lower limits and upper limits; both this subset and the low , X-ray bright BAL quasars contribute to the significance of the correlation. At present, with only four data points at the low , X-ray-bright end, further testing with larger samples is required to determine if this correlation holds up with a more uniform distribution of . Such studies should also take care to maintain a uniform ultraviolet luminosity given the correlation between and ultraviolet luminosity found by Laor & Brandt (2002) for their BQS sample. Even with the current sample (as seen in Fig. 4c), the LoBAL quasars are preferentially found with the most extreme values of both and . One plausible explanation is that both the highest velocity acceleration and the survival of low-ionization gas in the outflow require X-ray absorption near the Compton-thick limit.
The final absorption-line property, , is not correlated with . The six BAL quasars with the shallowest BALs, as identified by visual inspection and indicated with values of , span the range of . Though there are some BAL quasars in addition to PG 2112059 and CSO 755 with shallow troughs that are relatively X-ray bright, is not generally a predictor of the level of X-ray weakness. That is, not all BAL quasars with shallow ultraviolet absorption troughs are relatively X-ray bright, and not all X-ray bright BAL quasars have shallow troughs.
The ultraviolet continuum power-law slope, , shows no evidence of a correlation with : both red and blue BAL quasars can exhibit extreme X-ray weakness.
6.3. The X-ray Brightest BAL Quasars
Even before renormalizing the X-ray continuum using the observed-frame 2–8 keV counts (rest-frame keV), not all of the BAL quasars are observed to have values that would group them as X-ray weak, i.e., with . As seen in Figure 3, this subset of BAL quasars also has the largest values in the sample with . While the calculated X-ray fluxes do suffer from large errors due to the generally low count rates, is not very sensitive to these errors, and this X-ray-normal sample typically has smaller errors in because of better photon statistics.
To investigate if this subset, the X-ray bright BAL quasars, also shows evidence for intrinsic absorption, we performed a joint-spectral fit on the four quasars with to determine their average X-ray spectral properties. The four X-ray bright BAL quasars, B22111915, B00290017, B12350857, and B12051436 (in order of increasing ), have a total of 265 0.5–8.0 keV counts. The spectra were extracted using 25-radius source cells from the level 2 events files, and the arfs and rmfs were generated using the CIAO script psextract. Our spectral model was a simple absorbed power-law continuum with both Galactic and intrinsic absorption by neutral gas with solar abundances; the limited photon statistics do not warrant a more complex model. For joint-spectral fitting, the parameters of interest, intrinsic and , are fit together while the Galactic and are fixed to the appropriate values for each quasar. For each quasar, the individual power-law normalizations are free to vary (see §4 of Gallagher et al. 2005 for further details). In this low-count regime, the spectra are not binned and the fit is performed with XSPEC by minimizing the -statistic (Cash, 1979).
From the joint-spectral fitting, the best-fit model includes a significant detection of intrinsic absorption with cm-2 and a normal radio-quiet quasar X-ray continuum with (the stated uncertainties are 90% confidence for two parameters of interest). Excluding the radio-loud BAL quasar B22111915 from the sample increases the upper error on from to , but otherwise does not significantly affect the best-fitting values of and . At these redshifts, this amount of intrinsic absorption does not substantially alter , and the decrease in is consistent with the fitted column density and underlying . The additional energy resolution from spectral analysis confirms the amount of absorption implied by the values (assuming a normal radio-quiet ).
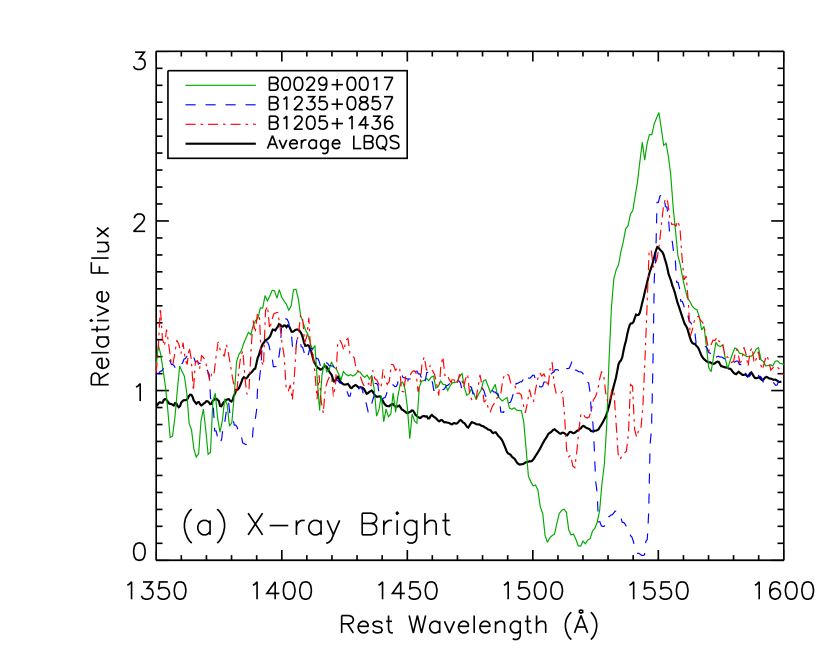
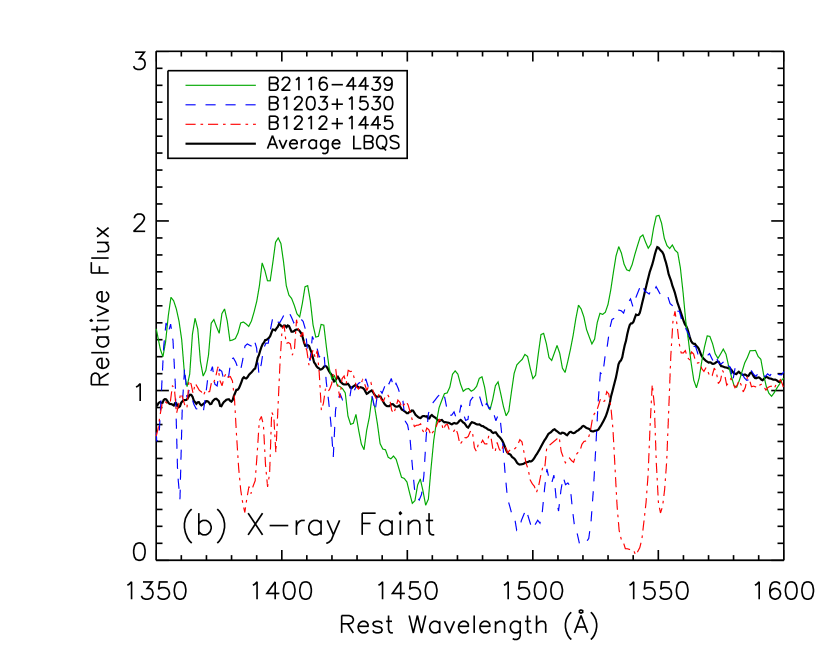
While cm-2 is on the low end of the distribution of for BAL quasars in general, at least two other BAL quasars, PG 2112059 and CSO 755, have spectroscopically measured absorption of approximately this magnitude (Gallagher et al., 2001; Shemmer et al., 2005). The three X-ray brightest BAL quasars in the sample, B00290017, B12350857, and B12051436, all have spectra from KVMW, and we plot their C IV profiles as well as an average spectrum of the 27 objects in our sample observed by KVMW in Figure 5a. The X-ray brightest BAL quasars have narrow absorption troughs with low onset and maximum velocities compared to the mean. This is quantitatively shown by the relatively low values of both DI and of these objects (see Fig. 4b and c), though their BIs are in the middle of the BAL quasar distribution (5263, 815, and 788 km s-1). The fourth X-ray bright (and radio-loud) BAL quasar, B22111915, also has a relatively narrow BAL (see Fig. 1 of Morris et al., 1991) with a low (for a BAL quasar) maximum velocity of 11,544 km s-1; its BI value of 27 km s-1 is the lowest in the sample. For comparison, we also show the C IV spectra of the three X-ray faintest HiBAL quasars with at least moderate quality spectra (Fig. 5b). Qualitatively, their BALs are much broader and extend to higher velocities while their BI values (2594, 1517, and 3618 km s-1) are moderate.
6.4. Comparison to the BQS Quasars
With this sample of BAL quasars, we can add significantly to the sample of quasars with X-ray weakness data and strong ultraviolet absorption as originally presented in BLW for the BQS objects. The BLW sample only contained a few BAL quasars but encompassed a large dynamic range of C IV EWa; the majority of the BQS sample exhibited neither weakness in X-rays nor C IV absorption. For this comparison, we use rather than because of the large and disparate luminosity ranges spanned by the BQS and LBQS BAL quasar samples; LBQS quasars are typically 10–100 times more luminous. For the record, the bivariate correlation statistics of C IV EWa vs. for the BQS sample are presented in Table 5. As seen in Figure 6a which shows C IV EWa vs. for both our sample and the BLW sample, the BAL quasars occupy the region of the most extreme C IV EWa (as expected), though they do not extend to much larger values of . Though this is partially due to the detection limit of the present survey, the mean detection of the LoBAL quasars suggests that the distribution would end at , probably indicating the Compton-thick limit; some BQS objects are similarly X-ray weak even with notably smaller C IV EWa values.
This BAL quasar sample is probing the most extreme end of the C IV absorption distribution, where a straightforward relationship between weakness in soft X-rays and ultraviolet continuum absorption apparently does not hold. Given the well-documented complexity of BAL profiles, which can include contributions from scattered light and exhibit severe saturation (e.g., Ogle et al., 1999; Arav et al., 2001), the observed lack of correlation is perhaps understandable. However, it does seem clear that, particularly in the X-ray weakest BAL quasars, the ultraviolet continuum is unlikely to be obscured by the large amount of gas blocking the X-ray continuum.
Laor & Brandt (2002) found that for a large luminosity range, was significantly correlated with for the ten X-ray weak objects in their sample. This is consistent with similar types of radiatively driven outflows being found on all luminosity scales. We show vs. in Figure 6b for both the X-ray weak quasars from Laor & Brandt (2002) as well as the LBQS X-ray BAL quasar sample. We use rather than because the former quantity is readily available for both samples. Also, provides a more direct and easily comparable measure of the ultraviolet continuum. The LBQS BAL quasars, at the high end of the luminosity distribution, do not lie on the correlation of Laor & Brandt (2002), though that correlation may define the maximum possible for a given ultraviolet luminosity. Alternatively, the correlation may saturate at high luminosities. For the LBQS sample alone, and are not correlated (see Table 5); however, the narrow range of means this is not an ideal sample for testing this correlation.
Though some of the LBQS sample have values of that would not qualify as formally X-ray weak according to the criterion of Laor & Brandt (2002), this is largely an artifact of the different bandpasses (0.5–8.0 keV for Chandra vs. 0.1–2.4 keV for ROSAT) and redshift ranges defining the two samples. The spectroscopic evidence indicates that the X-ray bright LBQS BAL quasars are absorbed with cm-2 (see §6.3), similar to the amount of absorption found in some X-ray faint BQS quasars (e.g., PG 2112059).
6.5. Implications for Disk-Wind Models
While X-ray spectroscopy of individual objects has in general supported the radiatively driven disk-wind paradigm for BAL quasars (MCGV), this expansion of the population of BAL quasars with X-ray data offers further insight. In the MCGV picture, equatorial X-ray absorbing gas with – cm-2 is required interior to the BAL gas to shield the disk wind, driven by resonance-line pressure from ultraviolet photons, from becoming completely ionized by the soft X-rays generated near the central engine. The range of inferred column densities for the detected BAL quasars, to more than a few cm-2 (see Fig. 3), is generally consistent with the shielding gas in the MCGV models as well the hydrodynamic models of Proga et al. (2000). Furthermore, the mismatch of the inferred column densities for the X-ray absorbers and reasonable values for the ultraviolet absorbers ( cm-2; e.g., Arav et al. 2001) appears to be prevalent. This is most evident in those BAL quasars whose X-ray properties point toward Compton-thick absorption. Such obscuration clearly cannot cover a significant fraction of the ultraviolet continuum source; a simple explanation for these constraints is a very compact, thick absorber interior to the region generating the ultraviolet continuum.666It is also possible that optical selection effects (e.g., arising from the different -corrections for BAL vs. non-BAL quasars; Hewett & Foltz 2003) may play a role not yet understood that affects the ultraviolet/X-ray relations. This scenario is not analogous to the situation for Compton-thick Seyfert 2s where the ultraviolet continuum and broad emission lines are all blocked, and a single, cold absorber (i.e., the putative ‘torus’) at much larger radii can account for the observations.
Additional support for the importance of radiation pressure in driving the ultraviolet BAL wind comes from the likely connection between and . Specifically, the BAL quasars with the largest values of are extremely X-ray weak, and the X-ray brightest BAL quasars all have relatively narrow, low-velocity ultraviolet BALs. These empirical results point toward a link between the column density of X-ray absorbing gas and the maximum velocity that can be attained by the ultraviolet BAL wind.
Generically, the terminal velocity of outflowing material is set to some extent by the launching radius (e.g., Chartas et al. 2003 and references therein). Gas launched from smaller radii must attain higher velocities in order to escape from the vicinity of the black hole; this material is also exposed to higher photon densities. We speculate that the thickness of the X-ray absorber (with more negative values of indicating larger X-ray opacities) determines the innermost radius from which the BAL wind could potentially be launched; thus, without a very thick shield, material at smaller radii will be too ionized by soft X-rays to be driven effectively by ultraviolet line pressure. This situation, where the amount of shielding affects the velocity of the outflow, is generally consistent with the models of Everett (2005) of accretion-disk winds driven by both magnetocentrifugal and radiative forces (J. Everett, 2005, priv. comm.). Note that this scenario would not apply to the relativistic X-ray BALs seen in a few objects (e.g., Chartas et al., 2003); such gas, inferred to be very highly ionized, is unlikely to be accelerated by ultraviolet-line pressure. The large scatter in corresponding to the most negative values may indicate that a thick absorber is a necessary but not sufficient condition for seeing high velocity outflows along the ultraviolet line of sight. Additional observations are certainly required to investigate this possibility.
More subtly, the lack of correlation of with DI (a proxy for the minimum velocity of absorption) implies that a straightforward transverse acceleration model for large inclination angles does not hold. As explained in Goodrich (1997), from pure orientation effects, larger column densities of gas (resulting in more negative values of ) would be expected along lines of sight skimming the disk. The wind seen through these observing angles would have a larger transverse velocity component from local radiation pressure initially acting primarily perpendicular to the accretion disk. After this initial launching stage, photons from the inner accretion disk accelerate the gas radially. The net result of this launching process would be lower line-of-sight onset velocities of absorption and thus smaller values of DI at large inclination angles. At smaller inclination angles where the line of sight intercepts the wind after it has been lifted from the disk, the outflow is more radial, and therefore DI would be larger. The lack of correlation found between DI and in our data does not support this simple picture with a wind geometry that ‘turns over’ (e.g., see Fig. 1 Murray et al. 1995). The more complex hydrodynamic wind models presented in Proga et al. (2000) and Proga & Kallman (2004) do not make specific predictions for the relationship between absorption onset velocity and X-ray absorption column density (D. Proga, 2005, priv. comm.), and so it is unclear if they are consistent with our result.
7. Conclusions and Summary
The sample of BAL quasars studied in this paper offers the advantages of being much larger and more homogeneous than those in earlier hard-band surveys. Specifically, our sample ranges over relatively narrow spans of both redshift () and ultraviolet luminosity (a factor of ). In addition, the utilization of ultraviolet spectroscopic data for all objects has enabled more specific quantitative comparisons between properties in different wavelength regimes than has been possible previously.
We briefly summarize our conclusions below:
-
1.
We confirm and extend previous work finding BAL quasars to be generally X-ray weak. However, from the days of ROSAT and ASCA, the detection fraction of BAL quasars has increased substantially. Of the 35 observed LBQS BAL quasars, 27 were detected for a detection fraction of 77%. Given the sensitivity of Chandra, meaningful upper limits on X-ray flux and have been set for those that were not detected.
-
2.
The distributions of and versus both support the hypothesis that X-ray weakness in BAL quasars arises from intrinsic absorption with column densities of (0.1–10) cm-2. Furthermore, the versus distribution is not consistent with simple neutral absorption and supports previous claims from X-ray spectroscopy for complex absorbers. Specifically, for a given , more soft photons are reaching the observer than would be expected with a simple neutral absorber, and partially covering and/or ionized absorbers can explain this. Even the BAL quasars with normal values in this sample show evidence from joint-spectral fitting for more moderate amounts of absorption, cm-2. The non-detected objects are candidates for Compton-thick X-ray obscuration.
-
3.
Three measures of the ultraviolet-absorber properties, BI, DI, and , are uncorrelated with the X-ray weakness in this sample. This lack of a straightforward relationship between the ultraviolet and X-ray absorption as characterized by these parameters is difficult to account for with a single absorbing structure that obscures the ultraviolet and X-ray continuum in the same manner. Furthermore, the lack of correlation of DI and is inconsistent with predictions from disk-wind models with a significant transverse velocity component at large inclination angles. A fourth property, , is correlated with at the level. Though this correlation requires confirmation with larger sample sizes, it is nonetheless evident that the BAL quasars with the largest outflow velocities are typically X-ray weakest. This plausibly implies that very thick X-ray absorption is required to achieve the highest outflow velocities seen in the ultraviolet, a natural consequence of a radiatively driven disk-wind model that requires shielding to prevent overionization of the wind.
-
4.
The large fraction of non-X-ray detected LoBAL quasars, 80%, and their average value of –0.9 estimated from stacking analysis, point toward extreme X-ray absorption in this subset of BAL quasars. The LoBAL quasar Mrk 231 is already known to show spectroscopic evidence for Compton-thick X-ray absorption, and this appears to be typical of the class. In fact, it may be the case that (near) Compton-thick absorption is a prerequisite for seeing Mg II BALs along the line of sight to the observer. Given these extreme X-ray and ultraviolet absorption properties, it is important to differentiate the samples of low and high-ionization BAL quasars when trying to generalize about the population of BAL quasars as a whole.
In the near future, the X-ray brightest BAL quasars in this sample are viable candidates for spectroscopy with XMM-Newton for further investigation into the nature of their X-ray absorption. In particular, those with Chandra count rates ct s-1 will provide –3000 EPIC counts in 40–60 ks observations. However, the three objects meeting this criterion are a small fraction of the total sample, and so systematic follow-up will likely require the next generation of large effective area X-ray observatories.
Though it is probably not the case for the majority of BAL quasars, in the X-ray brightest BAL quasars the ultraviolet and X-ray absorbers may be identical. These objects will be excellent candidates for high resolution X-ray spectroscopy with the next generation of X-ray observatories to compare the ionization and velocity structure of the ultraviolet and X-ray absorbing gas. However, it is clear that they are not representative of the class as a whole. For the more typical objects, specific models of the profiles of X-ray absorption lines compared to ultraviolet absorption-line profiles will provide important predictions for future high-throughput spectroscopic missions.
References
- Aldcroft & Green (2003) Aldcroft, T. L. & Green, P. J. 2003, ApJ, 592, 710
- Arav et al. (2001) Arav, N., et al. 2001, ApJ, 561, 118
- Arnaud (1996) Arnaud, K. A. 1996, in ASP Conf. Ser. 101: Astronomical Data Analysis Software and Systems V, eds. G. Jacoby & J. Barnes, vol. 5, 17
- Avni & Tananbaum (1986) Avni, Y. & Tananbaum, H. 1986, ApJ, 305, 83
- Bauer et al. (2004) Bauer, F. E., Alexander, D. M., Brandt, W. N., Schneider, D. P., Treister, E., Hornschemeier, A. E., & Garmire, G. P. 2004, AJ, 128, 2048
- Braito et al. (2004) Braito, V., et al. 2004, A&A, 420, 79
- Brandt et al. (2000) Brandt, W. N., Laor, A., & Wills, B. J. 2000, ApJ, 528, 637 (BLW)z
- Brandt et al. (2001) Brandt, W. N., et al. 2001, AJ, 122, 1
- Cash (1979) Cash, W. 1979, ApJ, 228, 939
- Chartas et al. (2003) Chartas, G., Brandt, W. N., & Gallagher, S. C. 2003, ApJ, 595, 85
- Chartas et al. (2002) Chartas, G., Brandt, W. N., Gallagher, S. C., & Garmire, G. P. 2002, ApJ, 579, 169
- Condon et al. (1998) Condon, J. J., Cotton, W. D., Greisen, E. W., Yin, Q. F., Perley, R. A., Taylor, G. B., & Broderick, J. J. 1998, AJ, 115, 1693
- Cristiani & Vio (1990) Cristiani, S. & Vio, R. 1990, A&A, 227, 385
- Dickey & Lockman (1990) Dickey, J. M. & Lockman, F. J. 1990, ARA&A, 28, 215
- Everett (2005) Everett, J. E. 2005, ApJ, 631, 689
- Feigelson & Nelson (1985) Feigelson, E. D. & Nelson, P. I. 1985, ApJ, 293, 192
- Fitzpatrick & Massa (1999) Fitzpatrick, E. L., & Massa, D. 1999, ApJ, 525, 1011
- Freeman et al. (2002) Freeman, P. E., Kashyap, V., Rosner, R., & Lamb, D. Q. 2002, ApJS, 138, 185
- Gallagher et al. (2002) Gallagher, S. C., Brandt, W. N., Chartas, G., & Garmire, G. P. 2002, ApJ, 567, 37
- Gallagher et al. (2001) Gallagher, S. C., Brandt, W. N., Laor, A., Elvis, M., Mathur, S., Wills, B. J., & Iyomoto, N. 2001, ApJ, 546, 795
- Gallagher et al. (1999) Gallagher, S. C., Brandt, W. N., Sambruna, R. M., Mathur, S., & Yamasaki, N. 1999, ApJ, 519, 549
- Gallagher et al. (2004) Gallagher, S. C., Brandt, W. N., Wills, B. J., Charlton, J. C., Chartas, G., & Laor, A. 2004, ApJ, 603, 425
- Gallagher et al. (2005) Gallagher, S. C., Richards, G. T., Hall, P. B., Brandt, W. N., Schneider, D. P., & Vanden Berk, D. E. 2005, AJ, 129, 567
- Garmire et al. (2003) Garmire, G. P., Bautz, M. W., Ford, P. G., Nousek, J. A., & Ricker, G. R. 2003, in Proc. SPIE Vol. 4851: X-Ray and Gamma-Ray Telescopes and Instruments for Astronomy, eds. J. E. Trümper & H. D. Tananbaum, 28–44
- Gehrels (1986) Gehrels, N. 1986, ApJ, 303, 336
- George et al. (2000) George, I. M., Turner, T. J., Yaqoob, T., Netzer, H., Laor, A., Mushotzky, R. F., Nandra, K., & Takahashi, T. 2000, ApJ, 531, 52
- Goodrich (1997) Goodrich, R. W. 1997, ApJ, 474, 606
- Green et al. (2001) Green, P. J., Aldcroft, T. L., Mathur, S., Wilkes, B. J., & Elvis, M. 2001, ApJ, 558, 109
- Green & Mathur (1996) Green, P. J. & Mathur, S. 1996, ApJ, 462, 637
- Green et al. (1995) Green, P. J., et al. 1995, ApJ, 450, 51
- Grupe et al. (2003) Grupe, D., Mathur, S., & Elvis, M. 2003, AJ, 126, 1159
- Hamann et al. (1993) Hamann, F., Korista, K. T., & Morris, S. L. 1993, ApJ, 415, 541
- Hewett & Foltz (2003) Hewett, P. C. & Foltz, C. B. 2003, AJ, 125, 1784
- Hewett et al. (1995) Hewett, P. C., Foltz, C. B., & Chaffee, F. H. 1995, AJ, 109, 1498
- Hewett et al. (2001) — 2001, AJ, 122, 518
- Isobe et al. (1986) Isobe, T., Feigelson, E. D., & Nelson, P. I. 1986, ApJ, 306, 490
- Ivezić et al. (2002) Ivezić, Ž., et al. 2002, AJ, 124, 2364
- Königl & Kartje (1994) Königl, A. & Kartje, J. F. 1994, ApJ, 434, 446
- Kopko et al. (1994) Kopko, M., Turnshek, D. A., & Espey, B. R. 1994, in IAU Symp. 159: Multi-Wavelength Continuum Emission of AGN, eds. T. Courvoisier & A. Blecha, vol. 159 (Dordrecht: Kluwer), 450
- Korista et al. (1993) Korista, K. T., Voit, G. M., Morris, S. L., & Weymann, R. J. 1993, ApJS, 88, 357, (KVMW)
- Kraft et al. (1991) Kraft, R. P., Burrows, D. N., & Nousek, J. A. 1991, ApJ, 374, 344
- La Valley et al. (1992) La Valley, M., Isobe, T., & Feigelson, E. 1992, in ASP Conf. Ser. 25: Astronomical Data Analysis Software and Systems I, eds. D. M. Worrall, C. Biemesderfer, & J. Barnes, vol. 1, 245
- Lamy & Hutsemékers (2004) Lamy, H. & Hutsemékers, D. 2004, A&A, 427, 107
- Laor & Brandt (2002) Laor, A. & Brandt, W. N. 2002, ApJ, 569, 641
- Lyons (1991) Lyons, L. 1991, Data Analysis for Physical Science Students (Cambridge: Cambridge University Press)
- Marshall et al. (2004) Marshall, H. L., Tennant, A., Grant, C. E., Hitchcock, A. P., O’Dell, S. L., & Plucinsky, P. P. 2004, in X-Ray and Gamma-Ray Instrumentation for Astronomy XIII., Proceedings of the SPIE, Volume 5165, 497–508
- Mathur et al. (2000) Mathur, S., et al. 2000, ApJ, 533, L79
- Morris et al. (1991) Morris, S. L., Weymann, R. J., Anderson, S. F., Hewett, P. C., Francis, P. J., Foltz, C. B., Chaffee, F. H., & MacAlpine, G. M. 1991, AJ, 102, 1627
- Murray et al. (1995) Murray, N., Chiang, J., Grossman, S. A., & Voit, G. M. 1995, ApJ, 451, 498, (MCGV)
- Ogle et al. (1999) Ogle, P. M., Cohen, M. H., Miller, J. S., Tran, H. D., Goodrich, R. W., & Martel, A. R. 1999, ApJS, 125, 1
- Page et al. (2005) Page, K. L., Reeves, J. N., O’Brien, P. T., & Turner, M. J. L. 2005, MNRAS, 898
- Press et al. (1997) Press, W. H., Teukolsky, S. A., Vetterling, W. T., & Flannery, B. P. 1997, Numerical Recipes in C: The Art of Scientific Computing, 2nd ed. (Cambridge: Cambridge University Press)
- Proga & Kallman (2004) Proga, D. & Kallman, T. R. 2004, ApJ, 616, 688
- Proga et al. (2000) Proga, D., Stone, J. M., & Kallman, T. R. 2000, ApJ, 543, 686
- Reeves & Turner (2000) Reeves, J. N. & Turner, M. J. L. 2000, MNRAS, 316, 234
- Reichard et al. (2003) Reichard, T. A., et al. 2003, AJ, 126, 2594
- Richards et al. (2002) Richards, G. T., Vanden Berk, D. E., Reichard, T. A., Hall, P. B., Schneider, D. P., SubbaRao, M., Thakar, A. R., & York, D. G. 2002, AJ, 124, 1
- Sabra & Hamann (2001) Sabra, B. M. & Hamann, F. 2001, ApJ, 563, 555
- Schmidt & Green (1983) Schmidt, M. & Green, R. F. 1983, ApJ, 269, 352
- Shemmer et al. (2005) Shemmer, O., Brandt, W., Gallagher, S., Vignali, C., Boller, T., Chartas, G., & Comastri, A. 2005, AJ, in press, astro-ph/0509146
- Sirola et al. (1998) Sirola, C. J., et al. 1998, ApJ, 495, 659
- Sprayberry & Foltz (1992) Sprayberry, D. & Foltz, C. B. 1992, ApJ, 390, 39
- Stocke et al. (1992) Stocke, J. T., Morris, S. L., Weymann, R. J., & Foltz, C. B. 1992, ApJ, 396, 487
- Strateva et al. (2005) Strateva, I. V., Brandt, W. N., Schneider, D. P., Vanden Berk, D. G., & Vignali, C. 2005, AJ, 130, 387
- Tananbaum et al. (1979) Tananbaum, H., et al. 1979, ApJ, 234, L9
- Vanden Berk et al. (2001) Vanden Berk, D. E., et al. 2001, AJ, 122, 549
- Vignali et al. (2003) Vignali, C., Brandt, W. N., & Schneider, D. P. 2003, AJ, 125, 433
- Weisskopf et al. (2002) Weisskopf, M. C., Brinkman, B., Canizares, C., Garmire, G., Murray, S., & Van Speybroeck, L. P. 2002, PASP, 114, 1
- Weymann et al. (1991) Weymann, R. J., Morris, S. L., Foltz, C. B., & Hewett, P. C. 1991, ApJ, 373, 23, (WMHF)
- White et al. (1997) White, R. L., Becker, R. H., Helfand, D. J., & Gregg, M. D. 1997, ApJ, 475, 479
- Wilkes et al. (1994) Wilkes, B. J., Tananbaum, H., Worrall, D. M., Avni, Y., Oey, M. S., & Flanagan, J. 1994, ApJS, 92, 53
- York et al. (2000) York, D. G., et al. 2000, AJ, 120, 1579
| Name | aa The listed values of and are taken from Hewett et al. (1995). b The mean rest-frame Å flux density ( erg cm-2 s-1 Å-1) measured from spectra normalized to the SDSS (when available) or LBQS photometry. cThe spectral index of a power-law fit to the UV continuum where . dThe values for (in units of 1020 cm-2) are from Galactic H I maps (Dickey & Lockman, 1990). eThe BALnicity Index (BI; as defined by Weymann et al. 1991) is a conservative measure of the C IV EWa. Values from Hewett & Foltz (2003). fThe maximum velocity of C IV absorption blueshift (including the relativistic correction), . gThe parameter is the fraction of C IV absorption that absorbs of the continuum. hKey: From the classification of Lamy & Hutsemékers (2004): Hi = UV spectra show only high ionization BALs; Lo = UV spectra also show either Al III and/or Mg II BALs; ? = BAL type unknown because available UV spectra do not cover Mg II region. iRadio-to-optical flux ratios, as defined in §2. Values marked with ‘i’ use rather than . jReferences to available data on these quasars. Key: G = included in the Chandra survey of Green et al. (2001); K = Korista et al. (1993); LBQS = LBQS discovery spectra were used to measure absorption-line and continuum parameters (Hewett et al., 1995); LH = Lamy & Hutsemékers (2004); S = Sirola et al. (1998); SDSS(sp) = photometry available from the Sloan Digital Sky Survey (spectra available in Data Release 4); and W = Weymann et al. (1991). kB00100012 has broad absorption evident in the LBQS and SDSS spectra, however, it does not meet the BAL quasar criterion of Weymann et al. (1991) of BI. Therefore, we present the X-ray data for the record, but do not include this object in the formal LBQS BAL quasar sample. | aa The listed values of and are taken from Hewett et al. (1995). b The mean rest-frame Å flux density ( erg cm-2 s-1 Å-1) measured from spectra normalized to the SDSS (when available) or LBQS photometry. cThe spectral index of a power-law fit to the UV continuum where . dThe values for (in units of 1020 cm-2) are from Galactic H I maps (Dickey & Lockman, 1990). eThe BALnicity Index (BI; as defined by Weymann et al. 1991) is a conservative measure of the C IV EWa. Values from Hewett & Foltz (2003). fThe maximum velocity of C IV absorption blueshift (including the relativistic correction), . gThe parameter is the fraction of C IV absorption that absorbs of the continuum. hKey: From the classification of Lamy & Hutsemékers (2004): Hi = UV spectra show only high ionization BALs; Lo = UV spectra also show either Al III and/or Mg II BALs; ? = BAL type unknown because available UV spectra do not cover Mg II region. iRadio-to-optical flux ratios, as defined in §2. Values marked with ‘i’ use rather than . jReferences to available data on these quasars. Key: G = included in the Chandra survey of Green et al. (2001); K = Korista et al. (1993); LBQS = LBQS discovery spectra were used to measure absorption-line and continuum parameters (Hewett et al., 1995); LH = Lamy & Hutsemékers (2004); S = Sirola et al. (1998); SDSS(sp) = photometry available from the Sloan Digital Sky Survey (spectra available in Data Release 4); and W = Weymann et al. (1991). kB00100012 has broad absorption evident in the LBQS and SDSS spectra, however, it does not meet the BAL quasar criterion of Weymann et al. (1991) of BI. Therefore, we present the X-ray data for the record, but do not include this object in the formal LBQS BAL quasar sample. | bbDetections for the full, soft, and hard bands are determined by wavdetect, and the counts are determined from aperture photometry (as described in §3). Errors are 1 Poisson errors (Gehrels, 1986), except for non-detections where the limits are the confidence limits from Bayesian statistics (Kraft et al., 1991). The count rate is for the full band, 0.5–8.0 keV. | ccThe HR is defined as , where and are the counts in the hard (2.0–8.0 keV) and soft (0.5–2.0 keV) bands, respectively. The HR errors are propagated from the counting errors using the numerical method of Lyons (1991). | ddX-ray and optical flux densities were measured at rest-frame 2 keV and 2500 Å, respectively; units are erg cm-2 s-1 Hz-1. | BIeeThe 2500 Å monochromatic luminosity, , has units of erg s-1 Hz-1. The redshift bandpass correction has been included. | C IV EWa | ffThe parameter is the difference between the observed and , the predicted from calculated from Equation 6 of Strateva et al. (2005). | ggThe parameter is calculated assuming and using the hard-band count rate to normalize the X-ray continuum. | BAL | iifootnotemark: | Notesjjfootnotemark: |
|---|---|---|---|---|---|---|---|---|---|---|---|---|
| (LBQS B) | () | ( cm-2) | ( km s-1) | (Å) | ( km s-1) | Typehh=–. | ||||||
| 00040147 | 1.710 | 18.13 | 24.7 | 3.01 | 255 | 16.2 | 0.13 | Lo | / | K,S,LH | ||
| 00190107 | 2.130 | 18.09 | 19.2 | 3.22 | 2305 | 23.9 | 13849 | 0.44 | Hi | / | K,W,S,LH,H | |
| 00210213 | 2.293 | 18.68 | 10.3 | 2.95 | 5179 | 40.2 | 20138 | 0.51 | Hi | / | K,W,S,LH,H | |
| 00250151 | 2.076 | 18.06 | 19.3 | 2.85 | 2878 | 32.0 | 21765 | 0.15 | Hi | / | K,W,S,LH,H | |
| 00290017 | 2.253 | 18.64 | 8.7 | 2.40 | 5263 | 33.6 | 12267 | 0.53 | Hi | / | K,W,SDSS,S,LH,H | |
| 00510019 | 1.713 | 18.67 | 15.1 | 3.22 | 3244 | 46.3 | 22113 | 0.53 | Hi | / | K,SDSS(sp),LH | |
| 00540200 | 1.872 | 18.41 | 16.6 | 3.11 | 498 | 22.7 | 10970 | 0.23 | Hi | /iifootnotemark: | K,LH | |
| 00592735 | 1.593 | 18.13 | 35.9 | 1.99 | 11053 | 77.5 | 20427 | 0.81 | Lo | / | K,W,S,LH,H,G | |
| 01090128 | 1.758 | 18.32 | 17.1 | 4.07 | 399 | 35.3 | 18794 | 0.25 | Hi | / | SDSS(sp),LH | |
| 10290125 | 2.029 | 18.43 | 17.9 | 4.80 | 1848 | 26.8 | 17685 | 0.43 | Hi | / | K,W,S,LH,H | |
| 11330214 | 1.468 | 18.38 | 22.6 | 2.61 | 1950 | 22.5 | 21547 | 0.00 | Hi | / | SDSS(sp),LBQS | |
| 12031530 | 1.628 | 18.70 | 11.7 | 2.80 | 1517 | 25.4 | 11702 | 0.04 | Hi | / | SDSS,LH,LBQS | |
| 12051436 | 1.643 | 18.38 | 17.0 | 2.59 | 788 | 20.6 | 7947 | 0.18 | Hi | / | K,W,SDSS,S,LH,H | |
| 12081535 | 1.961 | 17.93 | 13.5 | 2.67 | 4545 | 29.9 | 20325 | 0.20 | Hi | / | K,W,SDSS,S,LH,H | |
| 12121445 | 1.627 | 17.87 | 31.0 | 2.69 | 3618 | 38.8 | 19368 | 0.20 | Hi | / | K,W,SDSS,S,LH,H | |
| 12161103 | 1.620 | 18.28 | 22.9 | 2.15 | 4791 | 33.3 | 12076 | 0.67 | Hi | / | K,W,SDSS(sp),S,LH,H | |
| 12301705 | 1.420 | 18.44 | 15.7 | 2.26 | 2945 | 34.9 | 21617 | 0.18 | Hi | / | S,LH,LBQS | |
| 12311320 | 2.380 | 18.84 | 26.1 | 1.86 | 3473 | 22.1 | 0.09 | Lo | / | K,W,SDSS,S,LH,H | ||
| 12350857 | 2.898 | 18.17 | 21.0 | 1.68 | 815 | 23.3 | 5339 | 0.69 | ? | / | K,W,SDSS,S,LH,H | |
| 12351453 | 2.699 | 18.56 | 5.2 | 2.37 | 2657 | 19.3 | 14414 | 0.45 | ? | / | K,W,SDSS,S,LH,H | |
| 12390955 | 2.013 | 18.38 | 18.6 | 1.66 | 708 | 13.9 | 12355 | 0.38 | Hi | / | K,SDSS,S,LH,H | |
| 12401607 | 2.360 | 18.84 | 8.9 | 2.16 | 2867 | 32.9 | 12568 | 0.32 | Hi | / | K,W,SDSS,S,LH,H | |
| 12430121 | 2.796 | 18.50 | 14.4 | 1.76 | 5953 | 42.1 | 20718 | 0.47 | ? | / | K,W,SDSS(sp),S,LH,H | |
| 13140116 | 2.686 | 18.65 | 10.0 | 1.98 | 2626 | 23.3 | 14210 | 0.23 | ? | / | K,W,SDSS(sp),S,LH,H | |
| 13310108 | 1.881 | 17.87 | 38.2 | 2.22 | 7911 | 50.3 | 18811 | 0.45 | Lo | / | K,W,SDSS(sp),S,LH,H | |
| 14420011 | 2.226 | 18.24 | 15.9 | 3.58 | 5142 | 39.1 | 22834 | 0.39 | Hi | / | K,W,SDSS,S,LH,H | |
| 14430141 | 2.451 | 18.20 | 9.2 | 3.36 | 7967 | 44.0 | 0.36 | ? | / | K,W,SDSS,S,LH,H | ||
| 21114335 | 1.708 | 16.68 | 66.4 | 4.19 | 7249 | 50.2 | 15322 | 0.51 | Hi | / | LBQS | |
| 21164439 | 1.480 | 17.68 | 41.0 | 3.83 | 2594 | 30.2 | 24906 | 0.25 | Hi | / | LH,LBQS | |
| 21404552 | 1.688 | 18.30 | 20.7 | 2.54 | 1410 | 31.8 | 18944 | 0.23 | Hi | / | LBQS | |
| 21542005 | 2.035 | 18.12 | 15.1 | 2.69 | 962 | 14.9 | 20019 | 0.00 | Hi | / | K,W,LH,H | |
| 22011834 | 1.814 | 17.81 | 56.9 | 2.85 | 1612 | 27.3 | 19682 | 0.00 | Hi | / | K,W,S,LH,H | |
| 22111915 | 1.952 | 18.02 | 28.0 | 2.30 | 27 | 7.8 | 11544 | 0.00 | Hi | /2.11iifootnotemark: | W,LBQS | |
| 23500045A | 1.624 | 18.63 | 13.5 | 3.12 | 6964 | 44.5 | 24718 | 0.57 | Lo | / | K,W,SDSS(sp),S,LH,H | |
| 23580216 | 1.872 | 18.61 | 33.7 | 3.28 | 6283 | 48.6 | 23913 | 0.28 | Lo | /iifootnotemark: | K,LH | |
| 00100012kkfootnotemark: | 2.145 | 18.46 | 7.3 | 3.07 | 0 | 2.8 | 14157 | 0.12 | / | W,SDSS(sp),S |
| NameaaKnown LoBAL quasars are indicated with ‘(Lo)’ following their names. | Obs. ID | Date | Exposure | CountsbbDetections for the full, soft, and hard bands are determined by wavdetect, and the counts are determined from aperture photometry (as described in §3). Errors are 1 Poisson errors (Gehrels, 1986), except for non-detections where the limits are the confidence limits from Bayesian statistics (Kraft et al., 1991). The count rate is for the full band, 0.5–8.0 keV. | Count RatebbDetections for the full, soft, and hard bands are determined by wavdetect, and the counts are determined from aperture photometry (as described in §3). Errors are 1 Poisson errors (Gehrels, 1986), except for non-detections where the limits are the confidence limits from Bayesian statistics (Kraft et al., 1991). The count rate is for the full band, 0.5–8.0 keV. | HRccThe HR is defined as , where and are the counts in the hard (2.0–8.0 keV) and soft (0.5–2.0 keV) bands, respectively. The HR errors are propagated from the counting errors using the numerical method of Lyons (1991). | |
|---|---|---|---|---|---|---|---|
| (LBQS B) | Time (ks) | Soft | Hard | (10-3 ct s-1) | |||
| 00040147(Lo) | 4828 | 2003 Nov 09 | 5.54 | ||||
| 00190107 | 2098 | 2001 Dec 08 | 4.80 | 7 | 6 | 2.50 | |
| 00210213 | 2099 | 2001 Aug 20 | 6.75 | 3 | 0.59 | ||
| 00250151 | 2100 | 2001 Oct 31 | 4.69 | 4 | 1.28 | ||
| 00290017 | 2101 | 2001 Jun 20 | 6.69 | 32 | 10 | 6.28 | |
| 00510019 | 4830 | 2004 Aug 05 | 7.11 | 18 | 9 | 3.80 | |
| 00540200 | 4831 | 2004 Aug 17 | 5.88 | 8 | 7 | 2.55 | |
| 00592735(Lo) | 813 | 2000 May 15 | 4.39 | ||||
| 01090128 | 4832 | 2004 Nov 04 | 5.88 | 7 | 1.53 | ||
| 10290125 | 2102 | 2001 May 30 | 4.50 | 7 | 4 | 2.44 | |
| 11330214 | 4833 | 2004 Feb 13 | 5.91 | 12 | 2.37 | ||
| 12031530 | 4834 | 2005 Feb 05 | 7.06 | 3 | 0.57 | ||
| 12051436 | 2103 | 2002 Mar 08 | 5.69 | 62 | 17 | 13.89 | |
| 12081535 | 2104 | 2002 Mar 08 | 4.90 | 4 | 2 | 1.23 | |
| 12121445 | 2456 | 2001 May 30 | 4.50 | ||||
| 12161103 | 2106 | 2001 Mar 18 | 4.64 | 5 | 1.29 | ||
| 12301705 | 4835 | 2004 Feb 04 | 6.10 | 6 | 1.31 | ||
| 12311320(Lo) | 2107 | 2001 Aug 07 | 6.71 | ||||
| 12350857 | 2108 | 2001 Mar 18 | 5.63 | 60 | 22 | 14.57 | |
| 12351453 | 2972 | 2002 Nov 17 | 6.65 | 2 | 0.60 | ||
| 12390955 | 2109 | 2001 Jul 25 | 5.16 | 10 | 7 | 3.29 | |
| 12401607 | 2973 | 2002 Nov 16 | 6.65 | 4 | 3 | 1.05 | |
| 12430121 | 2974 | 2002 May 03 | 6.67 | 6 | 4 | 1.50 | |
| 13140116 | 2975 | 2002 Jul 21 | 6.57 | 2 | 0.61 | ||
| 13310108(Lo) | 2110 | 2001 Mar 18 | 5.06 | 3 | 3 | 1.19 | |
| 14420011 | 2111 | 2001 May 30 | 4.28 | ||||
| 14430141 | 2112 | 2001 Mar 23 | 5.94 | 6 | 1.18 | ||
| 21114335 | 4838 | 2003 Dec 16 | 5.53 | 15 | 17 | 5.79 | |
| 21164439 | 4839 | 2004 Jun 21 | 5.65 | 3 | 0.53 | ||
| 21404552 | 4840 | 2004 Mar 25 | 5.68 | 9 | 4 | 2.29 | |
| 21542005 | 2113 | 2001 Sep 04 | 5.00 | 9 | 9 | 3.60 | |
| 22011834 | 2114 | 2001 Aug 03 | 5.08 | ||||
| 22111915 | 4836 | 2003 Nov 19 | 5.89 | 39 | 16 | 9.34 | |
| 23500045A(Lo) | 2115 | 2002 May 16 | 5.78 | ||||
| 23580216(Lo) | 4837 | 2004 Jul 18 | 5.79 | ||||
| 00100012 | 4829 | 2004 Jun 27 | 6.66 | 13 | 3 | 2.40 | |
| NameaaKnown LoBAL quasars are indicated with ‘(Lo)’ following their names. | bb is a coarse measure of the hardness of the X-ray spectrum determined by comparing the observed HR (see Table 2) to a simulated HR that takes into account spatial and temporal variations in the instrument response (see 3). | ccThe full-band X-ray flux, , has units of erg cm-2 s-1 and is calculated by integrating the power-law spectrum with and normalized by the full-band count rate from 0.5–8.0 keV. The errors are derived from the 1 errors in the full-band count rate. For calculating upper limits to and from non-detections, was set to 1.0. | ddX-ray and optical flux densities were measured at rest-frame 2 keV and 2500 Å, respectively; units are erg cm-2 s-1 Hz-1. | ddX-ray and optical flux densities were measured at rest-frame 2 keV and 2500 Å, respectively; units are erg cm-2 s-1 Hz-1. | eeThe 2500 Å monochromatic luminosity, , has units of erg s-1 Hz-1. The redshift bandpass correction has been included. | ffThe parameter is the difference between the observed and , the predicted from calculated from Equation 6 of Strateva et al. (2005). | ggThe parameter is calculated assuming and using the hard-band count rate to normalize the X-ray continuum. | hh=–. | |
|---|---|---|---|---|---|---|---|---|---|
| (LBQS B) | |||||||||
| 00040147(Lo) | 31.440 | ||||||||
| 00190107 | 0.68 | 31.627 | |||||||
| 00210213 | 31.458 | ||||||||
| 00250151 | 31.593 | ||||||||
| 00290017 | 1.52 | 31.357 | |||||||
| 00510019 | 1.13 | 31.227 | |||||||
| 00540200 | 0.67 | 31.389 | |||||||
| 00592735(Lo) | 31.507 | ||||||||
| 01090128 | 31.316 | ||||||||
| 10290125 | 1.02 | 31.529 | |||||||
| 11330214 | 31.198 | ||||||||
| 12031530 | 31.049 | ||||||||
| 12051436 | 1.65 | 31.225 | |||||||
| 12081535 | 1.13 | 31.360 | |||||||
| 12121445 | 31.471 | ||||||||
| 12161103 | 31.334 | ||||||||
| 12301705 | 30.994 | ||||||||
| 12311320(Lo) | 31.910 | ||||||||
| 12350857 | 1.40 | 32.085 | |||||||
| 12351453 | 31.382 | ||||||||
| 12390955 | 0.85 | 31.535 | |||||||
| 12401607 | 0.78 | 31.434 | |||||||
| 12430121 | 0.88 | 31.873 | |||||||
| 13140116 | 31.659 | ||||||||
| 13310108(Lo) | 0.54 | 31.757 | |||||||
| 14420011 | 31.604 | ||||||||
| 14430141 | 31.496 | ||||||||
| 21114335 | 0.43 | 31.867 | |||||||
| 21164439 | 31.467 | ||||||||
| 21404552 | 1.23 | 31.346 | |||||||
| 21542005 | 0.54 | 31.460 | |||||||
| 22011834 | 31.881 | ||||||||
| 22111915 | 1.32 | 31.672 | |||||||
| 23500045A(Lo) | 31.108 | ||||||||
| 23580216(Lo) | 31.696 | ||||||||
| 00100012 | 1.80 | 31.218 |
| Percentile | |||||||
|---|---|---|---|---|---|---|---|
| All | HiBALs | All | HiBALs | SDSSbbThe ‘SDSS’ column heading refers to the sample from Strateva et al. (2005) presented in Figure 2. | All | HiBALs | |
| 25% | |||||||
| 50% | |||||||
| 75% | |||||||
| Median | |||||||
| Mean | |||||||
| VariablesbbThe number of data points is given in parentheses. | Generalized Kendall | Spearman | ||
|---|---|---|---|---|
| Independent/Dependent | Prob.ccThe probability that the given variables are not correlated. Spearman’s cannot be calculated for data with both upper and lower limits, such as . | Prob.ccThe probability that the given variables are not correlated. Spearman’s cannot be calculated for data with both upper and lower limits, such as . | ||
| / (27) | 4.055 | 0.0001 | ||
| / (27) | 4.156 | |||
| BI/ (35) | 2.134 | 0.033 | 0.041 | |
| BI/ (HiBALs only – 24) | 1.582 | 0.114 | 0.111 | |
| DI/ (27) | 0.711 | 0.477 | 0.418 | |
| DI/ (HiBALs only – 17) | 0.418 | 0.676 | 0.643 | |
| / (35) | 2.924 | 0.003 | 0.003 | |
| / (35) | 2.876 | 0.004 | 0.003 | |
| / (HiBALs only – 24) | 1.883 | 0.060 | 0.052 | |
| / (35) | 0.102 | 0.918 | 0.935 | |
| / (HiBALs only – 24) | 0.050 | 0.960 | 0.998 | |
| / (35) | 1.213 | 0.225 | 0.206 | |
| / (HiBALs only – 24) | 0.126 | 0.900 | 0.887 | |
| / (35) | 0.284 | 0.776 | 0.951 | |
| / (HiBALs only – 24) | 0.248 | 0.804 | 0.809 | |
| C IV EWa/ (BQS – 41) | 4.816 | |||