On the Lack of a Soft X-Ray Excess from Clusters of Galaxies
Abstract
A soft X-ray excess has been claimed to exist in and around a number of galaxy clusters and this emission has been attributed to the warm-hot intergalactic medium that may constitute most of the baryons in the local universe. We have re-examined a study of the XMM-Newton observations on this topic by Kaastra et al. (2003) and find that the X-ray excess (or deficit) depends upon Galactic latitude and appears to be most closely related to the surface brightness of the 1/4 keV emission, which is largely due to emission from the Local hot bubble and the halo of the Milky Way. We suggest that the presence of the soft X-ray excess is due to incorrect subtraction of the soft X-ray background. An analysis is performed where we choose a 1/4 keV background that is similar to the background near the cluster (and for similar HI column). We find that the soft X-ray excess largely disappears using our background subtraction and conclude that these soft X-ray excesses are not associated with the target clusters. We also show that the detections of “redshifted” O VII lines claimed by Kaastra et al. (2003) are correlated with solar system charge exchange emission suggesting that they are not extragalactic either.
Subject headings:
X-rays: galaxies: clusters; methods: data analysis1. Introduction
Clusters of galaxies contain X-ray emitting hot gas (107-108 K) that accounts for of the total mass of the system and contains more baryons than the visible galaxies (Allen et al., 2002, 2003). There have been many studies of this hot gas as well as searches for other cooler gaseous components and other types of emission. Both excess absorption and emission have been claimed to be present in clusters, suggestive of material colder than the ambient hot cluster material, although these have been controversial issues. The claims about excess absorption arose from the Einstein Observatory SSS spectra (White et al. 1991), where the soft emission was less than would be expected from Galactic absorption of the free-free spectrum of a cluster. These SSS spectra had to be corrected for the buildup of ice in the optical path, so there was some concern that if the correction for ice was wrong, it might lead to the observed effect. This result was not confirmed with subsequent instruments, such as ROSAT (Arabadjis & Bregman, 2000) or XMM-Newton (Peterson et al., 2003), so we can safely conclude that the original study was incorrect and that there is no substantial absorbing medium.
Substantially more controversial is the subject of an additional emission component at soft X-ray energies (0.1-1 keV). For many clusters, it is claimed that the emission detected by the Extreme Ultraviolet Explorer (EUVE) and by four different X-ray telescopes cannot be explained by cluster free-free emission that is absorbed by cold Milky Way gas (e.g., Lieu et al. (1996, 1999, 2000); Durret et al. (2002); Kaastra et al. (2003), and references therein). They argue that the emission becomes more prominent with increasing radius from the cluster center relative to the harder emission of the cluster, and that the temperature of the emission is typically 0.1-0.3 keV. They interpret this emission as being either non thermal, due to cosmic rays in the cluster (Sarazin & Lieu, 1998) or thermal, due to gas at 1-3106 K (e.g., Kaastra et al. (2003)). If it is thermal, its mass may be comparable to that in the hotter ambient component, so it would have cosmological consequences.
However, these works have been criticized for several reasons. Berghöfer et al. (2000) (also, Bowyer et al. (2000), and references therein) argued that flat-fielding corrections were not properly applied to the EUVE data, and after making this correction, no excess emission is found, with the exception of the Coma cluster. The ROSAT data were examined by Arabadjis & Bregman (2000) who found that the cluster spectra could be fit with a hot free-free spectrum plus Galactic absorption and that no additional soft component was needed (except for the Coma cluster). The X-ray spectra from Beppo-SAX was investigated by Berghöfer & Bowyer (2002), following the study by Kaastra et al. (1999) that Abell 2199 contained a soft component. Using a different approach to the analysis, Berghöfer et al. (2000) found no evidence for an additional soft component either in Abell 2199, or in Abell 1795. The differences between these works and those of Lieu and collaborators have to do with the technical details of background subtraction and flat-fielding.
Recently, Kaastra et al. (2003) used XMM-Newton data to search for soft X-ray excess emission (0.2 keV) in a sample of 14 galaxies clusters. They find evidence for excess emission in the spectra of several of the clusters and they show that it is broadly extended across the clusters. They attribute this emission to the presence of hot gas in intercluster filaments that contain the Warm-Hot Intergalactic Medium (WHIM) near these clusters. The detection of the WHIM would be a major discovery and would be best accomplished with XMM due to its large collecting area. Therefore, we examine this result to understand if it is subject to the criticism that have been raised in other observations.

2. Determination of the Apparent Absorption Column
The data processing for the 14 clusters is straightforward and clearly explained by Kaastra et al. (2003) but there is a general problem that faces observers when the size of the extended source is comparable to the field of view. In that case, there may not be a “clean” area on the image that one can use for background subtraction. A common solution to this problem is to use the background from another field (or fields), scaled to the length of exposure for the relevant observation, and this is the approach of Kaastra et al. (2003). This approach works well for the high energy part of the spectrum (2-10 keV), which is due to the sum of many AGNs, and is nearly isotropic on the sky. However, the background at soft energies ( 1 keV) is due to the Milky Way and there is a strong latitude dependence, as well as prominent structures around the sky due to old supernova remnants. Kaastra recognizes the variation and adds it to the uncertainty in extracting a flux, but as we will show, there is a systematic effect with the background flux as a function of the soft X-ray background.
In the spectral analysis of the data, they fit a two-temperature model plus a column density and they compare the derived column density to the Galactic value. They show that ten of 14 galaxy clusters have a derived column that is below the Galactic 21 cm HI measurement in the same directions. The difference between the derived and Galactic columns are often much larger than the uncertainties involved, and in some cases, the derived column is consistent with zero. Such low derived columns are unphysical, so the authors argue that it is the spectrum that must be modified. Subsequently, they fix the Galactic 21 cm column and fit a two-temperature model, finding a significant component at lower temperature (0.2 keV) that is the soft excess component.
This same effect could occur if the Galactic soft X-ray background toward the cluster was larger than the value of the mean background field that they used. Then, the soft component of the background would not be fully subtracted, leaving an apparent excess to the X-ray emission. To test this possibility, we compare the fractional excess or deficit in the derived absorption column with both the local value of the Galactic soft X-ray background (R12) and with the Galactic latitude, as the soft X-ray background is brighter toward the poles.
We calculate the fractional difference as fN = (NX-N21cm)/N21cm, where NX is the absorption column density derived from X-ray fitting (given in Table 2 of Kaastra et al. 2003) and N21cm is the Galactic 21 cm column. First, we compare this quantity to the Galactic latitude (Fig. 1: Left panel), which appears to show a correlation in the sense that the higher latitude sources have preferentially low values of NX relative to N21cm. The correlation coefficient for this relationship is -0.65, which is significant at the 99% level for 14 data points.
A similar and possibly better relationship exists between fN and the soft X-ray background in the R12 band, based on the work of Snowden et al. (1997) and obtained through the tool from the High Energy Archive (HEASARC). Since some of the emission in this band may be due to the cluster under consideration, we obtained values for R12 from regions away from the cluster at constant Galactic latitude (except for the Virgo cluster, where we took backgrounds away and Coma, which we took away across the Galactic North pole) which corresponds to 19(z/0.05) Mpc from the cluster (for Ho = 70 km sec-1 Mpc-1), about an order of magnitude larger than the virial radius of a typical cluster (2-3 Mpc). The resulting correlation between fN and R12 (Fig. 1: Right panel) appears to have less scatter than the correlation with latitude and the correlation coefficients is -0.73, corresponding to a significance for the relationship at the 99.7% confidence level (when we use the R12 flux with an offset of toward the Galactic equator, the significance is slightly higher, 99.9%) . These correlations suggest that the presence of a soft component, preferentially for the high-latitude sources, may be due, at least in part, to the subtraction of the background in the soft energy band. If correct, this might be evident from the positions of the clusters on the soft X-ray background.
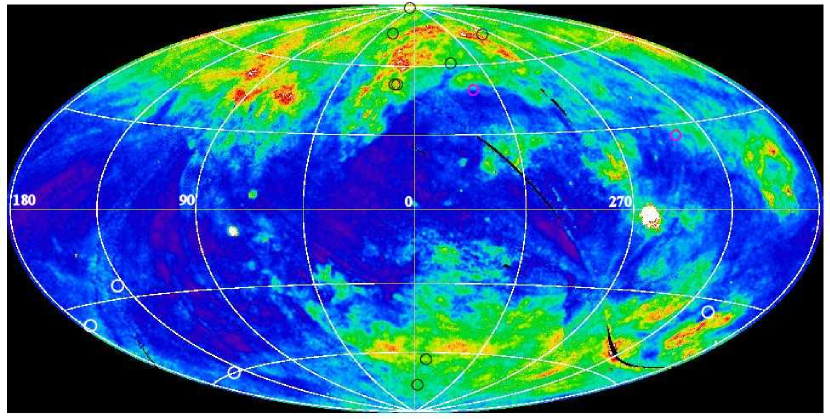
The all-sky 1/4 keV map (R12) has a great deal of structure due to well-known features, such as the North Polar Spur, and there is a brightening toward the poles due to the presence of a Galactic halo (0.1-0.2 keV) along with the Local Bubble of hot gas (0.1 keV), which is probably elongated toward high Galactic latitudes (Fig. 2). Upon this figure, we show clusters that have too little absorption (fN -0.3; the soft excess objects), excess absorption (fN 0.3), and those consistent with Galactic absorption. Most of the objects with fN -0.3 lie in regions of enhanced emission in the map and these regions are often part of larger structures. For example, MKW3s, Abell 2052, the Virgo cluster, Abell 1795, and Abell 1835 lie on or very close to the North Polar Spur, an old superbubble. The cluster Abell S1101 (also know as Sersic 159-03) lies on the edge of a large bright region toward the Southern Galactic Pole and Coma covers the North Galactic Pole, another large bright region (more on Coma below). In contrast, all four objects with fN 0.3 (excess absorption) lie in regions of low diffuse X-ray emission (Abell 496 is just a few degrees away from a bright ridge). One of these four objects, the NGC 533 cluster, is at high Galactic latitude () and with same 21 cm column as toward the high latitude sources MKW3s and Abell 2052 (b = ; both are excess emission objects), the primary difference being the values of the Galactic soft X-ray background.
| Cluster | OBSID | l | b | z | N21cm | R12 | Exp. |
|---|---|---|---|---|---|---|---|
| (deg.) | (deg.) | ( cm-2) | (ks) | ||||
| Abell 1795 | 0097820101 | 33.7876 | 77.1553 | 0.06248 | 1.17 | 1076.5 | 34.66 |
| Abell S1101 | 0123900101 | 348.3422 | -64.8125 | 0.05800 | 1.83 | 1031.8 | 27.90 |
| Abell 1835 | 0147330201 | 340.3759 | 60.5878 | 0.25320 | 2.28 | 1025.6 | 36.93 |
| MKW 3s | 0109930101 | 11.3938 | 49.4583 | 0.04500 | 3.04 | 1118.8 | 31.05 |
3. Consequences of Matched Background Subtraction
If the inference that the presence of the soft excess is related to the removal of the soft background is correct, then the soft excess should be reduced or vanish when a more appropriate background is used. The standard method used for background subtraction of clusters with XMM-Newton is to use a “blank sky” background created by taking a number of observations that do not contain extended sources or bright point sources, and stacking them together to obtain a mean background. Simple prepackaged backgrounds for the EPIC-pn and mos instruments have been produced by Lumb et al. (2002) and Read & Ponman (2003) have produced an extensive set of backgrounds for each combination of instrument mode and filter. However these are at best mean backgrounds, averaged across the sky, and are in reality the mean of a small number of biased sky positions whose relation to the real all-sky mean is undetermined. Since the low energy end of the X-ray background is the most spatially variable, due to the galactic background and absorption, the errors introduced by the use of these mean backgrounds will be largest at low energies.

A background drawn from “blank” fields with similar properties to those of the target cluster fields, rather than random ones, should match the cluster backgrounds much more closely. In order to test this we constructed “blank sky” backgrounds matched to properties of the individual cluster fields. The technique we used to accomplish this involves identifying three parameters that are likely to affect the observed background: N21cm, R12 and particle background. The R12 value was calculated from a mean of four points arranged around the cluster center at a distance of . For all the re-analyzed clusters the virial radius is less than so this should eliminate any possibility of contamination from cluster emission. “Blank sky” fields are then selected with N21cm and R12 values as close as possible to that of the cluster field to be matched. The event lists are broken into 50 second time blocks and a particle background calculated for each block using the flux measured in the 12-15 keV band. A minimization is then performed by removing (and adding) blocks from the pool until the mean values of the three parameters is as close as possible to the values of the parameters for the cluster field. A “blank sky” background is then constructed from the selected event list blocks. This background needs to have an exposure time significantly larger than that of the source to avoid degrading the data quality with extra noise.
One other problem with these stacked backgrounds is that the “blank” fields inevitably contain large numbers of point sources. Traditionally these are excised and large numbers of fields are stacked in order to reduce the effect of the missing data. However it should be noted that the effects of these excisions are clearly visible in images of prepackaged backgrounds. Since the number of “blank” fields available is much reduced when trying to match a background to a target observation, we instead mask out the regions containing point sources from the source and background when creating the spectra for fitting. In selecting “blank” fields to build a background there is a strong constraint that they need to be as free of point sources as possible so that as small an area of the cluster must be masked from the spectral fitting. These constraints combined with those of the background parameters (N21cm and R12) mean that selecting observations for use in the matched backgrounds is a complex process.
| Cluster | Abell 1795 | Abell S1101 | Abell 1835 | MKW 3s |
|---|---|---|---|---|
| OBSID: | 0020540401 | 0111550401 | 0106660101 | 0106660101 |
| 0032140101 | 0112630201 | 0106660201 | 0106660201 | |
| 0085170101 | 0128531401 | 0106660401 | 0106660401 | |
| 0111550401 | 0128531601 | 0106660601 | 0106660601 | |
| N21cm ( cm-2) | 1.16 | 1.82 | 2.32 | 2.32 |
| R12 ( s-1 arcmin-2) | 1050.6 | 1051.1 | 1011.7 | 1011.7 |
| Exposure (ks) | 101.5 | 145.0 | 192.6 | 124.5 |
We select four of the best candidates for a possible soft excess from Kaastra et al. (2003) to study the effects of using our matched background technique. The systems are Abell S1101 (also know as Sersic 159-03), Abell 1835, Abell 1795 and MKW 3s. The properties for these cluster fields are shown in Table 1. For each of these clusters either the data used by Kaastra et al. (2003), or longer exposures if available, were used. The data was reduced in the usual manner and cleaned by performing a iterative 3-sigma clipping on the 12-15 keV light-curve to remove periods of high particle background. Only EPIC-pn data was used since it is the instrument that receives the highest count rate and if the effect (soft excess) is not detectable in a single instrument then a detection using multiple instruments would not be reliable given the uncertainties in cross-calibration between instruments. Table 2 lists the observations used to construct the matched backgrounds and mean properties of the matched backgrounds. Spectra were extracted in annuli about the cluster centers with a minimum annulus size of 5 arcsec growing with radius to preserve the signal-to-noise. The latest EPIC-pn response files, released in May 2005, with improvements to the low energy response, were used for the analysis (see XMM-CCF-REL-189). Background spectra were extracted from identical regions of the matched “blank sky” background. The spectrum for each annulus was fitted using a single temperature MEKAL plasma plus photoelectric absorption model, using XSPEC, in order to obtain a measurement of the hydrogen column.
The results of fitting the hydrogen columns for the four clusters using the matched backgrounds are shown by the solid squares in Figure 3. The errors are 1-sigma. The results from Figure 1 of Kaastra et al. (2003) are overlayed as open circles. The dashed lines show the level of N21cm in each case. It can be seen that the values measured using the matched backgrounds are roughly consistent with the galactic N21cm value and are significantly above the values measure by Kaastra et al. (2003) using a mean “blank sky” background. Kaastra et al. (2003) interpret the significantly sub-galactic NH that they measure as due to excess soft emission offsetting the absorption. Our new analysis appears to validate the hypothesis that the soft excess is due to incomplete subtraction of the soft X-ray background since use of the matched backgrounds cause the NH discrepancy to disappear.
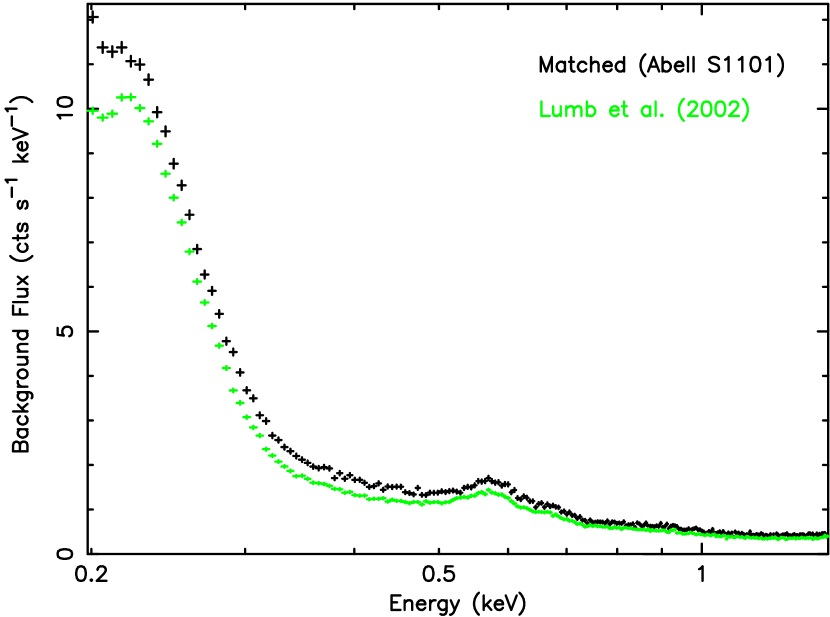
To illustrate the difference between our matched backgrounds and the mean background used by Kaastra et al. (2003) we plot the spectrum of the matched background for Abell S1101 along with the prepackaged background of Lumb et al. (2002) (Fig. 4). The backgrounds are scaled so that they have the same flux in the 12-15 keV band to account for differences in the particle background. It can be seen that the greatest difference in the backgrounds is at low energy, as expected, with the difference falling rapidly with increasing energy. This is due to the higher soft X-ray background in the fields used to construct our matched background (since Abell S1101 has a high R12 and low N21cm) compared to the fields used to construct the mean background of Lumb et al. (2002). If the mean background of Lumb et al. (2002) is used for background subtraction the soft background emission seen in Figure 4 will not be removed. This will result in an apparent soft excess in the final spectrum.
4. OVII emission
Kaastra et al. (2003) also report red-shifted O VII Kα lines from a number of clusters in their sample which would also be an indication for for the presence of cool gas. However for only two of the clusters is the result really significant, Abell 2052 (at the 99% confidence level) and MKW 3s (at the 91% confidence level), and this significance hangs of the assumption that the emission is dominated by the 574 eV resonance line and the 569 eV intercombination line. If the emission is dominated by the 561 eV forbidden line though, the significance is greatly reduced. Kaastra et al. (2003) dismiss forbidden line emission due to photoionisation but they do not consider emission from heliospheric and geocoronal charge exchange. This is the result of collisions between solar wind ions and neutral atoms from ISM (heliospheric) and exosphere (geocoronal) and one of the strongest expected lines is the O VII Kα forbidden line (see Snowden et al. (2004), Wargelin et al. (2004) and references therein). Solar wind charge exchange emission is expected to vary significantly with time and position on the sky. The geocoronal emission is generally much weaker that the heliospheric emission except during periods of enhanced solar activity.
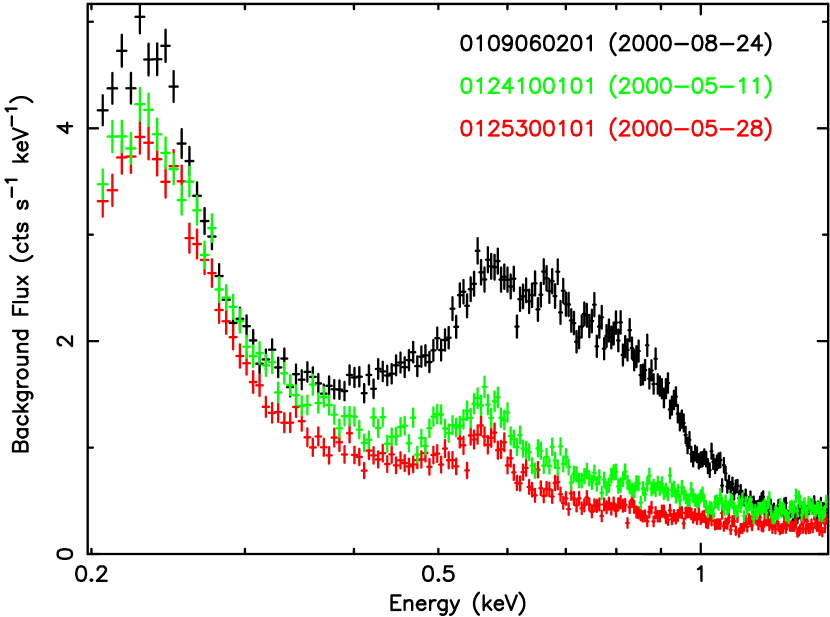
At this point it should be noted that the observations of Abell 2052 and MKW 3s used by Kaastra et al. (2003) were taken within a day of each other (2000-08-21 and 2000-08-22) and are only slightly more than a degree apart on the sky. To test whether these observations could have been affected by significant charge exchange emission we selected observations of non-extended sources taken shortly before or afterward and pointed in a similar direction. Background spectra for these observations are shown in Figure 5. It can be seen that Observation 0109060201, which was taken shortly after the observations of Abell 2052 and MKW 3s and is about 30 degrees on the sky away from them, has a large excess of emission between 0.4 - 1.0 keV compared to the backgrounds for the observations contemporaneous with those of the clusters that do not show significant “redshifted” O VII emission. This correlation extends to the fact that the background contemporaneous with the observation of Coma (the cluster for which Kaastra et al. (2003) detect the least excess O VII emission) also shows the least evidence of charge exchange emission. This would seem to strongly undermine the case for the emission being extragalactic in origin.
5. Discussion and Conclusions
To investigate the cause of the soft excesses observed in several clusters by Kaastra et al. (2003) we have studied the correlation of properties of the cluster fields with Kaastra’s soft excess/deficit measurements and find that the excess/deficit is correlated with both galactic latitude and the soft X-ray (R12) background. From this we infer that incorrect subtraction of the soft X-ray background is a likely cause of the observed excess/deficits. To test this we re-analyzed the data from four clusters for which Kaastra et al. (2003) measure significant soft excesses. Using backgrounds matched to the properties (N21cm, R12 and particle background) of the individual fields we obtain fitted hydrogen columns consistent with the galactic 21cm columns and considerably higher than those measured by Kaastra et al. (2003). We therefore conclude that the soft excess/deficit observed by Kaastra et al. (2003) most likely the result of the field by field variation of the soft X-ray background that remains in the data after a mean “blank sky” background is subtracted.
We have also examined the evidence for redshifted O VII lines presented by Kaastra et al. (2003). This detection is significant only in two clusters, Abell 2052 and MKW 3s, and only if the emission is dominated by the resonance and intercombination lines. However we show that the observations of these two clusters, which where taken within a day of each other and are a degree apart on the sky, are likely contaminated with heliospheric or geocoronal charge exchange emission containing strong O VII forbidden line emission. Given the correlation between our expectation of charge exchange contamination and the the detection of “redshifted” O VII emission by Kaastra et al. (2003) we conclude that the case for the emission being associated with clusters is very weak.
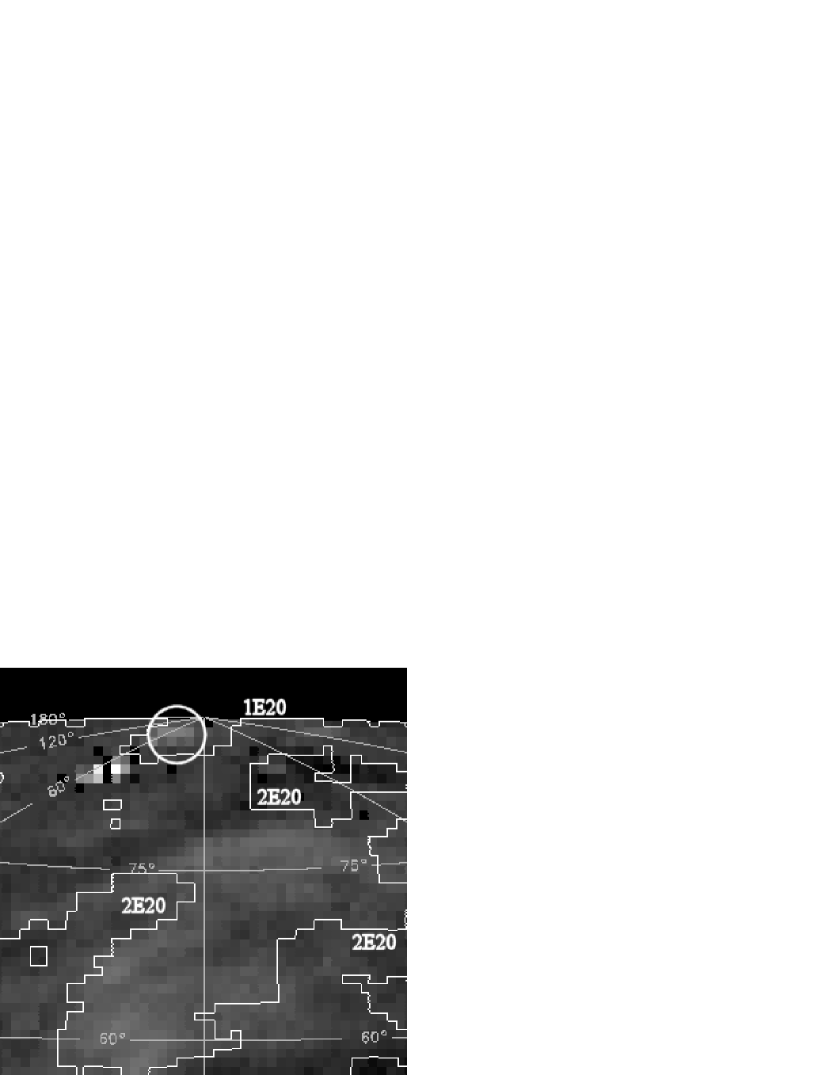
The one source that several authors agree upon as having an apparent X-ray excess is the Coma cluster, so we examine whether this is truly evidence for a WHIM component in cosmic filaments (Bonamente et al., 2003; Finoguenov et al., 2003). Even on the R12 map, one can see an enhancement in this region of the sky, suggestive that it is due to the Coma cluster (Fig. 6). However, there is a local minimum in the 21 cm column density at Coma (Dickey & Lockman, 1990; Hartmann & Burton, 1997), and this was certainly not caused by the Coma cluster. A local minimum in the HI sky would permit us to see the soft X-ray emission from the Galactic halo more readily, causing a brightening in the soft X-ray map of the sky at that location. It is extremely difficult to separate a Galactic (halo) brightening in R12 from that associated with the Coma cluster. There are clear examples of brightening in the the R12 flux at low 21 cm column regions, such as in the Lockman hole (Snowden et al., 1994). Furthermore, the 21 cm column density is so low in this direction ( 1020 cm-2) that it is poorly known as the various instrumental corrections (from sidelobes, etc.) become a significant fraction of the signal (Hartmann et al., 1996); the true 21 cm column may be lower than the usual values quoted. Further complicating the analysis of Coma is that its extremely low NH would make finding “blank sky” fields with similar properties very difficult. Therefore, we are cautious about claims that the Coma cluster possesses a soft X-ray excess and we note that Arabadjis & Bregman (2000) were able to fit a free-free emission model to Coma (ROSAT PSPC data) without an additional soft excess, but they required a Galactic column density (61019 cm-2) lower than the values of Hartmann & Burton (1997) (91019 cm-2).
Despite our concerns on the reality of a soft X-ray excess from clusters of galaxies, it might be possible to isolate this component spectrally, which should be possible because this soft excess is rather bright. If one could show redshifted OVII line emission from the outskirts of a cluster that was not blended with the Galactic feature (or contaminated with charge exchange emission), it would constitute strong evidence for the WHIM around clusters. Currently, the OVII line is blended with the Galactic OVII line for low redshift clusters and does not appear to be present in the moderate redshift cluster (Abell 1835) whose spectrum would imply a soft excess (fN -0.3). The use of smaller, higher redshift clusters would also help to isolate the soft excess because one could take a local background from the same field of view as that used to image the cluster.
References
- Allen et al. (2002) Allen, S. W., Schmidt, R. W., & Fabian, A. C. 2002, MNRAS, 334, L11
- Allen et al. (2003) Allen, S. W., Schmidt, R. W., Fabian, A. C., & Ebeling, H. 2003, MNRAS, 342, 287
- Arabadjis & Bregman (2000) Arabadjis, J. S. & Bregman, J. N. 2000, ApJ, 536, 144
- Berghöfer & Bowyer (2002) Berghöfer, T. W. & Bowyer, S. 2002, ApJ, 565, L17
- Berghöfer et al. (2000) Berghöfer, T. W., Bowyer, S., & Korpela, E. 2000, ApJ, 545, 695
- Bonamente et al. (2003) Bonamente, M., Joy, M. K., & Lieu, R. 2003, ApJ, 585, 722
- Bowyer et al. (2000) Bowyer, S., Berghöfer, T., & Korpela, E. 2000, ApJ, 548, L135
- Dickey & Lockman (1990) Dickey, J. M. & Lockman, F. J. 1990, ARA&A, 28, 215
- Durret et al. (2002) Durret, F., Slezak, E., Lieu, R., Dos Santos, S., & Bonamenta, M. 2002, A&A, 390, 397
- Finoguenov et al. (2003) Finoguenov, A., Briel, U. G., & Henry, J. P. 2003, preprint, astro-ph/0309019
- Hartmann & Burton (1997) Hartmann, D. & Burton, W. B. 1997, Atlas of Galactic Neutral Hydrogen (Cambridge: Cambridge University Press)
- Hartmann et al. (1996) Hartmann, D., Kalberla, P. M. W., Burton, W. B., & Mebold, U. 1996, A&A, 119, 115
- Kaastra et al. (1999) Kaastra, J., Lieu, R., Mittaz, J. P. D., Bleeker, J. A. M., Mewe, R., Colafrancesco, S., & Lockman, F. J. 1999, ApJ, 519, L119
- Kaastra et al. (2003) Kaastra, J., Lieu, R., Tamura, T., Paerels, F. B. S., & den Herder, J. W. 2003, A&A, 397, 445
- Lieu et al. (1999) Lieu, R., Bonamente, M., & Mittaz, J. P. D. 1999, ApJ, 517, L91
- Lieu et al. (2000) —. 2000, A&A, 364, 497
- Lieu et al. (1996) Lieu, R., Mittaz, J. P. D., Bowyer, S., Breen, J. O., Lockman, F. J., Murphy, E. M., & Hwang, C.-Y. 1996, Science, 274, 1335
- Lumb et al. (2002) Lumb, D. H., Warwick, R. S., Page, M., & De Luca, A. 2002, A&A, 389, 93
- Peterson et al. (2003) Peterson, J. R., Kahn, S. M., Paerels, F. B. S., Kaastra, J. S., Tamura, T., Bleeker, J. A. M., Ferrigno, C., & Jernigan, J. G. 2003, ApJ, 590, 207
- Read & Ponman (2003) Read, A. M. & Ponman, T. J. 2003, A&A, 409, 395
- Sarazin & Lieu (1998) Sarazin, C. L. & Lieu, R. 1998, ApJ, 494, L177
- Snowden et al. (2004) Snowden, S. L., Collier, M. R., & Kuntz, K. D. 2004, ApJ, 610, 1182
- Snowden et al. (1997) Snowden, S. L., Egger, R., Freyberg, M. J., McCammon, D., Plucinsky, P. P., Sanders, W. T., Schmitt, J. H. M. M., Trümper, J., & Voges, W. 1997, ApJ, 485, 125
- Snowden et al. (1994) Snowden, S. L., Hasinger, G., Jahoda, K., Lockman, F. J., McCammon, D., & Sanders, W. T. 1994, ApJ, 430, 601
- Wargelin et al. (2004) Wargelin, B. J., Markevitch, M., Juda, M., Kharchenko, V., Edgar, R., & Dalgarno, A. 2004, ApJ, 607, 596