Spectroscopic Confirmation of a Large AGN Population in Clusters of Galaxies
Abstract
We have completed a spectroscopic survey of X-ray point sources in eight low-redshift clusters of galaxies () and have identified 40 cluster members with broad-band (0.3–8 keV) X-ray luminosities between and erg s-1. There are between two and ten X-ray sources per cluster. We use visible-wavelength emission lines, X-ray spectral shapes, and multiwavelength flux ratios to determine that at least 35 of these galaxies are Active Galactic Nuclei (AGN). From our spectroscopic survey of other candidate cluster members we estimate that the AGN fraction is % for cluster galaxies more luminous than mag hosting AGN with broad-band X-ray luminosities above erg s-1, or %. We stress that additional, lower-luminosity AGN are expected to be present in the mag cluster members. Our data unambiguously demonstrate that cluster galaxies host AGN more frequently than previously expected. Only four of these galaxies have obvious visible-wavelength AGN signatures, even though their X-ray luminosities are too high for their X-ray emission to be due to populations of low-mass X-ray binaries or hot, gaseous halos. We attribute the significant difference in visible and X-ray AGN identification to dilution of low-luminosity AGN spectral signatures by host galaxy starlight and/or obscuration of accretion onto the central, supermassive black hole.
Subject headings:
galaxies: active – galaxies: clusters: general – galaxies: evolution – X-rays: galaxies – X-rays: galaxies: clusters – X-rays: general1. Introduction
One of the surprising results of the many deep Chandra X-ray Observatory observations of clusters of galaxies has been growing evidence for higher surface densities of point sources toward clusters of galaxies relative to blank field observations. Early evidence for this excess point source density was found with measurements of cumulative source counts relative to the expectations from deep, blank field exposures (Cappi et al., 2001; Sun & Murray, 2002; Molnar et al., 2002). While the natural interpretation of these sources was that they are associated with the clusters, most of these sources were sufficiently bright that they would have to be Active Galactic Nuclei (AGN) if they were cluster members.
This conclusion was unexpected because AGN, or any emission-line galaxies, are rarely identified in clusters. In a study of elliptical galaxies, Osterbrock (1960) noted that [O II] emission was only observed from isolated ellipticals or those in small groups and not from any of the 25 members of rich clusters that were observed. Gisler (1978) significantly improved the statistical significance of this result with a survey of over 1300 galaxies. He found that the decrease in the number of emission-line galaxies in clusters was true of lenticular and spiral galaxies, as well as ellipticals, and presented the first tentative evidence that AGN may be found less commonly in rich clusters than the field. This result was confirmed with a subsequent, more uniformly-selected spectroscopic survey of 1095 cluster galaxies and 173 field galaxies by Dressler et al. (1985). These authors found that 7% of cluster galaxies have emission-line nuclei, compared to 31% of field galaxies. AGN were similarly found to be about a factor of five times more rare in clusters: only 1% of cluster galaxies were AGN compared to 5% of the field sample.
The smaller AGN population in rich clusters relative to the field has been ascribed to differences in the frequency of AGN fueling episodes and the smaller numbers of cluster galaxies with significant reservoirs of cold gas (e.g. Giovanelli & Haynes, 1985). One of the most popular mechanisms for fueling AGN is the merger of two gas-rich galaxies as the strong gravitational torques from a major merger could provide sufficient gas inflow to the central, supermassive black hole to produce an AGN (e.g. Barnes & Hernquist, 1992). However, the high velocity dispersions of rich clusters results in a low merger frequency because the galaxies’ relative velocities are too high to form bound pairs. If galaxy mergers and significant reservoirs of cold gas are the most important parameters for fueling AGN, these arguments provide a natural explanation for the lower AGN fraction in clusters compared to the field.
These differences in the galaxy population between rich and poor environments suggest that cluster AGN are a valuable probe of AGN and galaxy evolution. In Martini et al. (2002), we measured redshifts for all of the X-ray sources with bright visible-wavelength counterparts in the field of the cluster Abell 2104. This work confirmed for the first time that many of the X-ray point sources were in fact cluster members and demonstrated that there may be a sufficiently large AGN population in clusters of galaxies for demographic studies. Particularly, we found six X-ray sources associated with cluster members, or approximately 5% of all of the luminous cluster galaxies. Since the Martini et al. (2002) study, several other groups have carried out X-ray studies of clusters with either new spectroscopic observations or data obtained from the literature. These observations include the identification of two galaxies in the cluster MS1054-0321 (Johnson et al., 2003), eight in the cluster Abell 2255 (Davis et al., 2003), six galaxies in the cluster Abell 3128 (Smith, 2003), a recent study of the Coma cluster (Finoguenov et al., 2004), and one in the cluster MS2053-04 (Tran et al., 2005). The X-ray emission from many of these galaxies appears to be due to AGN based on their X-ray luminosity and/or X-ray spectral shape. The two sources in MS1054-0321 and the brightest cluster galaxy in MS2053-04 have erg s-1 although only a small fraction of the lower-redshift X-ray sources have such high luminosities. For these cases it is possible that the X-ray emission is due to either low-mass X-ray binaries (LMXBs) or halos of hot gas. Several recent visible-wavelength (Miller et al., 2003) and radio surveys (Miller & Owen, 2003; Best, 2004) have also identified AGN in clusters of galaxies and studied the environmental dependence of AGN.
New studies of Chandra observations of larger samples of additional clusters have identified more examples of X-ray source overdensities (Cappelluti et al., 2005; Ruderman & Ebeling, 2005), although this is not true of every study (Kim et al., 2004b). The largest of these studies to date is the investigation by Ruderman & Ebeling (2005) of the fields of 51 massive clusters from the MACS sample (Ebeling et al., 2001). These authors measured significant X-ray source overdensities within 3.5 Mpc of the cluster cores, and in particular a high concentration of sources within the central 0.5 Mpc. If the X-ray sources in the moderate to high-redshift clusters studied by Cappelluti et al. (2005) and Ruderman & Ebeling (2005) are associated with cluster galaxies, their high inferred luminosities makes them very strong AGN candidates.
At progressively lower X-ray luminosities, an AGN classification based on X-ray luminosity alone becomes less secure because populations of LMXBs, hot gaseous halos, and massive starbursts also produce significant X-ray emission. Redshift surveys of galaxies detected in deep X-ray observations have not always detected AGN spectral signatures (e.g. Mushotzky et al., 2000; Hornschemeier et al., 2001; Brandt & Hasinger, 2005). Martini et al. (2002) ascribed the absence of clear AGN signatures from even relatively low-redshift () cluster X-ray sources to a combination of dilution by host galaxy starlight and obscuration by gas and dust. In the absence of clear AGN spectral signatures, multiwavelength spectral shape is the clearest indicator of the physical origin of the X-ray emission. The X-ray and visible-wavelength properties of resolved LMXB populations have now been carefully measured with Chandra for a large number of nearby, luminous elliptical galaxies (Kim & Fabbiano, 2004) and have been observed to produce broad band (0.3–8 keV) X-ray luminosities as high as erg s-1. Galaxies with X-ray emission from LMXBs follow a fairly tight relation between band and X-ray flux because the number of LMXBs approximately scales with the stellar mass of the host galaxy. Hot gaseous halos from large, early-type galaxies can also produce significant X-ray emission. While the intracluster medium may strip these halos, sources with soft X-ray luminosities of erg s-1 have been observed in many nearby clusters with Chandra (e.g. Vikhlinin et al., 2001; Yamasaki et al., 2002; Sun et al., 2005). There is also a relation between X-ray and stellar luminosity for emission from hot gas, although with larger scatter (Canizares et al., 1987) and the larger scatter is likely due to environmental influences (Brown & Bregman, 2000). Finally, the most powerful, local starburst galaxies such as Arp 220 and NGC 3256 can have X-ray luminosities as high as erg s-1 due to hot gas associated with the starburst (Moran et al., 1999; Iwasawa, 1999), although these galaxies also have luminous, visible-wavelength emission lines and are expected to be rare in rich clusters. In addition to their multiwavelength properties, resolution is another discriminant between LMXBs, hot gas, star formation, and AGN. The first three mechanisms will all produce extended X-ray emission and should be resolved in Chandra observations of low-redshift clusters.
Since our initial work on Abell 2104, we have completed a spectroscopic study of seven additional, low-redshift () clusters of galaxies. We have measured redshifts for the visible-wavelength counterparts of all of the X-ray sources in the fields of these clusters more luminous than approximately one magnitude fainter than and identified a total of 40 X-ray sources in eight clusters. In this paper we describe their multiwavelength properties, conclude that most of these sources must be low-luminosity AGN, and demonstrate how the X-ray sources in these clusters can account for the excess point source surface densities. The observations and data analysis are described next in §2, while their multiwavelength properties are analyzed in section §3. The results of this study, in particular the nature of the X-ray emission, calculation of the AGN fraction, and implications for the X-ray source overdensities observed toward clusters are discussed in §4. We summarize this work in the last section. In future papers we will investigate the relationship of these X-ray sources to the cluster galaxy population and perform a detailed sensitivity analysis to derive the X-ray luminosity function in clusters of galaxies.
2. Observations and Measurements
| Cluster | Redshift | RA | DEC | ObsID | Camera | T [ks] | Filters | Imaging Date | Spectra Date | |||
|---|---|---|---|---|---|---|---|---|---|---|---|---|
| (1) | (2) | (3) | (4) | (5) | (6) | (7) | (8) | (9) | (10) | (11) | (12) | (13) |
| Abell 3125 | 0.059 | 03:27:22 | -53:30:00 | 1.6 | 892 | ACIS-I | 9 | 2002 Sep | 2003 Oct | 6 | ||
| Abell 3128 | 0.060 | 03:30:24 | -52:32:00 | 1.5 | 893 | ACIS-I | 19 | 2002 Sep | 2003 Oct | 10 | ||
| Abell 644 | 0.070 | 08:17:25 | -07:30:42 | 6.4 | 2211 | ACIS-I | 29 | 2003 Mar | 2003 Mar | 2 | ||
| Abell 2104 | 0.155 | 15:40:07 | -03:17:24 | 8.9 | 895 | ACIS-S | 49 | 2003 Mar | 2002 Apr | 6 | ||
| Abell 1689 | 0.183 | 13:11:30 | -01:20:10 | 1.8 | 1663 | ACIS-I | 10 | 2003 Mar | 2003 Mar | 2 | ||
| Abell 2163 | 0.203 | 16:15:46 | -06:08:55 | 12.0 | 1653 | ACIS-I | 70 | 2003 Mar | 2003 Mar | 3 | ||
| MS1008 | 0.301 | 10:10:32 | -12:39:32 | 6.7 | 926 | ACIS-I | 41 | 2003 Mar | 2003 Mar | 5 | ||
| AC 114 | 0.312 | 22:58:49 | -34:48:09 | 1.3 | 1562 | ACIS-S | 72 | 2002 Sep | 2002 Oct | 6 |
Note. — Cluster sample, properties, observations data, and the number of confirmed cluster members with X-ray sources. Columns are: (1) Cluster name; (2) Cluster redshift; (3 and 4) RA and DEC in for epoch J2000; (5) Galactic Neutral Hydrogen column density in units of cm-2; (6) ObsID of the archival Chandra data; (7) ACIS Camera; (8) Useful integration time of the Chandra data; (8) Visible-wavelength filters; (9) Date of visible-wavelength imaging; (10) Date of spectroscopic observations; (11) Number of X-ray sources in the cluster; (12) Estimate of the broad band luminosity limit of the observations for a cluster member in erg s-1 (see Section 2.1).
This sample of eight clusters was chosen because the clusters have publicly available Chandra ACIS data with sufficiently long exposures to detect X-ray sources as faint as erg s-1 at the cluster redshift. All of these clusters are also observable from Las Campanas Observatory in Chile. The cluster sample, redshift, and basic data about the X-ray, visible-wavelength imaging, and spectroscopic observations are presented in Table 1. The field of view of the survey in each cluster is set by the field size of the camera employed to obtain the X-ray data and is either (ACIS-S) or (ACIS-I). We obtained visible-wavelength imaging with the 2.5m du Pont telescope, identified likely counterparts to X-ray sources in these fields, and then obtained spectroscopy with the 6.5m Magellan Clay Telescope to determine which X-ray counterparts belong to the clusters. This search identified a sample of 40 cluster members, whose coordinates, redshifts, and visible-wavelength properties are provided in Table 2. We describe the X-ray, imaging, and spectroscopic observations in the next subsections.
| ID | CXOU XID | [OII] | H | Notes | Flags | Lit ID | |||||
|---|---|---|---|---|---|---|---|---|---|---|---|
| (1) | (2) | (3) | (4) | (5) | (6) | (7) | (8) | (9) | (10) | (11) | (12) |
| A3125-1 | J032723.5-532535 | 0.0642 | 15.93 (0.03) | 1.78 (0.06) | 0.65 (0.05) | … | … | … | … | Lit-z | D80-052 |
| A3125-2 | J032754.7-532217 | 0.0583 | 15.10 (0.03) | 1.81 (0.06) | 0.69 (0.05) | … | … | … | … | … | 2MASXJ03275473-5322169 |
| A3125-3 | J032752.0-532610 | 0.0609 | 15.26 (0.03) | 1.82 (0.06) | 0.70 (0.05) | … | … | … | … | … | 2MASXJ03275206-5326099 |
| A3125-4 | J032724.8-532518 | 0.0628 | 15.26 (0.03) | 1.84 (0.06) | 0.67 (0.05) | … | … | … | … | … | … |
| A3125-5 | J032705.0-532140 | 0.0625 | 16.08 (0.03) | 1.78 (0.06) | 0.71 (1.05) | … | -12.0 (0.5) | … | H,[NII],[SII] | … | ESO155-IG031 |
| A3125-6 | J032823.6-533436 | 0.0630 | … | … | … | … | … | … | … | Lit-z,Lit-pos | ESO155-G037,RGC02-241 |
| A3128-1 | J033018.6-522856 | 0.0549 | 15.51 (0.03) | 1.64 (0.06) | 0.48 (0.05) | … | … | … | … | … | CSRG0262 |
| A3128-2 | J032941.4-522936 | 0.0586 | 17.20 (0.03) | 1.20 (0.06) | 0.36 (0.05) | … | -2.8 (0.5) | 1.1 (0.2) | … | … | S03-6,APMUKS(BJ)B032816.70-523949.5 |
| A3128-3 | J032931.1-522716 | 0.0586 | … | … | … | … | … | … | … | Lit-z,Edge | D80-135 |
| A3128-4 | J033051.0-523031 | 0.0571 | 15.04 (0.03) | 1.51 (0.06) | 0.59 (0.05) | … | … | … | … | … | S03-3,2MASXJ03305107-5230315 |
| A3128-5 | J033046.0-522335 | 0.0588 | … | … | … | … | … | … | … | Lit-pos, | 2MASXJ03304589-5223385 |
| A3128-6 | J033017.3-523407 | 0.0544 | 16.96 (0.03) | 1.28 (0.06) | 0.33 (0.05) | … | … | … | … | … | S03-5 |
| A3128-7 | J033013.6-523730 | 0.0648 | 15.15 (0.03) | 1.41 (0.06) | 0.24 (0.05) | … | … | … | … | … | S03-4,2MASXJ03301366-5237304 |
| A3128-8 | J032950.6-523447 | 0.0643 | 15.31 (0.03) | 1.64 (0.06) | 0.48 (0.05) | … | … | … | … | 2MASXJ03295060-5234471 | |
| A3128-9 | J033039.3-523206 | 0.0622 | 16.50 (0.03) | 1.63 (0.06) | 0.46 (0.05) | … | … | … | … | … | 2MASXJ03303924-5232066 |
| A3128-10 | J033038.4-523710 | 0.0599 | 14.94 (0.03) | 1.54 (0.06) | 0.59 (0.05) | … | … | … | … | S03-2,2MASXJ03303848-5237096 | |
| A644-1 | J081739.6-073309 | 0.0726 | 16.90 (0.03) | 0.95 (0.06) | 0.35 (0.05) | … | … | … | NLS1 | … | … |
| A644-2 | J081748.1-073732 | 0.0783 | 15.93 (0.03) | 1.81 (0.06) | 0.66 (0.05) | … | … | 2.0 (0.3) | … | … | … |
| A2104-1 | J154023.6-031347 | 0.159 | 17.30 (0.03) | 2.43 (0.06) | 0.81 (0.05) | 0.98 (0.05) | … | … | S2 | … | MKMT02-1 |
| A2104-2 | J154016.7-031507 | 0.161 | 18.65 (0.03) | 2.32 (0.06) | 0.78 (0.05) | 0.85 (0.05) | … | … | … | … | MKMT02-2 |
| A2104-3 | J154009.4-031519 | 0.155 | 17.16 (0.03) | 2.46 (0.06) | 0.79 (0.05) | 0.85 (0.05) | … | … | … | … | MKMT02-3 |
| A2104-4 | J154014.0-031704 | 0.157 | 19.60 (0.03) | 2.22 (0.06) | 0.69 (0.05) | 0.78 (0.05) | … | … | … | MKMT02-4 | |
| A2104-5 | J154019.5-031825 | 0.162 | 19.56 (0.03) | 2.04 (0.06) | 0.67 (0.05) | 0.76 (0.05) | … | … | … | … | MKMT02-5 |
| A2104-6 | J154003.9-032039 | 0.154 | 17.77 (0.03) | 2.43 (0.06) | 0.74 (0.05) | 0.87 (0.05) | … | … | … | MKMT02-6 | |
| A1689-1 | J131145.4-012336 | 0.187 | 17.75 (0.03) | 2.19 (0.06) | 0.77 (0.05) | 0.70 (0.05) | … | … | … | … | APMUKS(BJ)B130911.16-010741.8 |
| A1689-2 | J131135.6-012012 | 0.200 | 18.34 (0.03) | 1.41 (0.06) | 0.48 (0.05) | 0.50 (0.05) | … | … | S2 | APMUKS(BJ)B130901.41-010417.1 | |
| A2163-1 | J161524.4-060904 | 0.201 | 17.76 (0.03) | 1.89 (0.06) | 0.70 (0.05) | … | -14.0 (1.0) | 2.5 (0.5) | S2 | … | … |
| A2163-2 | J161548.9-061512 | 0.201 | 20.04 (0.03) | 2.24 (0.07) | 0.76 (0.05) | … | … | … | … | … | |
| A2163-3 | J161543.6-061730 | 0.200 | 18.34 (0.03) | 2.52 (0.06) | 0.86 (0.05) | … | … | … | … | … | … |
| MS1008-1 | J101018.7-123744 | 0.298 | 19.60 (0.03) | 2.12 (0.06) | 0.71 (0.05) | 0.83 (0.05) | -6.0 (0.5) | 2.9 (0.3) | [OIII] | … | PPP-001519 |
| MS1008-2 | J101005.2-123834 | 0.305 | 21.53 (0.04) | 2.29 (0.10) | 0.77 (0.15) | 0.72 (0.08) | … | … | … | … | |
| MS1008-3 | J101035.3-124021 | 0.309 | 19.17 (0.03) | 2.65 (0.06) | 1.02 (0.05) | 0.96 (0.05) | … | … | … | … | PPP-000760 |
| MS1008-4 | J101026.5-123810 | 0.297 | 19.71 (0.03) | 2.27 (0.06) | 0.86 (0.05) | 0.84 (0.05) | … | 0.7 (0.2) | … | … | PPP-001427 |
| MS1008-5 | J101032.3-123934 | 0.301 | 18.96 (0.03) | 2.46 (0.06) | 0.92 (0.05) | 0.88 (0.05) | … | 0.8 (0.2) | … | … | … |
| AC114-1 | J225852.9-344846 | 0.304 | 20.01 (0.03) | 1.83 (0.06) | 0.77 (0.05) | 0.47 (0.05) | … | 8.0 (0.6) | … | … | CN84-191 |
| AC114-2 | J225851.4-344912 | 0.321 | 21.42 (0.04) | 2.09 (0.20) | 1.24 (0.20) | 0.74 (0.08) | … | … | … | … | … |
| AC114-3 | J225849.3-344701 | 0.313 | 19.26 (0.03) | 2.01 (0.06) | 0.96 (0.05) | 0.69 (0.08) | -3.0 (0.8) | … | H,[OIII],H | … | CN84-087 |
| AC114-4 | J225846.2-344945 | 0.318 | 20.98 (0.04) | 2.32 (0.15) | 1.16 (0.15) | 0.70 (0.08) | … | 3.2 (0.1) | … | … | CBB2001-0552 |
| AC114-5 | J225857.4-345059 | 0.322 | 21.02 (0.05) | 2.30 (0.15) | 1.80 (0.15) | 1.50 (0.08) | … | … | … | Lit-z | CBB2001-0365 |
| AC114-6 | J225842.0-344747 | 0.310 | 18.14 (0.03) | 2.68 (0.06) | 1.27 (0.05) | 0.79 (0.05) | … | … | … | Lit-z | CN84-003 |
Note. — Visible-Wavelength Data. Columns are: (1) ID used in this paper; (2) object ID; (3) redshift (4) observed band magnitude and associated uncertainty; (5–7) observed colors; (8) [OII] equivalent width (Å); (9) H equivalent width (Å); (10) Notes on prominent emission lines; (11) Identification flags; (12) Other object IDs from the literature. The identification flags in column 11 are Lit-z (redshift obtained from literature source only), Lit-pos (object position obtained from the Digital Sky Survey), Edge (object is near the edge of our band image, (object has a large redshift offset from the cluster mean), and (object center is more than 1 outside the X-ray error circle). References for the literature positions and/or redshifts used for this study are A3125-1: Caldwell & Rose (1997); A3125-6: Dressler (1980); Rose et al. (2002); A3128-3: Caldwell & Rose (1997); A3128-5: Dressler (1980); AC114-5: Couch et al. (2001); AC114-6: Couch & Newell (1984).
2.1. X-ray Data
The X-ray observations were initially processed with a standard application of the CIAO pipeline and the wavdetect source identification tool, although they have since been reprocessed with a custom X-ray photometry package named XPROCES (E. Kim et al. 2006, in prep). As this is the first application of the package we provide a brief description here, although defer a complete description to a future paper.
The first step is to produce a new level 2 event file following the standard science threads, including suitable filtering to remove flare events and CTI correction. XPROCES then runs the wavdetect task on the unbinned images within the CIAO package (Version 3.2) to identify point sources. We set the detection threshold at , searched scale sizes of pixels to identify sources, and employed an exposure map for an energy of 1.5 keV. The wavdetect detection threshold of corresponds to one false detection per pixels, or one per unbinned ACIS chip. We therefore expect between one (ACIS-S) and four (ACIS-I) false detections per cluster field. In the same area (1000x1000 Chandra pixels or ) in which we expect one false detection, there mag galaxies. For a generous matching tolerance of , the probability of a chance superposition between a false detection and a bright galaxy is less than 3% for the entire survey area. This is an upper limit on the false detection probability, as we also have a strict signal-to-noise cut on the X-ray data that will eliminate many false detections. The probability that a false detection will be cross-identified with a cluster member is lower still because many bright galaxies are not cluster members.
XPROCES prepares the event file for photometry with several additional steps. The first step is detection and removal of new hot pixels and cosmic ray afterglow events, followed by the standard charge transfer inefficiency and time-dependent gain correction. At this stage flare events are detected and removed as well. The properties of the sources are then determined with aperture photometry, where the aperture size is set by the 95% encircled energy fraction of the PSF at 1.5 keV (the energy of maximum quantum efficiency) at a given off-axis angle. We measure source counts in five X-ray bands following the definitions used by Kim et al. (2004a). These are the Broad (0.3-8 keV), Soft (0.3-2.5 keV), Hard (2.5-8 keV), (0.3-0.9 keV), and (0.9-2.5 keV) bands. The same aperture size is used for all bands even though there are slight changes in the size of the PSF with energy. This is a small source of error. For example, the 95% encircled energy at 1.5 keV corresponds to the 92% encircled energy at 3.5 keV. We do not use the 95% encircled energy aperture at 3.5 keV because it would increase the potential for source overlap. The counts for each source in these five bands are presented in Table 3. Only sources detected at greater than 3 significance in the Broad band are included in this sample and all of these sources have at least seven counts in the Broad band. Count values are not shown if the source counts corresponded to less than a 3 detection in any given band. The background flux for each source has been measured within an annulus from two to five times the source radius and this value has been subtracted from the aperture measurement. We have calculated the uncertainties and the 3 significance with the Gehrels (1986) approximation for small .
For each source we calculate several quantities to parametrize the X-ray spectral energy distribution. Following Kim et al. (2004a) we define the hardness ratio and the colors and . These quantities are commonly-used characterizations of spectral shape. X-ray quantiles are a recently developed measure of spectral shape that are based on the distribution of energy values in a spectrum (Hong et al., 2004). A quantile is defined such that if % of the counts in a spectrum are below some energy , then the quantile is:
| (1) |
where and are the lower and upper energy boundaries of the spectrum and are taken here to be 0.3 and 8.0 keV, respectively. The virtue of X-ray quantiles is that they are less susceptible to biases due the relative energy sensitivity of an instrument. Following Hong et al. (2004), we have calculated the quantities and . The hardness ratio, X-ray colors, and quantiles for our sample are listed in Table 3.
We calculate fluxes in the broad, soft, and hard bands with an energy conversion factor calculated from the foreground Galactic extinction toward each cluster (Stark et al., 1992) and assume a power-law typical of AGN, where is the slope of the power-law photon flux density . The energy conversion factor is calculated for each chip at the maximum value of the exposure map and then scaled to the location of each source with the exposure map. This approach is similar to that described in Kim et al. (2004a). We calculate the X-ray luminosity of each source based on the luminosity distance (e.g. Carroll et al., 1992) to each cluster and assume a cosmology with . The fluxes are measured in the observed bandpasses and the luminosities have been calculated for the restframe bandpass assuming a model. The source fluxes and luminosities are presented in Table 4. For a power-law plus Galactic absorption model we are complete to broad-band luminosity limits of erg s-1 (A644 at ) to erg s-1(A1689 at ). These luminosity limits are listed as the last column of Table 1 and correspond to a five count detection on axis. Thirty eight of the 40 sources are unresolved, based on a comparison to the Chandra PSF at similar off-axis angle. The remaining two sources (AC114-1, AC114-2) are sufficiently embedded in the diffuse, intracluster gas that it is difficult to determine if the emission due to the galaxy is unresolved.
| ID | ||||||||||
|---|---|---|---|---|---|---|---|---|---|---|
| (1) | (2) | (3) | (4) | (5) | (6) | (7) | (8) | (9) | (10) | (11) |
| A3125-1 | 21.2 (3.7) | 20.4 (3.6) | … | 5.0 (1.5) | 15.4 ( 3.0) | -0.5 (0.3) | … | … | -0.9 (0.1) | 1.7 (0.8) |
| A3125-2 | 15.4 (2.8) | 16.0 (3.0) | … | 11.2 (2.4) | 4.9 ( 1.3) | 0.4 (0.4) | … | … | -1.1 (0.1) | 2.2 (0.4) |
| A3125-3 | 7.6 (1.8) | 8.3 (2.0) | … | 4.8 (1.4) | 3.5 ( 1.1) | 0.1 (0.5) | … | … | -1.1 (0.3) | 1.7 (0.6) |
| A3125-4 | 8.0 (1.9) | 6.3 (1.7) | … | … | 3.4 ( 1.1) | … | … | … | -0.9 (0.6) | 0.9 (0.6) |
| A3125-5 | 25.9 (4.1) | 11.9 (2.5) | 14.0 (2.8) | … | 11.4 ( 2.5) | … | -0.1 (0.2) | 0.1 (0.3) | -0.4 (0.1) | 1.5 (0.3) |
| A3125-6 | 13.7 (2.6) | 13.0 (2.7) | … | 3.9 (1.2) | 9.1 ( 2.1) | -0.4 (0.4) | … | … | -1.0 (0.3) | 1.1 (0.6) |
| A3128-1 | 19.4 (3.4) | 17.9 (3.3) | … | 9.6 (2.2) | 8.4 ( 2.0) | 0.1 (0.3) | … | … | -1.1 (0.2) | 1.5 (0.8) |
| A3128-2 | 176.7 (12.2) | 124.2 (10.1) | 52.5 (6.2) | 39.0 (5.3) | 85.1 ( 8.2) | -0.3 (0.1) | 0.2 (0.1) | -0.4 (0.1) | -0.7 (0.1) | 0.9 (0.1) |
| A3128-3 | 15.2 (2.5) | 11.2 (2.2) | 4.0 (1.0) | … | 9.2 ( 2.0) | … | 0.4 (0.5) | -0.5 (0.4) | -0.6 (0.3) | 1.3 (1.2) |
| A3128-4 | 98.2 (8.8) | 96.5 (8.8) | … | 43.0 (5.6) | 53.5 ( 6.3) | -0.1 (0.1) | … | … | -1.0 (0.0) | 1.7 (0.1) |
| A3128-5 | 14.4 (2.3) | 10.2 (1.9) | 4.2 (1.0) | 4.8 (1.3) | 5.4 ( 1.2) | 0.0 (0.5) | 0.1 (0.6) | -0.4 (0.5) | -0.7 (0.4) | 0.6 (0.5) |
| A3128-6 | 216.8 (13.7) | 175.1 (12.2) | 41.8 (5.5) | 68.7 (7.3) | 106.4 ( 9.3) | -0.2 (0.1) | 0.4 (0.1) | -0.6 (0.1) | -0.8 (0.1) | 0.9 (0.1) |
| A3128-7 | 33.9 (4.6) | 33.7 (4.7) | … | 20.2 (3.6) | 13.5 ( 2.6) | 0.2 (0.2) | … | … | -1.1 (0.1) | 1.7 (0.2) |
| A3128-8 | 26.8 (3.2) | 20.4 (2.7) | 6.4 (1.4) | 5.2 (1.2) | 15.2 ( 2.3) | -0.5 (0.4) | 0.4 (0.4) | -0.5 (0.3) | -0.8 (0.2) | 1.1 (0.6) |
| A3128-9 | 25.4 (4.0) | 19.2 (3.4) | 6.2 (1.6) | 3.4 (1.1) | 15.9 ( 3.0) | -0.7 (0.4) | 0.4 (0.3) | -0.5 (0.2) | -0.6 (0.2) | 1.2 (0.4) |
| A3128-10 | 38.7 (5.1) | 38.7 (5.2) | … | 13.3 (2.8) | 25.4 ( 4.0) | -0.3 (0.2) | … | … | -1.0 (0.1) | 1.8 (0.2) |
| A644-1 | 250.4 (14.6) | 167.0 (11.8) | 83.4 (8.1) | 98.3 (8.9) | 68.7 ( 7.2) | 0.2 (0.1) | -0.1 (0.1) | -0.3 (0.1) | -0.7 (0.1) | 0.4 (0.1) |
| A644-2 | 28.8 (3.8) | 6.1 (1.3) | 22.6 (3.5) | … | 3.4 ( 0.8) | … | -0.8 (0.6) | 0.6 (0.3) | -0.1 (0.2) | 1.6 (0.3) |
| A2104-1 | 3778.3 (60.3) | 1797.0 (41.3) | 1981.3 (43.4) | 66.8 (7.0) | 1730.3 (40.5) | -1.4 (0.1) | -0.1 (0.0) | 0.0 (0.0) | -0.4 (0.0) | 1.2 (0.0) |
| A2104-2 | 80.9 (7.8) | 22.5 (3.6) | 58.3 (6.6) | 3.7 (1.1) | 18.9 ( 3.3) | -0.7 (0.4) | -0.5 (0.1) | 0.4 (0.1) | -0.2 (0.1) | 1.3 (0.1) |
| A2104-3 | 29.3 (4.1) | 29.1 (4.2) | … | 14.3 (2.7) | 14.8 ( 2.8) | 0.0 (0.2) | … | … | -1.1 (0.1) | 1.7 (0.2) |
| A2104-4 | 25.5 (3.3) | 26.9 (3.6) | … | 6.3 (1.5) | 20.6 ( 3.1) | -0.5 (0.3) | … | … | -0.9 (0.2) | 1.6 (0.3) |
| A2104-5 | 166.1 (11.7) | 136.5 (10.5) | 29.5 (4.4) | 36.0 (5.0) | 100.5 ( 8.9) | -0.4 (0.1) | 0.5 (0.1) | -0.6 (0.1) | -0.9 (0.1) | 1.2 (0.1) |
| A2104-6 | 28.6 (3.9) | 12.2 (2.2) | 16.4 (3.0) | … | 13.0 ( 2.4) | … | -0.1 (0.2) | 0.1 (0.3) | -0.3 (0.1) | 1.0 (0.4) |
| A1689-1 | 10.6 (2.2) | 10.4 (2.3) | … | … | 7.8 ( 1.9) | … | … | … | -0.8 (0.2) | 1.6 (0.6) |
| A1689-2 | 16.1 (2.8) | 11.6 (2.3) | 4.5 (1.2) | … | 11.3 ( 2.3) | … | 0.4 (0.4) | -0.4 (0.4) | -0.7 (0.5) | 0.9 (0.3) |
| A2163-1 | 159.4 (11.0) | 11.3 (1.9) | 148.1 (10.9) | 6.3 (1.5) | 5.0 ( 1.1) | 0.1 (0.5) | -1.5 (0.4) | 0.9 (0.1) | 0.0 (0.0) | 1.9 (0.1) |
| A2163-2 | 35.8 (4.9) | 25.6 (4.1) | 10.1 (2.2) | … | 23.0 ( 3.8) | … | 0.4 (0.2) | -0.4 (0.2) | -0.6 (0.1) | 1.1 (0.2) |
| A2163-3 | 12.1 (2.3) | 12.5 (2.5) | … | 3.3 (1.0) | 9.2 ( 2.1) | -0.4 (0.5) | … | … | -0.9 (0.1) | 1.9 (0.8) |
| MS1008-1 | 7.9 (1.9) | 4.5 (1.3) | 3.5 (1.1) | … | … | … | … | … | -0.6 (0.5) | 0.4 (0.7) |
| MS1008-2 | 8.1 (2.0) | 5.6 (1.5) | … | … | 5.8 ( 1.6) | … | … | … | -0.5 (0.7) | 0.8 (0.5) |
| MS1008-3 | 67.0 (6.9) | 52.1 (6.0) | 14.9 (2.9) | 12.9 (2.7) | 39.2 ( 5.1) | -0.5 (0.2) | 0.4 (0.2) | -0.6 (0.1) | -0.7 (0.1) | 1.1 (0.3) |
| MS1008-4 | 8.9 (1.9) | 7.1 (1.6) | … | … | 5.7 ( 1.4) | … | … | … | -0.9 (0.5) | 1.1 (1.1) |
| MS1008-5 | 37.3 (3.3) | 29.2 (2.9) | 8.1 (1.4) | 10.3 (1.9) | 18.9 ( 2.1) | -0.3 (0.3) | 0.4 (0.4) | -0.6 (0.3) | -0.8 (0.1) | 1.3 (0.5) |
| AC114-1 | 933.1 (29.0) | 910.9 (28.7) | 22.2 (3.4) | 706.1 (25.4) | 204.7 (12.8) | 0.5 (0.0) | 1.0 (0.1) | -1.0 (0.0) | -1.4 (0.0) | 0.8 (0.1) |
| AC114-2 | 47.6 (4.3) | 32.1 (3.3) | 15.5 (2.6) | 7.1 (1.1) | 25.0 ( 3.0) | -0.6 (0.4) | 0.2 (0.2) | -0.3 (0.2) | -0.7 (0.2) | 0.7 (0.2) |
| AC114-3 | 122.0 (9.6) | 108.2 (9.0) | 13.8 (2.6) | 46.9 (5.7) | 61.3 ( 6.5) | -0.1 (0.1) | 0.6 (0.2) | -0.8 (0.1) | -0.9 (0.1) | 1.1 (0.2) |
| AC114-4 | 63.2 (6.5) | 23.0 (3.4) | 40.2 (5.3) | … | 22.9 ( 3.6) | … | -0.2 (0.1) | 0.3 (0.2) | -0.1 (0.1) | 1.1 (0.1) |
| AC114-5 | 7.8 (1.5) | 5.7 (1.2) | … | 5.5 (1.3) | … | … | … | … | -1.3 (1.5) | 0.6 (0.7) |
| AC114-6 | 7.5 (1.3) | 7.2 (1.3) | … | 3.6 (0.9) | 3.6 ( 0.8) | 0.0 (0.7) | … | … | -1.1 (1.3) | 0.7 (0.7) |
Note. — X-ray data and measurements. Columns (2) – (6) contain the measured counts in the (2) Broad (0.3-8 keV), (3) Soft (0.3-2.5 keV), (4) Hard (2.5-8 keV), (5) (0.3-0.9 keV), and (6) (0.9-2.5 keV) energy bands. The X-ray colors C21 and C32 are provided in columns (7) and (8), the hardness ratio HR in column (9), and the quantiles and in columns (10) and (11). See Section 2.1 for further details.
2.2. Ground-based Images
We obtained ground-based photometry for the three clusters and photometry for the five higher-redshift clusters with the 2.5m du Pont telescope at Las Campanas Observatory. The observations obtained in 2003 March employed the WFCCD camera, which has a plate scale of , and the observations in 2002 September employed the TEK5 CCD camera, which has a plate scale of . These observations encompass nearly all of the fields-of-view of the primary Chandra camera (ACIS-I or ACIS-S). For two clusters (A3125 and A3128) we obtained multiple pointings with the TEK5 camera to tile the Chandra field of view. These images were combined into single mosaics with the SWARP111http://terapix.iap.fr/rubrique.php?id_rubrique=49 package by E. Bertin. These images were all obtained under photometric conditions and calibrated with multiple observations of standard star fields from the data compiled by P.B. Stetson222http://cadcwww.hia.nrc.ca/standards/ onto the Vega magnitude system.
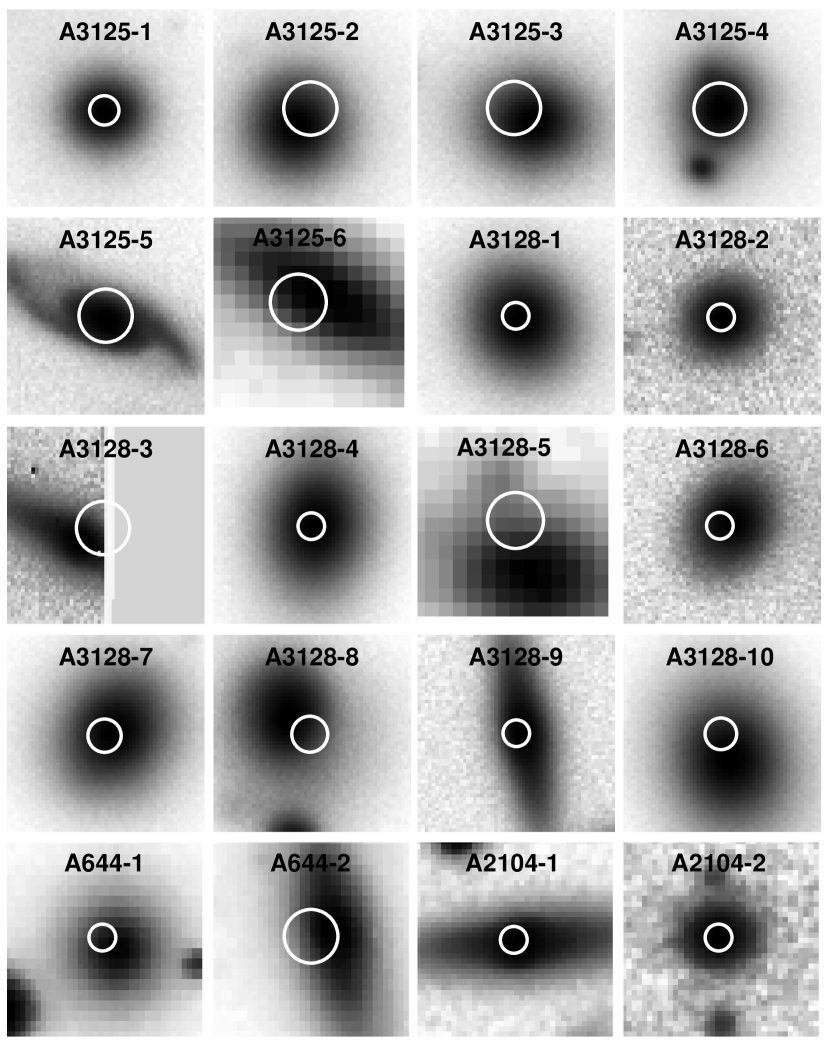
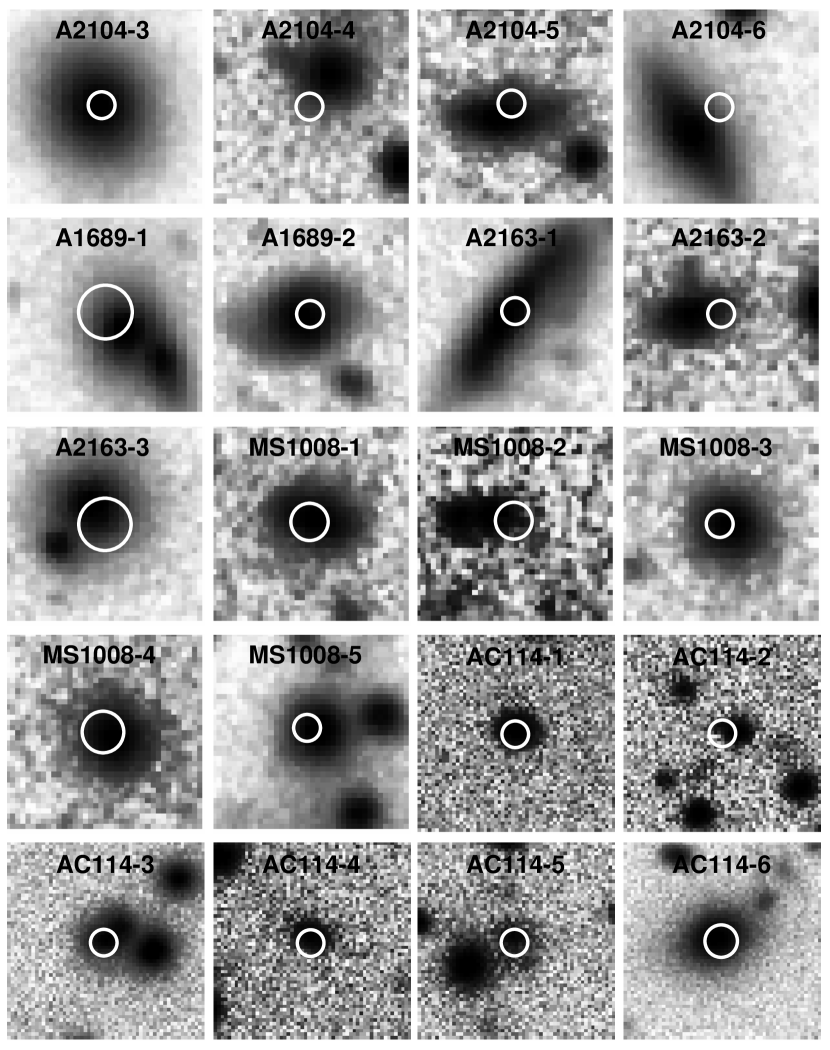
We calculated astrometric solutions for the images with the WCSTools package (Mink, 2002), cataloged the sources with the SExtractor package (Bertin & Arnouts, 1996), and matched these sources with the Chandra source catalog to create prioritized catalogs for multislit spectroscopy. The SExtractor detection parameters were approximately the default settings and the most relevant include the requirement that each source include a minimum of six pixels at least 3 brighter than the sky level. Typically there were several X-ray sources with obvious and bright visible-wavelength counterparts in each field. These matches were used to fine tune the registration of the X-ray catalog to match the WCS solution for the visible-wavelength catalogs. Sources were targeted for spectroscopy if they were within a generous of the centroid of an X-ray source. Small band images of each X-ray source were also generated to inspect the quality of each match and the size of the X-ray PSF was considered in this inspection. The observed visible-wavelength photometry for all but three galaxies in our sample are provided in Table 2. The photometric measurements were obtained from SExtractor BEST magnitudes, which for these relatively crowded fields are a corrected isophotal magnitude calculated after subtraction of neighboring galaxies that may contaminate the photometry. These three galaxies fell outside (or at the edge) of the field of view of our TEK5 or WFCCD images and are discussed further below. Visible-wavelength images of all of these sources are shown in Figure 1 along with the 95% X-ray error circles. These error circles were calculated by generating fake sources with the MARX333http://space.mit.edu/CXC/MARX/ software and comparing their input positions to the measured positions with wavdetect. The distribution of the differences in position were used to calculate the 95% X-ray error circle, where the size of the error circle depends on off-axis angle and the number of counts from the source. This technique will be described in more detail in M. Kim et al. (2006, in prep). In all but two cases (Abell 3125-6 and Abell 3128-5) these images shown in Figure 1 are from our band observations. Images of the two exceptions were obtained from the Digitized Sky Survey.
2.3. Spectroscopy


The X-ray and visible-wavelength photometric catalogs were used to design multislit masks for spectroscopic observations with the LDSS-2 spectrograph on the 6.5m Clay telescope of the Magellan Project. All X-ray sources with band counterparts in our deep images from the du Pont telescope, corresponding to sources with mag, were given first priority. Second priority was assigned to other bright, resolved sources. Each mask included approximately 15 – 25 slits, where lower-redshift clusters typically had fewer sources per masks. We observed 3 – 10 masks per cluster and 5 – 10 X-ray sources per mask. All masks were designed with slit widths. For some of the lower-redshift clusters we also designed additional masks without X-ray sources in order to obtain more data on the cluster galaxy population. All of the X-ray sources were assigned to at least one multislit observation. Each mask was observed for between 1200 and 5400s, with longer observations for higher-redshift clusters. Flatfields and comparison lamps were observed before and/or after each mask. We obtained multislit observations for seven clusters and present new photometry and analysis of our previously-published spectra of the six galaxies in Abell 2104 (Martini et al., 2002).
The spectroscopic observations were processed with a series of custom Python scripts444Available at http://www.ociw.edu/ kelson. After a bias frame was subtracted from each raw data frame, the spatial and spectral distortions of each image were calculated from spectroscopic observations of flat field and HeNeAr comparison lamp observations, respectively, following the techniques described in Kelson et al. (2000). The comparison lamps were then used to calculate a fifth-order wavelength solution for each frame. The zeropoint of the wavelength solution was then recalculated from prominent night sky lines in the red region of the spectrum. The flatfield observations were used to correct the frames and the flats themselves for variable slit illumination and normalized flatfields were used to removing the effects of fringing from the spectra. A model for the night sky emission was then fit to each frame following the method described in Kelson (2003). After this sky model was subtracted from each frame, the centroids and spatial extent of the sources were tabulated for all of the observations of a given mask. One-dimensional spectra for each object were extracted from all of the observations of a given mask simultaneously using the B-spline algorithm described in Kelson (2006). This method accounted for the different distortions and dispersion solutions in each frame and generated linear output spectra with a dispersion of 5 Å pix-1. The spectra extend from 4000 Å to 9000 Å, except for some that fall near an edge of the mask. The final output spectrum for each source includes the object counts, the sky counts, and the signal-to-noise per pixel.
Redshifts for all of the sources were calculated using a cross-correlation technique in pixel space, rather than Fourier space, which has the advantage that each pixel may be weighted by the inverse of the variance, rather than assigned equal weight. This technique is more fully described in Kelson (2005). A number of our spectroscopic targets, both with and without X-ray emission, have previously published redshifts, including Abell 3125 and Abell 3128 (Rose et al., 2002), MS1008 (Yee et al., 1998), and AC 114 (Couch et al., 2001). These literature data were used to cross-check our redshift measurements as well as to determine the redshift range of likely cluster members. For clusters without published velocity dispersions, we conservatively estimated membership if the galaxies were within 2000 km s-1of the cluster mean velocity. Only one source (A1689-2) has a substantial offset of slightly over 4000 km s-1 from the cluster mean. This source is included in the cluster sample, although it is flagged with a in Table 2.
We have also flagged (with a ) seven sources whose visible-wavelength centroids are only marginally within the X-ray error circles. These sources could be either off-nuclear X-ray sources or chance superpositions of X-ray sources with a cluster member. The probability of a chance superposition of a cluster member with a background (or foreground) X-ray source depends strongly on the sensitivity of the Chandra dataset. From the X-ray log – log relation, we expect approximately 1000 X-ray sources per square degree, or about one every three square arcminutes (Kim et al., 2004b). This is comparable to the average surface density of cluster members to our absolute magnitude limit and therefore chance superpositions must be extremely rare. A second possibility is that the X-ray sources with large are associated with the cluster galaxies, but they are ultraluminous X-ray sources rather than nuclear emission. In this case their high luminosity ( erg s-1) makes this conclusion unlikely because known ultraluminous X-ray sources rarely have erg s-1 (Swartz et al., 2004).
The redshifts for the counterparts to all of the cluster X-ray sources are provided in Table 2. The star formation properties of this sample can be studied with measurements of the [O II] and H equivalent widths, where we have tabulated these values for our sample in Table 2 using the bandpass definitions from Fisher et al. (1998). We detect [O II] emission in five galaxies and H absorption in eight galaxies. Detection limits for the remaining sources vary, but typically are less than 2 Å. Table 2 also notes any other prominent emission lines or an AGN classification if the emission-line ratios suggest an AGN based on the standard diagnostic diagram of Baldwin et al. (1981). Spectra for these sources are shown in Figure 2, with the exception of the six sources in Abell 2104 published in Martini et al. (2002).
Table 4 lists the absolute band magnitude for each galaxy. Corrections for bandpass shifting and stellar evolution have been applied based on a simple stellar population model with solar metallicity and formation redshift of (Bruzual & Charlot, 2003). This model was also used to correct the colors to the rest-frame values shown in the relevant figures. We estimated the spectroscopic completeness for these observations by calculating the fraction of spectroscopic candidates with redshifts as a function of band magnitude. The 95% completeness varies between mag and increases for higher-redshift clusters. For all of the clusters our redshift catalog is complete for all X-ray counterparts with rest-frame mag.
| ID | (Broad) | (Soft) | (Hard) | (Broad) | (Soft) | (Hard) | |
|---|---|---|---|---|---|---|---|
| (1) | (2) | (3) | (4) | (5) | (6) | (7) | (8) |
| —————— erg s-1cm-2 —————— | —————— erg s-1—————— | ||||||
| A3125-1 | -21.19 | 2.6e-14 (7.0e-15) | 2.6e-14 (7.1e-15) | … | 2.3e+41 | 2.3e+41 | … |
| A3125-2 | -22.02 | 2.1e-14 (7.6e-15) | 2.3e-14 (7.6e-15) | … | 1.9e+41 | 2.0e+41 | … |
| A3125-3 | -21.86 | 9.5e-15 (5.1e-15) | 1.1e-14 (5.3e-15) | … | 8.2e+40 | 9.6e+40 | … |
| A3125-4 | -21.86 | 9.7e-15 (5.0e-15) | 7.9e-15 (4.8e-15) | … | 8.4e+40 | 6.9e+40 | … |
| A3125-5 | -21.04 | 3.4e-14 (8.3e-15) | 1.6e-14 (6.4e-15) | 9.4e-15 (3.3e-15) | 2.9e+41 | 1.4e+41 | 8.2e+40 |
| A3125-6 | … | 2.4e-14 (9.3e-15) | 2.3e-14 (8.8e-15) | … | 2.1e+41 | 2.0e+41 | … |
| A3128-1 | -21.65 | 1.2e-14 (3.4e-15) | 1.1e-14 (3.5e-15) | … | 1.0e+41 | 9.9e+40 | … |
| A3128-2 | -19.96 | 1.1e-13 (9.1e-15) | 8.3e-14 (8.2e-15) | 1.7e-14 (2.7e-15) | 9.9e+41 | 7.5e+41 | 1.6e+41 |
| A3128-3 | … | 1.0e-14 (4.1e-15) | 8.0e-15 (3.7e-15) | 1.4e-15 (1.4e-15) | 8.9e+40 | 7.2e+40 | 1.2e+40 |
| A3128-4 | -22.12 | 6.0e-14 (6.8e-15) | 6.2e-14 (7.0e-15) | … | 5.4e+41 | 5.6e+41 | … |
| A3128-5 | … | 9.5e-15 (4.1e-15) | 7.0e-15 (3.6e-15) | 1.4e-15 (1.4e-15) | 8.5e+40 | 6.3e+40 | 1.2e+40 |
| A3128-6 | -20.20 | 1.2e-13 (8.4e-15) | 9.5e-14 (7.8e-15) | 1.1e-14 (2.1e-15) | 1.0e+42 | 8.5e+41 | 9.9e+40 |
| A3128-7 | -22.01 | 1.9e-14 (4.2e-15) | 2.0e-14 (4.2e-15) | … | 1.7e+41 | 1.8e+41 | … |
| A3128-8 | -21.85 | 1.5e-14 (4.7e-15) | 1.2e-14 (4.3e-15) | 1.9e-15 (1.3e-15) | 1.4e+41 | 1.0e+41 | 1.7e+40 |
| A3128-9 | -20.66 | 1.5e-14 (3.9e-15) | 1.2e-14 (3.5e-15) | 1.9e-15 (1.2e-15) | 1.4e+41 | 1.0e+41 | 1.7e+40 |
| A3128-10 | -22.22 | 2.5e-14 (5.0e-15) | 2.6e-14 (5.1e-15) | … | 2.3e+41 | 2.3e+41 | … |
| A644-1 | -20.61 | 1.0e-13 (6.9e-15) | 6.4e-14 (5.4e-15) | 1.7e-14 (2.1e-15) | 1.3e+42 | 8.0e+41 | 2.1e+41 |
| A644-2 | -21.58 | 1.3e-14 (3.4e-15) | 2.6e-15 (2.1e-15) | 5.2e-15 (1.5e-15) | 1.7e+41 | 3.3e+40 | 6.5e+40 |
| A2104-1 | -22.06 | 5.5e-13 (9.1e-15) | 1.1e-13 (2.6e-15) | 1.7e-13 (4.0e-15) | 4.0e+43 | 7.9e+42 | 1.2e+43 |
| A2104-2 | -20.71 | 1.1e-14 (1.4e-15) | 1.3e-15 (3.6e-16) | 4.9e-15 (7.4e-16) | 7.9e+41 | 9.4e+40 | 3.5e+41 |
| A2104-3 | -22.20 | 4.0e-15 (9.9e-16) | 1.7e-15 (4.0e-16) | … | 2.9e+41 | 1.2e+41 | … |
| A2104-4 | -19.76 | 4.0e-15 (1.2e-15) | 1.8e-15 (4.9e-16) | … | 2.9e+41 | 1.3e+41 | … |
| A2104-5 | -19.80 | 2.3e-14 (2.0e-15) | 7.9e-15 (7.5e-16) | 2.5e-15 (5.6e-16) | 1.7e+42 | 5.7e+41 | 1.8e+41 |
| A2104-6 | -21.59 | 4.0e-15 (1.0e-15) | 7.0e-16 (3.2e-16) | 1.4e-15 (4.6e-16) | 2.9e+41 | 5.1e+40 | 1.0e+41 |
| A1689-1 | -22.00 | 1.2e-14 (5.3e-15) | 1.3e-14 (5.8e-15) | … | 1.2e+42 | 1.3e+42 | … |
| A1689-2 | -21.41 | 1.8e-14 (6.2e-15) | 1.4e-14 (6.1e-15) | 2.5e-15 (2.0e-15) | 1.9e+42 | 1.5e+42 | 2.7e+41 |
| A2163-1 | -22.24 | 2.8e-14 (2.5e-15) | 1.8e-15 (9.1e-16) | 1.3e-14 (1.2e-15) | 3.8e+42 | 2.4e+41 | 1.7e+42 |
| A2163-2 | -19.96 | 5.6e-15 (1.2e-15) | 3.5e-15 (8.4e-16) | 8.3e-16 (3.7e-16) | 7.6e+41 | 4.8e+41 | 1.1e+41 |
| A2163-3 | -21.66 | 2.0e-15 (9.0e-16) | 1.8e-15 (7.1e-16) | … | 2.7e+41 | 2.4e+41 | … |
| MS1008-1 | -21.35 | 3.3e-15 (1.7e-15) | 1.7e-15 (1.3e-15) | 7.5e-16 (6.9e-16) | 1.2e+42 | 5.9e+41 | 2.6e+41 |
| MS1008-2 | -19.42 | 2.0e-15 (1.0e-15) | 1.2e-15 (8.1e-16) | … | 7.0e+41 | 4.2e+41 | … |
| MS1008-3 | -21.78 | 1.8e-14 (2.6e-15) | 1.2e-14 (2.0e-15) | 2.1e-15 (7.4e-16) | 6.3e+42 | 4.2e+42 | 7.3e+41 |
| MS1008-4 | -21.24 | 2.2e-15 (1.2e-15) | 1.6e-15 (9.6e-16) | … | 7.7e+41 | 5.6e+41 | … |
| MS1008-5 | -21.99 | 9.7e-15 (2.9e-15) | 6.6e-15 (2.3e-15) | 1.1e-15 (8.0e-16) | 3.4e+42 | 2.3e+42 | 3.8e+41 |
| AC114-1 | -21.03 | 8.1e-14 (2.8e-15) | 4.3e-14 (1.5e-15) | 1.2e-15 (3.6e-16) | 3.1e+43 | 1.7e+43 | 4.6e+41 |
| AC114-2 | -19.62 | 4.1e-15 (9.6e-16) | 1.5e-15 (4.6e-16) | 8.5e-16 (3.3e-16) | 1.6e+42 | 5.6e+41 | 3.2e+41 |
| AC114-3 | -21.78 | 1.1e-14 (1.1e-15) | 5.2e-15 (5.8e-16) | 7.8e-16 (2.9e-16) | 4.2e+42 | 1.9e+42 | 3.0e+41 |
| AC114-4 | -20.06 | 5.4e-15 (8.3e-16) | 1.1e-15 (3.1e-16) | 2.2e-15 (4.2e-16) | 2.0e+42 | 4.2e+41 | 8.4e+41 |
| AC114-5 | -20.02 | 7.7e-16 (5.2e-16) | 3.1e-16 (2.6e-16) | … | 2.9e+41 | 1.2e+41 | … |
| AC114-6 | -22.90 | 6.7e-16 (5.3e-16) | 3.5e-16 (2.7e-16) | … | 2.5e+41 | 1.3e+41 | … |
Note. — Absolute, rest-frame magnitude , observed X-ray fluxes, and rest-frame X-ray luminosities. The X-ray fluxes and luminosities were determined with a power law and Galactic absorption.
3. Results
We have identified a total of 40 galaxies with X-ray emission in eight clusters, corresponding to between two and ten X-ray sources per cluster. Thirty four of these cluster members are new to this study, while six were published in our previous study of Abell 2104. Of these 34 new galaxies, we identified 29 with our spectroscopic observations and five additional sources from cross-correlating our X-ray sources with redshift data from the literature. References to these sources are provided in the caption to Table 2.
As noted above, several of these sources were previously known to be cluster members, although only the Smith (2003) study of A3128 previously studied the X-ray emission. He noted that our sources A3128-2 and A3128-6 had hard X-ray spectra and may be AGN, while of the three other galaxies A3128-7 and A3128-10 appeared to be normal E/SOs and A3128-6 was an E/SO with some shell structure. In the next sections below we describe the photometric and spectroscopic properties of this sample of cluster galaxies with X-ray emission. We then use these results to identify the likely physical mechanisms responsible for the X-ray emission and calculate the fraction of cluster galaxies that host AGN.
3.1. Visible-wavelength data

The band images of these galaxies (Figure 1) show that most appear to be early-type galaxies, consistent with the morphological type most commonly found at the centers of rich clusters. This is particularly true of the lowest-redshift () clusters, where all galaxies except for A3125-5 appear to be Es or S0s. Six of the 40 galaxies show obvious signs of interactions.
The left panel of Figure 3 presents a color-magnitude diagram of vs. and demonstrates that the X-ray counterparts with emission lines, particularly those with obvious AGN spectra signatures, tend to be bluer than galaxies that do not exhibit bright emission lines. This result is more pronounced when all of the lower-redshift (; large symbols) galaxies are compared separately from the higher-redshift () galaxies. Two of the four galaxies with AGN spectral signatures are the bluest galaxies in the sample. Sources with other strong emission lines, such as H, [O II], or [O III] also tend to be substantially bluer than the other galaxies. In the lower-redshift subsample the emission-line galaxies are among the fainter sources, while in the higher-redshift subsample the obvious AGN and other emission line galaxies tend to be in the brighter half of the distribution. This is shown in right panel of Figure 3, which plots vs. . This figure demonstrates that the emission-line galaxies do not tend to reside in the most luminous host galaxies, but rather in galaxies only slightly more luminous than the knee of the galaxy luminosity function mag (Christlein & Zabludoff, 2003).

We use the [O II] and H equivalent widths as estimators of the star formation history of these X-ray sources, where the [O II] equivalent width is a measure of current star formation and H is a measure of the remnant population of a significant starburst in the recent past. Figure 4 illustrates the location of our sample galaxies in this parameter space, along with the spectral classification scheme developed by Dressler et al. (1999). Only three of these galaxies are classified as e(c) and have [O II] widths greater than 5 Å and moderate Balmer absorption. Two galaxies have no detected [O II], but H greater than 3 Å indicative of moderate to strong Balmer absorption. The most extreme case is AC114-1, whose spectrum exhibits a strong Balmer series and is a borderline poststarburst galaxy. Most of the galaxies in this sample show no strong [O II] or H.
3.2. X-ray Colors and Quantiles
X-ray colors offer a simple means of quantifying the properties of X-ray sources. As the X-ray colors are calculated directly from count rates, the correspondence between colors and spectral properties, such as power-law shape, depend on the energy sensitivity of a given detector. These differences are particularly acute between the front-illuminated (FI) ACIS-I (CCDs 0 through 3) and the back-illuminated (BI) ACIS-S (CCDs 5 and 7) and consequently we have calculated the conversion between X-ray colors and spectral properties for the ACIS-I and ACIS-S observations separately. The primary cause of this difference is that the BI chips are more sensitive to very soft X-ray photons ( keV) and therefore a given source will, for example, register a larger count rate if observed with a BI chip relative to an FI chip.
Figure 5 displays the X-ray colors C32 vs. C21 for the FI and BI chips, along with grids that demonstrate the location of an absorbed power-law with and cm-2. The different shapes of the grids in the two panels reflects the substantial differences in the energy sensitivity of the FI and BI CCDs. The relative energy sensitivity of the chips change slightly with time and the grids shown are based on the average sensitivity of these observations. Sources are only shown if they have at least three counts in the , , and bands (see Table 3). Nearly all of the sources shown in the figure are consistent with and at most modest ( cm-2) absorption. Those that do not include the spectroscopically-identified AGN (filled circles) and indicate that an absorbed power-law is too simplistic a model for some of these sources. An absorbed power-law combined with emission from hot gas may be a better fit to these cases, although we lack sufficient signal-to-noise for detailed spectral modeling.

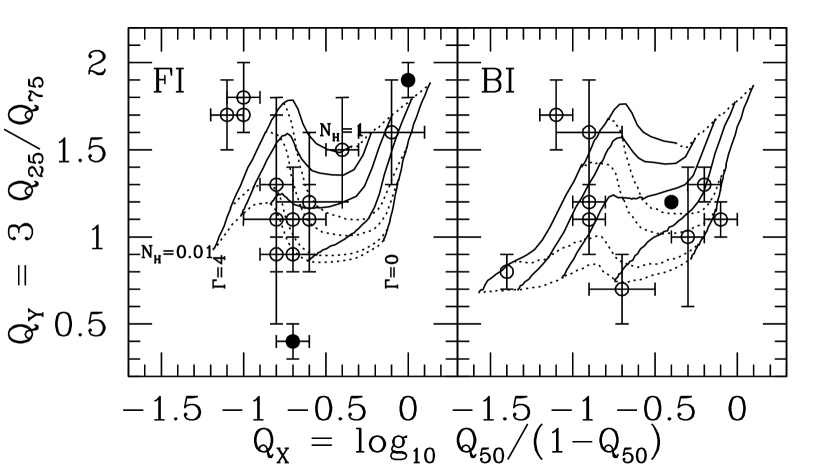
In a recent paper, Hong et al. (2004) argued that this traditional approach of using X-ray colors in predetermined bands is strongly biased toward particular values of and (for an assumed power-law model). These authors show that the bands used to define the colors used in Figure 5 can classify sources with and modest absorption with only a few counts, while there will be substantial uncertainties in the classification of substantially softer, harder, and/or more obscured sources. Effectively, a source with higher or lower must be detected with substantially higher counts in order to fall in much of the traditional X-ray color space. The common adoption of an unobscured power-law for typical X-ray sources may therefore be the result of selection effects due to the band definitions, rather than a reflection of the ubiquity and appropriateness of this model for faint X-ray sources. In Figure 6 we plot the X-ray quantiles defined in Section 2.1 along with the same grids of and shown in Figure 5 (the approximate axes of and are rotated by degrees). As in Figure 5, most of the sources are concentrated at low and , although there are many more very soft sources (large ) and several more hard sources than is apparent from the X-ray colors. As in the previous figure, the most significant outliers include the spectroscopically-confirmed AGN. This confirms our conclusion based on Figure 5 that a simple, absorbed power-law model is not a good fit to even the obvious low-luminosity AGN, although more counts would be required to explore a wider parameter space of models.
3.3. Visible to X-ray Properties

Taken separately, the previous two sections present an apparent contradiction: From the visible-wavelength data alone, it appears that only four of these 40 X-ray sources are AGN and the remainder are galaxies with modest star formation or passively-evolving galaxies. In contrast, the X-ray data indicate that most of these sources are quite luminous in X-rays and many are consistent with the unobscured, power laws typical of AGN. Furthermore, the spectroscopically-identified AGN are those least consistent with unobscured, power law emission. Here we investigate the visible to X-ray properties of these sources in order to resolve this contradiction.
If the X-ray emission from these galaxies is predominantly due to AGN and the X-ray to visible-wavelength flux ratio is constant for AGN, then the galaxies with AGN spectral signatures and bluer colors should be among the most X-ray luminous sources. We test this hypothesis in Figure 7 with a plot of vs. broad band X-ray luminosity. This figure shows that only one555This is A2104-1, which was determined to be highly obscured by Martini et al. (2002). The second most X-ray luminous galaxy is AC114-1, which has a post-starburst spectrum. spectroscopically identifiable AGN is among the most X-ray luminous galaxies. Most of the X-ray sources with erg s-1 do not show AGN spectral signatures, although we note that all of these galaxies are above and such signatures are more easily diluted by host galaxy starlight. These galaxies are generally not significantly bluer than other galaxies in these clusters, although some would be classified as Butcher-Oemler galaxies (Butcher & Oemler, 1978).

The visible – X-ray flux ratio can be another indicator of the presence of an AGN, as opposed to LMXBs or hot gas, because AGN have higher compared to other galaxies. In Figure 8 we plot and vs. the soft X-ray to band flux ratio. This figure is similar to Figure 8 of Kim et al. (2004b), which those authors use to separate various types of X-ray emitting galaxies in the CHaMP survey (see also Green et al., 2004). The region to the right of the dashed vertical line at and bluer than is their locus for blue quasars. Sources with redder colors still have excess X-ray emission over that expected for hot X-ray halos or LMXBs and may therefore be obscured AGN. The very red A2104-1 is an excellent example of an obscured AGN with red visible-wavelength colors and excess X-ray emission. The other extreme source in this figure (at , ) is the poststarburst galaxy AC114-1, which has an extremely soft X-ray spectrum. Less than a third of our sample is located in their quasar regime defined by and in Figure 8, although this is not surprising as none of these X-ray sources have quasar luminosities ( erg s-1) and therefore the band flux could include a contribution from stars. In fact nearly all of our spectra are dominated by host galaxy starlight. We investigate the ratio as a function of in the lower panel of Figure 8 in order to determine the typical host galaxy luminosity of sources with large . This figure demonstrates that most of the sources with large are in approximately or fainter galaxies and are above . The absence of low-luminosity galaxies with small is due to the sensitivity limit of the X-ray observations. While our spectroscopic observations are complete to mag, the X-ray observations are only sensitive to galaxies with small in these clusters if they have luminous host galaxies. In contrast, the increasing number of luminous galaxies with lower is significant. For luminous galaxies this illustrates that they are more likely to host a faint X-ray source than a bright one.

Unlike the case for low-luminosity AGN, there is a relatively tight relation between X-ray and visible-wavelength flux for galaxies with X-ray emission due to LMXBs (Canizares et al., 1987). This relation has been studied in detail with Chandra observations of nearby elliptical galaxies (e.g. Sarazin et al., 2001; Blanton et al., 2001; Helsdon et al., 2001; Jeltema et al., 2003; Gilfanov, 2004). In a recent paper Kim & Fabbiano (2004) derived the relation erg s-1 based on broad-band X-ray measurements of 14 luminous, nearby galaxies. Figure 9 shows the broad band vs. for our sample, along with the galaxies measured by Kim & Fabbiano (2004) and the band that defines the scatter in the ratio for LMXBs. This figure shows that all of these galaxies are more X-ray luminous than would be expected from LMXB emission alone, although several galaxies are marginally consistent with the LMXB relation.

X-ray emission from the hot interstellar medium in early-type galaxies may also make a significant contribution to the total X-ray luminosity. The X-ray spectra of hot gas emission should be substantially softer than AGN emission, however most of the X-ray sources lack sufficient counts to use this as a discriminant. Instead, we compare these sources to the relation observed for local early-type galaxies (Matsushita, 2001; Yamasaki et al., 2002). Figure 10 shows soft X-ray luminosity vs. for our sample along with the literature relation from O’Sullivan et al. (2003) and several measurements of early-type galaxies in Abell 1367 with Chandra from Sun et al. (2005). The measurements of early-type in Abell 1367 galaxies are a particularly relevant comparison sample because the ratio is generally larger for galaxies in rich environments, provided the environments are not so rich and the galaxies have such high relative velocities that ram pressure stripping is significant (Brown & Bregman, 2000).
4. Discussion
All of our sources have at least seven counts in the broad (0.3-8 keV) X-ray band. Seven counts correspond to broad band X-ray luminosities ranging from erg s-1(A644) to erg s-1(A1689) for an unobscured power law and Galactic absorption. When we combine the X-ray sensitivity with our spectroscopic completeness, we can conservatively state that we are sensitive to all X-ray sources more luminous than erg s-1and host galaxies with mag in these eight clusters, although we are sensitive to substantially less X-ray luminous galaxies in most of the clusters.
4.1. Nature of the X-ray Emission
Only four X-ray sources in our sample (A644-1, A2104-1, A1689-2, A2163-1) are both X-ray luminous erg s-1 and exhibit the emission-line signatures of AGN. Ten additional galaxies are above erg s-1 and therefore are most likely AGN, but at progressively fainter X-ray luminosities an increasing number of physical mechanisms can produce luminous X-ray emission, particularly a population of LMXBs, thermal emission from a hot, gaseous halo, and star formation. Of these three mechanisms, we rule out star formation for these cluster sources because the observed H or [O II] luminosities indicate low star formation rates that could not produce the observed X-ray luminosities (e.g. Ranalli et al., 2003; Hornschemeier et al., 2005).
While the less luminous sources lack sufficient counts for detailed spectral fitting, most with at least moderate signal-to-noise ratio X-ray detections are consistent with a power law (see Figures 5 and 6). The sources with softer X-ray spectra could be due to thermal bremsstrahlung or may be Compton-thick AGN. Our strongest arguments against emission from LMXBs or hot, gaseous halos are the ratios of the X-ray to B-band luminosities of the galaxies. From Figures 9 and 10, all but three sources are more X-ray luminous than either the relation for LMXBs or hot halos (two of the three are consistent with both relations), or 34 of 37 sources with visible-wavelength photometry. As noted above in section 2.1, all of these sources are unresolved, which strengthens the argument against an LMXB or hot halo origin for the lower-redshift clusters.
There are three additional cluster X-ray sources that are not in the figures because we do not have B-band observations. Two of the three were detected in the hard X-ray band and one with sufficient counts to determine that it is consistent with an AGN. If we conservatively assume the other two sources are not AGN, along with the three mentioned previously that are statistically consistent with the LMXB or hot gas relation, we conclude that at least 35 of these 40 X-ray sources are AGN.
4.2. AGN Fraction in Clusters
We calculate the fraction of cluster galaxies that host AGN by dividing the number of cluster AGN by an estimate of the total number of cluster members to our absolute-magnitude spectroscopic limit within the field of the Chandra observation. Along with our spectroscopic survey of X-ray sources, we also obtained spectra of many candidate cluster members to measure the cluster velocity dispersion and more generally characterize the cluster galaxy population. We first calculate the fraction of all (non X-ray) spectroscopic targets to some magnitude limit that are cluster members. Then the total number of cluster galaxies to this magnitude limit is , the magnitude limit corresponds to the same for all clusters, and is the total galaxy population to this magnitude limit. The cluster AGN fraction is then .
We estimated the total number of galaxies in each cluster to a uniform absolute magnitude of mag, which was set by the spectroscopic completeness of our observations of the more distant clusters. Our success rate at identifying cluster members varied from 19 to 44% based on spectroscopic redshifts for between 12 and 54 cluster members not targeted as X-ray sources. These calculations yield an X-ray source fraction of % for the seven new clusters and confirms our previous result based on just one cluster (Martini et al., 2002). The six cluster members fainter than mag in Table 4 are not included in this calculation.
The AGN fraction is more meaningfully compared to other surveys with a constraint on AGN luminosity in addition to galaxy stellar luminosity. We use the X-ray sensitivity of our observations to constrain the AGN fraction to be the fraction of AGN above a broad-band X-ray luminosity of erg s-1. Nearly all of these X-ray observations would detect an X-ray source more luminous than this and all but four of our 40 X-ray sources are above this luminosity. The four sources eliminated by this luminosity cut include all but one of those least likely to be AGN based on X-ray to visible-wavelength flux ratio. We find that the fraction of galaxies brighter than mag that host AGN more luminous than erg s-1 is magerg s-1%. The quoted uncertainty corresponds to 90% one-sided confidence limits calculated from Poisson statistics (Gehrels, 1986). We may have underestimated the true AGN fraction because our X-ray sensitivity is a factor of five above erg s-1 for two clusters (A1689 and MS1008) and therefore these clusters may contain additional AGN below our X-ray limit and more luminous than erg s-1. The advantage of this lower luminosity limit is that it maximizes the number of X-ray sources in cluster members and the statistical significance of the detection.
While there are only a small number of AGN per cluster, we do find evidence for substantial variation in the AGN fraction from cluster to cluster, most notably a substantially higher AGN fraction in Abell 3128 relative to Abell 644, even though the Abell 644 X-ray observations are more sensitive. We plan to explore this aspect of our data in a future paper (Martini et al. 2006, in prep) that will include a more detailed completeness study. We note uncertainties in the present completeness calculation may introduce systematic errors in the AGN fraction that are larger than the statistical errors.
The AGN fraction we find in clusters is approximately a factor of five times higher than the visible-wavelength spectroscopic survey of Dressler et al. (1985), who found a % AGN fraction (see also Dressler et al., 1999). However, when we just calculate the cluster AGN fraction from those identified in visible-wavelength spectroscopy, our results are completely consistent with the Dressler et al. (1985) result. This has some interesting implications for the field AGN fraction, which these authors found was approximately five times higher than the cluster fraction. If the properties of cluster and field AGN are similar, then there are simply five times fewer AGN in clusters. A survey with similar selection criteria to this one should then identify a field AGN fraction of %.
4.3. Contribution to the X-ray Source Density
We can also use these data to address the origin of the apparent excess of X-ray sources observed toward the fields of other clusters observed by Chandra. The excesses take the form of overdensities in the log N – log S relation and have been reported in the soft (Ruderman & Ebeling, 2005) and hard X-ray bands (e.g. Cappelluti et al., 2005), although not for all cluster fields (Kim et al., 2004b). Our redshift measurements allow us to directly address whether or not the X-ray sources in these eight clusters add appreciably to the X-ray surface density. We address this question on a cluster by cluster basis by measuring the flux-limited fraction of sources that are members of a given cluster. For each of our fields, we have counted the number of sources brighter than some limiting soft X-ray flux and calculated the fraction of these sources that are cluster members. This effectively integrates log N – log S for the field to the flux limit of the observation, where we have adopted a flux limit corresponding to five counts in the soft X-ray band at the aimpoint and adopted a model with and only Galactic absorption. The five count soft-band threshold was chosen because it is comparable in signal-to-noise ratio to our seven count broad-band threshold. This threshold includes all but one of our cluster sources (MS1008-1).
We find that the cluster X-ray sources contribute up to 20% of the soft X-ray point source density in these fields. For each field we use Poisson statistics (Gehrels, 1986) to calculate the one-sided confidence limits from the number of nonmembers. For three of these eight clusters, the point sources due to cluster members constitute a excess, and are slightly more significant for a fourth (A3128). These marginally significant excesses are similar to the results toward cluster fields without membership information, particularly the Ruderman & Ebeling (2005) study that identified an excess surface density from a sample of 51 clusters. Two differences between our data and their MACS sample are that the later data have a shallower luminosity threshold and encompass a larger fraction of the total cluster size because the MACS clusters tend to be at higher redshift. The absence of an overdensity of X-ray sources in the Kim et al. (2004b) study, in contrast, may be due to their preference for clusters whose intracluster medium subtends only a small fraction (less than 10%) of the field (Kim et al., 2004a) with the result that their sample of 29 cluster fields is dominated by high-redshift clusters. Only the most luminous cluster members could therefore be detected in these images. In addition, as Kim et al. (2004b) note, their cluster fields were mostly obtained with ACIS-I and any cluster signal may also be diluted by field contamination due to the large field of view.

The redshift range and various sensitivity limits of these eight clusters can be used to explore the importance of these quantities in detecting X-ray source excesses in other cluster fields. In the top panels of Figure 11 we show that there are no obvious trends with either flux limit or redshift, in spite of the approximately factor of ten variation in sensitivity. This lack of variation may be due in part to the fact that the more distant cluster observations were chosen to be more sensitive and therefore the observations have a narrower range in luminosity sensitivity than flux sensitivity, although this could be offset by higher field contamination at fainter flux limits. Indeed three of the four clusters with marginally-significant excesses, which correspond to those with greater than 10% cluster contributions, are at . We note that we are neglecting the fact that the flux limit will rise with increasing off-axis angle because both the cluster and field X-ray sources will experience the same effect, although could nevertheless be a bias toward a higher cluster fraction if the cluster sources are more centrally concentrated within the ACIS field of view.
The radial distribution of cluster sources is also important because the fixed angular size of the Chandra observations subtends a substantially smaller fraction of a given cluster at lower-redshift. For example, the approximately wide ACIS-I field of view corresponds to only 1.2 Mpc at , but over 4.5 Mpc at . We have investigated the importance of aperture size by calculating the fraction of cluster X-ray sources within a fixed physical radius of 0.5 Mpc for all eight clusters. This physical aperture size is the largest that is contained within the Chandra images of all eight clusters, particularly the two lowest-redshift clusters, and also happens to be the physical radius within which Ruderman & Ebeling (2005) observed the most significant overdensity of X-ray sources. Within this aperture size we now measure fractions as high as % for one cluster (AC114), although we still measure % or less for most (six clusters; all but MS1008 and AC114) The fractional contribution of sources within 0.5 Mpc as a function of limiting soft X-ray flux and redshift are shown in the bottom panels of Figure 11. If we now repeat the same experiment described above to determine if the cluster members make a statistically-significant contribution to the surface density within an 0.5 Mpc aperture, the cluster X-ray sources in A3128 and AC114 are excesses over the number of other X-ray sources, while MS1008 sources make only a marginal contribution. We note that the excess noted by (Ruderman & Ebeling, 2005) in their sample of 51 clusters is consistent with a excess per cluster summed in over their sample. While the fraction of cluster members does appear highest for the two highest-redshift clusters, the present sample of clusters is too small for us to claim the presence of redshift dependence in the cluster AGN population.
5. Summary
We have completed a redshift survey and multiwavelength study of X-ray sources in the fields of eight clusters of galaxies and discovered luminous X-ray emission from 40 galaxies. Emission-lines, X-ray spectral properties, and X-ray to visible-wavelength flux ratios were used to determine that the vast majority of these sources are low-luminosity AGN. We conservatively estimate that at least 35 of these 40 sources are AGN in the clusters and estimate that the AGN fraction in clusters is %, that is % of all cluster galaxies more luminous than mag host AGN with broad-band X-ray luminosities greater than erg s-1.
Only a small fraction of these galaxies would be classified as AGN from their visible-wavelength spectra. In most instances the AGN identification is due to X-ray spectral shape or X-ray to visible-wavelength flux ratios. In particular, the multiwavelength properties of these sources are used to show that they are more X-ray luminous for their observed B-band luminosity than would be expected for either a population of LMXBs or hot, gaseous halos that have survived in the intracluster medium.
The X-ray sources in these clusters do not make a statistically significant contribution to the surface density in any one of these Chandra observations, although summation of a sufficient number of similar clusters would produce a statistically significant excess similar to those observed in stacked Chandra observations of other cluster fields. We therefore conclude there is a sufficiently large population of X-ray sources in clusters of galaxies to explain the observed point source excess.
This population of cluster AGN is a factor of five higher than expected from previous spectroscopic surveys. We attribute our higher success rate to the fact that optical searches for AGN are strongly biased against detection of low-luminosity AGN because of host galaxy dilution and obscuration. AGN with yet lower X-ray luminosities are likely present in other luminous cluster galaxies, or equivalently the AGN fraction should increase with a lower threshold, although they may prove difficult to discriminate from emission due to LMXBs or hot gas in the absence of substantially higher signal-to-noise ratio data. Our result also has interesting implications for a higher field AGN fraction. If the AGN fraction in the field is five times the cluster AGN fraction, as found by Dressler and collaborators for uniformly-selected samples of field and cluster galaxies, then similar selection criteria to this study will identify a field AGN fraction of %.
The substantial number of cluster galaxies hosting AGN suggests that cluster galaxies can retain significant reservoirs of cold gas near their central, supermassive black holes. These AGN, and others currently dormant, may have significantly contributed to heating the intracluster medium and driving galaxy evolution via feedback processes at higher redshift. Future observations of AGN and measurements of the AGN fraction in higher-redshift clusters may provide valuable new insights into cluster assembly and galaxy evolution in clusters.
References
- Baldwin et al. (1981) Baldwin, J. A., Phillips, M. M., & Terlevich, R. 1981, PASP, 93, 5
- Barnes & Hernquist (1992) Barnes, J. E. & Hernquist, L. 1992, ARA&A, 30, 705
- Bertin & Arnouts (1996) Bertin, E. & Arnouts, S. 1996, A&AS, 117, 393
- Best (2004) Best, P. N. 2004, MNRAS, 351, 70
- Blanton et al. (2001) Blanton, E. L., Sarazin, C. L., & Irwin, J. A. 2001, ApJ, 552, 106
- Brandt & Hasinger (2005) Brandt, W. N. & Hasinger, G. 2005, ARA&A, 43, 827
- Brown & Bregman (2000) Brown, B. A. & Bregman, J. N. 2000, ApJ, 539, 592
- Bruzual & Charlot (2003) Bruzual, G. & Charlot, S. 2003, MNRAS, 344, 1000
- Butcher & Oemler (1978) Butcher, H. & Oemler, A. 1978, ApJ, 219, 18
- Caldwell & Rose (1997) Caldwell, N. & Rose, J. A. 1997, AJ, 113, 492
- Canizares et al. (1987) Canizares, C. R., Fabbiano, G., & Trinchieri, G. 1987, ApJ, 312, 503
- Cappelluti et al. (2005) Cappelluti, N., Cappi, M., Dadina, M., Malaguti, G., Branchesi, M., D’Elia, V., & Palumbo, G. G. C. 2005, A&A, 430, 39
- Cappi et al. (2001) Cappi, M., Mazzotta, P., Elvis, M., Burke, D. J., Comastri, A., Fiore, F., Forman, W., Fruscione, A., Green, P., Harris, D., Hooper, E. J., Jones, C., Kaastra, J. S., Kellogg, E., Murray, S., McNamara, B., Nicastro, F., Ponman, T. J., Schlegel, E. M., Siemiginowska, A., Tananbaum, H., Vikhlinin, A., Virani, S., & Wilkes, B. 2001, ApJ, 548, 624
- Carroll et al. (1992) Carroll, S. M. and Press, W. H. and Turner, E. L., 1992, ARA&A, 30, 499
- Christlein & Zabludoff (2003) Christlein, D. & Zabludoff, A. I. 2003, ApJ, 591, 764
- Couch et al. (2001) Couch, W. J., Balogh, M. L., Bower, R. G., Smail, I., Glazebrook, K., & Taylor, M. 2001, ApJ, 549, 820
- Couch & Newell (1984) Couch, W. J. & Newell, E. B. 1984, ApJS, 56, 143
- Davis et al. (2003) Davis, D. S., Miller, N. A., & Mushotzky, R. F. 2003, ApJ, 597, 202
- Dressler (1980) Dressler, A. 1980, ApJ, 236, 351
- Dressler et al. (1999) Dressler, A., Smail, I., Poggianti, B. M., Butcher, H., Couch, W. J., Ellis, R. S., & Oemler, A. J. 1999, ApJS, 122, 51
- Dressler et al. (1985) Dressler, A., Thompson, I. B., & Shectman, S. A. 1985, ApJ, 288, 481
- Ebeling et al. (2001) Ebeling, H., Edge, A. C., & Henry, J. P. 2001, ApJ, 553, 668
- Finoguenov et al. (2004) Finoguenov, A., Briel, U. G., Henry, J. P., Gavazzi, G., Iglesias-Paramo, J., & Boselli, A. 2004, A&A, 419, 47
- Fisher et al. (1998) Fisher, D., Fabricant, D., Franx, M., & van Dokkum, P. 1998, ApJ, 498, 195
- Gehrels (1986) Gehrels, N. 1986, ApJ, 303, 336
- Gilfanov (2004) Gilfanov, M. 2004, MNRAS, 349, 146
- Giovanelli & Haynes (1985) Giovanelli, R. & Haynes, M. P. 1985, ApJ, 292, 404
- Gisler (1978) Gisler, G. R. 1978, MNRAS, 183, 633
- Green et al. (2004) Green, P. J., Silverman, J. D., Cameron, R. A., Kim, D.-W., Wilkes, B. J., Barkhouse, W. A., LaCluyzé, A., Morris, D., Mossman, A., Ghosh, H., Grimes, J. P., Jannuzi, B. T., Tananbaum, H., Aldcroft, T. L., Baldwin, J. A., Chaffee, F. H., Dey, A., Dosaj, A., Evans, N. R., Fan, X., Foltz, C., Gaetz, T., Hooper, E. J., Kashyap, V. L., Mathur, S., McGarry, M. B., Romero-Colmenero, E., Smith, M. G., Smith, P. S., Smith, R. C., Torres, G., Vikhlinin, A., & Wik, D. R. 2004, ApJS, 150, 43
- Helsdon et al. (2001) Helsdon, S. F., Ponman, T. J., O’Sullivan, E., & Forbes, D. A. 2001, MNRAS, 325, 693
- Hong et al. (2004) Hong, J., Schlegel, E. M., & Grindlay, J. E. 2004, ApJ, 614, 508
- Hornschemeier et al. (2001) Hornschemeier, A. E., Brandt, W. N., Garmire, G. P., Schneider, D. P., Barger, A. J., Broos, P. S., Cowie, L. L., Townsley, L. K., Bautz, M. W., Burrows, D. N., Chartas, G., Feigelson, E. D., Griffiths, R. E., Lumb, D., Nousek, J. A., Ramsey, L. W., & Sargent, W. L. W. 2001, ApJ, 554, 742
- Hornschemeier et al. (2005) Hornschemeier, A. E., Heckman, T. M., Ptak, A. F., Tremonti, C. A., & Colbert, E. J. M. 2005, AJ, 129, 86
- Iwasawa (1999) Iwasawa, K. 1999, MNRAS, 302, 96
- Jeltema et al. (2003) Jeltema, T. E., Canizares, C. R., Buote, D. A., & Garmire, G. P. 2003, ApJ, 585, 756
- Johnson et al. (2003) Johnson, O., Best, P. N., & Almaini, O. 2003, MNRAS, 343, 924
- Kelson (2003) Kelson, D. D. 2003, PASP, 115, 688
- Kelson (2005) —. 2005, PASP, submitted
- Kelson (2006) —. 2006, AJ, submitted
- Kelson et al. (2000) Kelson, D. D., Illingworth, G. D., van Dokkum, P. G., & Franx, M. 2000, ApJ, 531, 184
- Kim et al. (2004a) Kim, D.-W., Cameron, R. A., Drake, J. J., Evans, N. R., Freeman, P., Gaetz, T. J., Ghosh, H., Green, P. J., Harnden, F. R., Karovska, M., Kashyap, V., Maksym, P. W., Ratzlaff, P. W., Schlegel, E. M., Silverman, J. D., Tananbaum, H. D., Vikhlinin, A. A., Wilkes, B. J., & Grimes, J. P. 2004a, ApJS, 150, 19
- Kim & Fabbiano (2004) Kim, D.-W. & Fabbiano, G. 2004, ApJ, 611, 846
- Kim et al. (2004b) Kim, D.-W., Wilkes, B. J., Green, P. J., Cameron, R. A., Drake, J. J., Evans, N. R., Freeman, P., Gaetz, T. J., Ghosh, H., Harnden, F. R., Karovska, M., Kashyap, V., Maksym, P. W., Ratzlaff, P. W., Schlegel, E. M., Silverman, J. D., Tananbaum, H. D., & Vikhlinin, A. A. 2004b, ApJ, 600, 59
- Martini et al. (2002) Martini, P., Kelson, D. D., Mulchaey, J. S., & Trager, S. C. 2002, ApJ, 576, L109
- Matsushita (2001) Matsushita, K. 2001, ApJ, 547, 693
- Miller et al. (2003) Miller, C. J., Nichol, R. C., Gómez, P. L., Hopkins, A. M., & Bernardi, M. 2003, ApJ, 597, 142
- Miller & Owen (2003) Miller, N. A. & Owen, F. N. 2003, AJ, 125, 2427
- Mink (2002) Mink, D. J. 2002, in ASP Conf. Ser. 281: Astronomical Data Analysis Software and Systems XI, 169
- Molnar et al. (2002) Molnar, S. M., Hughes, J. P., Donahue, M., & Joy, M. 2002, ApJ, 573, L91
- Moran et al. (1999) Moran, E. C., Lehnert, M. D., & Helfand, D. J. 1999, ApJ, 526, 649
- Mushotzky et al. (2000) Mushotzky, R. F., Cowie, L. L., Barger, A. J., & Arnaud, K. A. 2000, Nature, 404, 459
- Osterbrock (1960) Osterbrock, D. E. 1960, ApJ, 132, 325+
- O’Sullivan et al. (2003) O’Sullivan, E., Ponman, T. J., & Collins, R. S. 2003, MNRAS, 340, 1375
- Ranalli et al. (2003) Ranalli, P., Comastri, A., & Setti, G. 2003, A&A, 399, 39
- Rose et al. (2002) Rose, J. A., Gaba, A. E., Christiansen, W. A., Davis, D. S., Caldwell, N., Hunstead, R. W., & Johnston-Hollitt, M. 2002, AJ, 123, 1216
- Ruderman & Ebeling (2005) Ruderman, J. T. & Ebeling, H. 2005, ApJ, 623, L81
- Sarazin et al. (2001) Sarazin, C. L., Irwin, J. A., & Bregman, J. N. 2001, ApJ, 556, 533
- Smith (2003) Smith, R. J. 2003, MNRAS, 344, L17
- Stark et al. (1992) Stark, A. A., Gammie, C. F., Wilson, R. W., Bally, J., Linke, R. A., Heiles, C., & Hurwitz, M. 1992, ApJS, 79, 77
- Sun & Murray (2002) Sun, M. & Murray, S. S. 2002, ApJ, 2431
- Sun et al. (2005) Sun, M., Vikhlinin, A., Forman, W., Jones, C., & Murray, S. S. 2005, ApJ, 619, 169
- Swartz et al. (2004) Swartz, D. A., Ghosh, K. K., Tennant, A. F., & Wu, K. 2004, ApJS, 154, 519
- Tran et al. (2005) Tran, K.-V. H., van Dokkum, P., Illingworth, G. D., Kelson, D., Gonzalez, A., & Franx, M. 2005, ApJ, 619, 134
- Vikhlinin et al. (2001) Vikhlinin, A., Markevitch, M., Forman, W., & Jones, C. 2001, ApJ, 555, L87
- Yamasaki et al. (2002) Yamasaki, N. Y., Ohashi, T., & Furusho, T. 2002, ApJ, 578, 833
- Yee et al. (1998) Yee, H. K. C., Ellingson, E., Morris, S. L., Abraham, R. G., & Carlberg, R. G. 1998, ApJS, 116, 211