Panchromatic study of GRB 060124: from precursor to afterglow
We present observations of GRB~060124, the first event for which both the prompt and the afterglow emission could be observed simultaneously and in their entirety by the three Swift instruments. Indeed, Swift-BAT triggered on a precursor s before the main burst peak, and this allowed Swift to repoint the narrow field instruments to the burst position s before the main burst occurred. GRB 060124 also triggered Konus-Wind, which observed the prompt emission in a harder gamma-ray band (up to 2 MeV). Thanks to these exceptional circumstances, the temporal and spectral properties of the prompt emission can be studied in the optical, X-ray and gamma-ray ranges. While the X-ray emission (0.2–10 keV) clearly tracks the gamma-ray burst, the optical component follows a different pattern, likely indicating a different origin, possibly the onset of external shocks. The prompt GRB spectrum shows significant spectral evolution, with both the peak energy and the spectral index varying. As observed in several long GRBs, significant lags are measured between the hard- and low-energy components, showing that this behaviour extends over 3 decades in energy. The GRB peaks are also much broader at soft energies. This is related to the temporal evolution of the spectrum, and can be accounted for by assuming that the electron spectral index softened with time. The burst energy ( erg) and average peak energy ( keV) make GRB 060124 consistent with the Amati relation. The X-ray afterglow is characterized by a decay which presents a break at s.
Key Words.:
Gamma rays: bursts; X-rays: bursts; X-rays: individuals (GRB 060124)1 Introduction
The Swift Gamma-Ray Burst Explorer (Gehrels et al. 2004) was successfully launched on 2004 Nov. 20. Its payload includes one wide-field instrument, the gamma-ray Burst Alert Telescope (BAT; Barthelmy et al. 2005a, 15–350 keV energy band), and two narrow-field instruments (NFIs), the X-Ray Telescope (XRT; Burrows et al. 2005a, 0.2–10 keV) and the Ultraviolet/Optical Telescope (UVOT; Roming et al. 2005a, 1700–6500 Å). The BAT detects the bursts, calculates their positions to accuracy and triggers an autonomous slew of the observatory to point the two narrow-field instruments, typically within 100 s from the burst onset. The XRT can provide positions, while the UVOT further refines the afterglow localization to .
GRB 060124 is the first event for which the three Swift instruments have a clear detection of both the prompt and the afterglow emission. Indeed, Swift-BAT triggered on a precursor on 2006-01-24 at 15:54:52 UT, s before the main burst peak. This allowed Swift to immediately repoint the NFIs and acquire a pointing towards the burst s before the burst occurred. The burst, which had a highly structured burst profile, comprises three major peaks following the precursor and had one of longest total durations (even excluding the precursor) recorded by either BATSE or Swift.
GRB 060124 also triggered Konus-Wind (Aptekar et al., 1995) 559.4 s after the BAT trigger (Golenetskii et al., 2006). The Konus light curve confirmed the presence of both the precursor and the three peaks of prompt emission. The main peak of GRB 060124 was also bright enough to trigger the FREGATE instrument aboard HETE–II (HETE trigger 4012, Lamb et al. 2006) 557.7 s after the BAT trigger.
The prompt emission of GRB 060124 was observed simultaneously by XRT with exceptional signal-to-noise (S/N) and was detected by UVOT at ( s) and ( s). This fact makes it an exceptional test case to study prompt emission models, since this is the very first case that the burst proper could be observed with an X-ray CCD with high spatial resolution imaging down to 0.2 keV. There have been a handful of previous optical detections while the burst prompt emission was still active, due to the increasing number of robotic followup telescopes. GRB~990123 was observed by ROTSE (Akerlof et al., 1999), and its light curve showed a flare which rapidly decayed, uncorrelated with the gamma-ray emission. This behaviour was generally interpreted as emission from the external reverse shock (Sari & Piran, 1999b; Mészáros & Rees, 1999). A reverse shock was also likely observed in GRB~050904 (Boër et al., 2005). A different behaviour was observed for GRB~041219A (Vestrand et al., 2005; Blake et al., 2005). In this case, the optical emission showed a temporal variability correlated with the gamma-ray emission, suggesting a common origin for the two components. The prompt afterglows of GRB~050319 (Quimby et al., 2006; Woźniak et al., 2005) and GRB~050401 (Rykoff et al., 2005) showed a decay matching the late-time one, without the need for extra components. Last, GRB~050801 (Rykoff et al., 2006) showed a period of plateaux up to a few minutes after the burst, excluding contribution from the internal shocks, but possibly arguing for energisation from the central engine correlated with the X-ray emission.
GRB 060124 was extensively followed from ground-based observatories with detections starting from one hour after the trigger. The optical counterpart was identified by the Tautenburg telescope (Kann, 2006). Further observations were carried out with the ARIES 1.04m (Misra, 2006), the HCT 2m (Bhatt et al., 2006), the CrAO 2.6m (Rumyantsev et al., 2006) and the Asiago 1.82m (Masetti et al., 2006). Limits were given by ART (Torii, 2006), MASTER (Lipunov et al., 2006), UoM 30cm (Sonoda et al., 2006), TAROT (Klotz et al., 2006), and Loiano-1.52m (Greco et al., 2006). An absorption redshift of was determined based on the CIV doublet (Mirabal & Halpern, 2006; Cenko et al., 2006; Prochaska et al., 2006).
This paper is organized as follows. In Sect. 2 we describe our observations and data reduction; in Sect. 3 we describe our instrument-based spatial, timing and spectral data analysis; in Sect. 4 and 5 we describe our detailed, multi-wavelength timing and spectral analysis of the prompt and afterglow emission. In Sect. 6 we discuss our findings. Finally, in Sect. 7 we summarise our findings and conclusions. Throughout this paper the quoted uncertainties are given at 90% confidence level for one interesting parameter (i.e., ) unless otherwise stated. Times are referred to the BAT trigger , , unless otherwise specified. The decay and spectral indices are parameterized as , where (erg cm-2 s-1 Hz-1) is the monochromatic flux as a function of time and frequency ; we also use as the photon index, (ph keV-1 cm-2 s-1). We adopt a standard cosmology model with km s-1 Mpc-1, , .
2 Observations and data reduction
2.1 BAT observations
At 15:54:52 UT, Swift-BAT triggered and localized GRB 060124 (trigger 178 750, Holland et al., 2006; Fenimore et al., 2006). The on-board location was distributed 21 s after the trigger, and its position was RA(J2000, Dec(J2000, with an uncertainty of 3′. The partial coding was 62%. The spacecraft started to slew to the burst position at s, and settled at s. Table 1 reports the log of the Swift-BAT observations that were used for this work. Since BAT was triggered by the precursor, the event-by-event data which are available from only include the precursor and do not include the main burst.
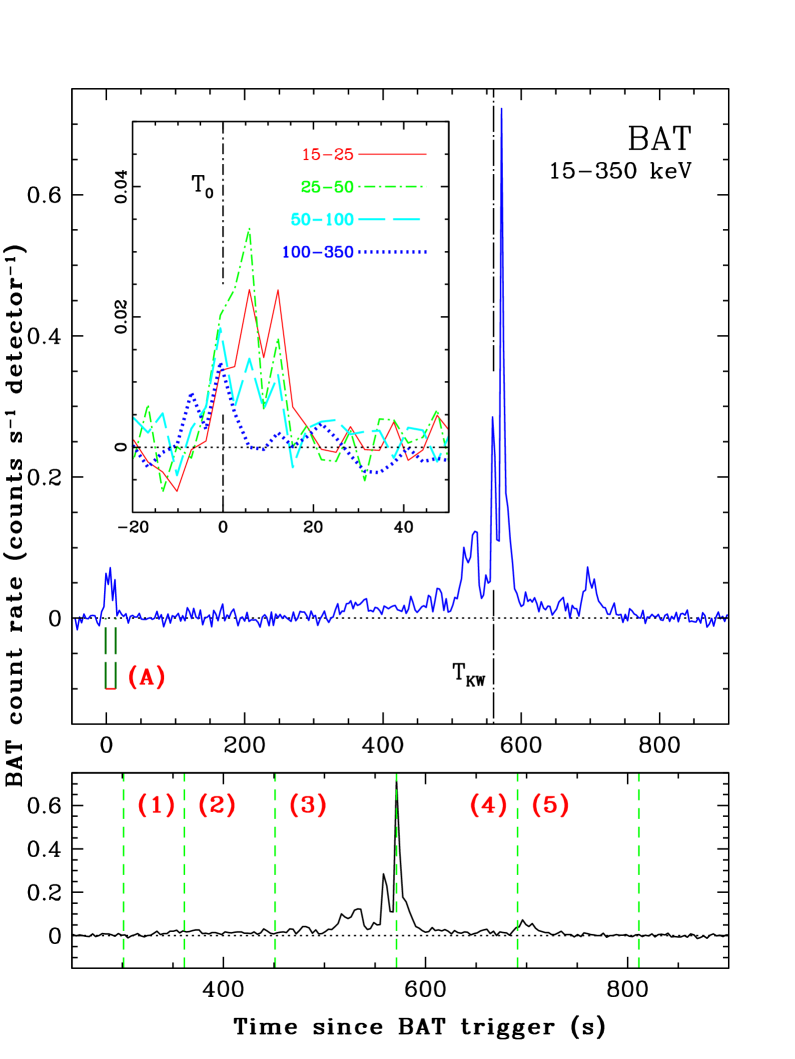
The temporal analysis around the main peak was performed using the mask-tagged 4 channel light curves (15–25, 25–50, 50–100, and 100–350 keV bands) generated by the flight software. For the spectral analysis, the detector plane histogram (DPH) data (80-channel spectral data with time-intervals shown in the bottom panel of Fig. 1) were used. The BAT mask-weighted light curve (Fig. 1) shows a precursor from to s, with a peak count rate of counts s-1 (15–350 keV) at the trigger time, then three major peaks: – s, – s (with the largest flux), and – s. The inset of Fig. 1 shows the 16-s precursor. We note that this is the longest interval ( s) recorded between a precursor and the main GRB event (Lazzati, 2005).
2.2 Konus observations
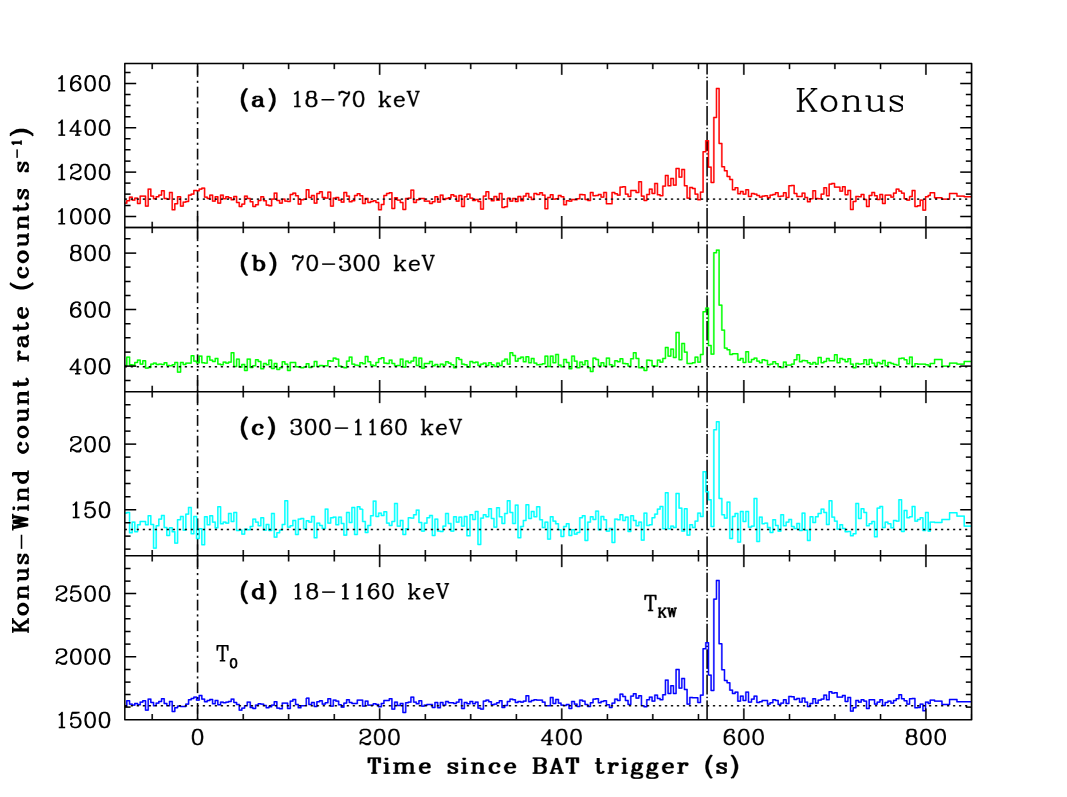
The most intense part of GRB 060124 triggered Konus-Wind on 2006-01-24 at 16:04:13.9, 559.4 s after the BAT trigger (taking into account the -s propagation delay from Swift to Wind). It was detected by the S2 detector which observes the North ecliptic hemisphere; the incident angle was . The count rates are recorded by Konus in three energy ranges: G1 (18–70 keV), G2 (70–300 keV), and G3 (300–1160 keV). The early (trigger) part of the time history is recorded from 0.512 s to 229.632 s with time resolution ranging from 2 to 256 ms. The data before 0.512 s are collected in the waiting mode with 2.944 s time resolution. Time history recorded in the three energy ranges can be considered as 3-channel spectra. The full Konus time history of GRB 060124 is reported in Fig. 2, which shows a weak (4- and 2.5- in the 18–70 keV and 70–300 keV energy bands, respectively) precursor corresponding to the Swift-BAT trigger time, no statistically significant emission in any Konus energy band from to s, resuming emission at s, the main double-peaked pulse in the interval – s, and weaker pulses up to s.
2.3 XRT observations
The XRT observations of GRB 060124 started on 2006-01-24 15:56:36 UT, only 104 s after the BAT trigger, and lasted until 2006-02-23 23:32:57 UT. Table 1 reports the log of the Swift-XRT observations that were used for this work, which include a total net exposure time of s in Windowed Timing (WT) mode and ks in Photon Counting (PC) mode, spread over a 31 d baseline. The monitoring is organized in 24 sequences. The first (000) was performed as an automated target (AT) and with XRT in auto state. Therefore, in sequence 000 the XRT took an initial 2.5 s image (IM at s) followed by WT frames (at s) for the remainder of the first snapshot (continuous pointing at the target). During most of the first sequence, the count rate was sufficiently high for XRT to remain in WT mode, the exception being 15 s recorded in PC mode (for a description of read-out modes, see Hill et al., 2004). The latter were used to provide a first localization of the afterglow (Mangano et al., 2006). The following observations were performed in both PC and WT modes, but the WT data have a very low S/N and were therefore not used here.
2.4 UVOT observations
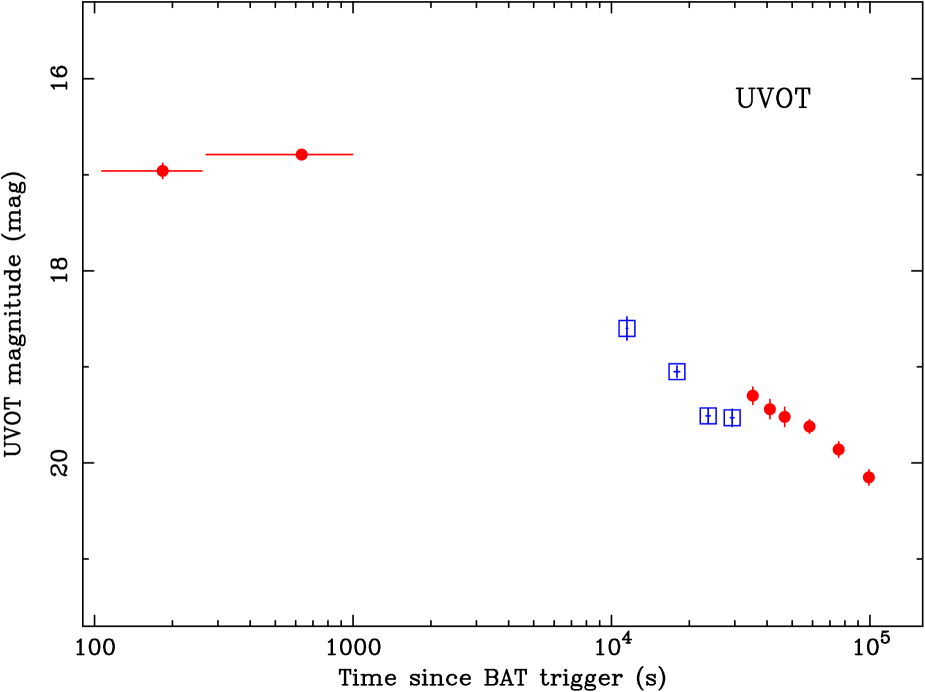
Table 1 reports the log of the Swift-UVOT observations that were used for this work. The first UVOT observation was taken in IMAGE mode, because the burst interrupted a Target-of-Opportunity (ToO) pointing which had required this observing mode. Therefore, the UVOT did not execute the standard AT observing sequence, which uses EVENT mode to provide high time resolution. By contrast, the IMAGE mode data were collected in long integrations. After the first observation, the normal follow-up mode was used. Figure 3 shows the observations for which a detection was obtained (the upper limits are not shown because they do not usefully constrain the behaviour).
3 Data analysis
3.1 BAT and Konus analysis
The BAT data were analysed using the standard BAT analysis software distributed within FTOOLS v6.0.4. The BAT ground-calculated position, based on data from to s, is RA(J2000, Dec(J2000, with an uncertainty of (radius, statistical and systematic errors). Mask-tagged BAT light curves were created in the standard 4 energy bands, 15–25, 25–50, 50–100, 100–350 keV (Fig. 4) and in the total band 15–350 keV (Fig. 1) at 3.2-s time resolution. The BAT spectra were extracted over the interval which includes the precursor (A in Fig. 1, to s), and in the other 5 time intervals. Response matrices were generated with the task batdrmgen using the latest spectral redistribution matrices. For our spectral fitting (XSPEC v11.3.2) we considered the 14–150 keV energy range and applied an energy-dependent systematic error vector111http://heasarc.gsfc.nasa.gov/docs/swift/analysis/bat_digest.html.
The Konus data were processed using standard Konus analysis tools. From to s, 64 spectra in 101 channels were accumulated on timescales varying from 64 ms near the trigger (first four spectra) to 8.2 s afterwards. We also derived the Konus 3-channel spectra and the corresponding response for several time intervals prior to , as well as for the total burst, for the joint fitting with BAT and XRT.
and (the timescales over which 90% and 50% of the burst fluence is measured) were calculated from the BAT light curves with the task battblocks, using data binned to 1.6 s resolution in the time range –1194.4 s (thus excluding the precursor) and are reported in Table 2. These were also calculated for Konus data with Konus-specific tasks. We note, that the Konus and in the G3 energy band are affected by low S/N effects and therefore are probably underestimated.
Although the individual peak durations are comparable to the duration of other long GRBs, the total duration (excluding the precursor) is among the longest recorded by either BATSE (Paciesas et al., 1999) or Swift. In the 15–150 keV band the fluences of the precursor emission, the main emission and the following peaks are , and erg cm-2, respectively.
3.2 XRT analysis
The XRT data were first processed by the Swift Data Center at NASA/GSFC into Level 1 products (event lists). Then they were further processed with the XRTDAS (v1.7.1) software package, written by the ASI Science Data Center (ASDC) and distributed within FTOOLS to produce the final cleaned event lists. In particular, we ran the task xrtpipeline (v0.9.9) applying calibration and standard filtering and screening criteria. An on-board event threshold of 0.2 keV was applied to the central pixel of each event, which has been proven to reduce most of the background due to either the bright Earth limb or the CCD dark current (which depends on the CCD temperature). For our analysis we selected XRT grades 0–12 and 0–2 for PC and WT data, respectively (according to Swift nomenclature; Burrows et al. 2005a).
The X-ray counterpart was detected at the position RA(J2000, Dec(J2000, with an estimated uncertainty of . This position was determined using the xrtcentroid task (v0.2.7) on the sequence 002, which is not affected by pile-up, and it takes into account the correction for the misalignment between the telescope and the satellite optical axis. It is from the refined BAT position (Sect. 3.1).
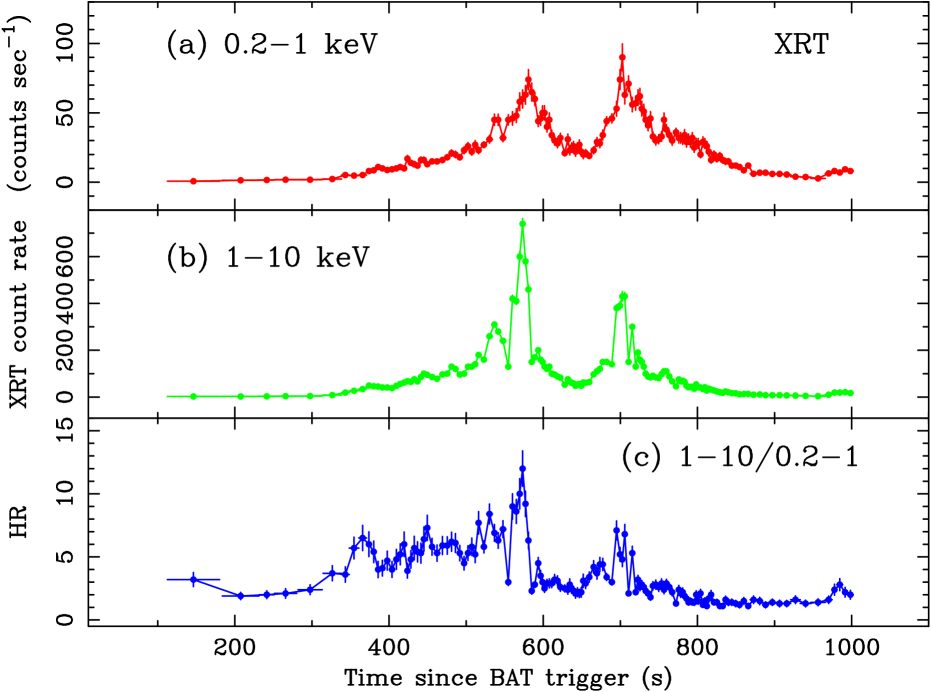
During sequence 000 the count rate of the burst was high enough to cause pile-up in the WT mode data. Therefore, to account for this effect, the WT data were extracted in a rectangular 4020-pixel region with a 420-pixel region excluded from its centre. The size of the exclusion region was determined following the procedure illustrated in the Appendix. To account for the background, WT events were also extracted within a rectangular box (4020 pixels) far from background sources. WT events were extracted in three energy bands, 0.2–10 keV (total), 0.2–1 keV (soft, S) and 1–10 keV (hard, H). We dynamically subtracted their respective backgrounds. Figure 5 shows the soft and hard (background-subtracted and corrected for Point-Spread Function, PSF, losses) light curves, as well as the ratio HS, with the BAT trigger as the origin of time. We also created WT light curves in the 1–4 and 4–10 keV bands. These are shown in Fig. 4. and were calculated from the XRT/WT light curves and are reported in Table 2.
During most of sequence 001 the PC mode data were piled-up, as well. Therefore, we extracted the source events in an annulus with a 35-pixel outer radius (″) and a 3-pixel inner radius. These values were derived by comparing the observed and nominal PSF (Vaughan et al., 2006). Given the decreasing brightness of the source, for the PC data collected in sequence 002 and the following ones we extracted the spectra in circular regions of decreasing radius (35 to 10 pixels) to maximise the S/N. PC background data were also extracted in a source-free circular region (radius 42 pixels).
Ancillary response files were generated with the task xrtmkarf within FTOOLS, and account for different extraction regions and PSF corrections. We used the latest spectral redistribution matrices in the Calibration Database (CALDB 2.3) maintained by HEASARC.
3.3 UVOT analysis
The UVOT located the afterglow of GRB 060124 at RA(J2000, Dec(J2000, with an internal accuracy of and an estimated absolute astrometric uncertainty of . This is from the XRT coordinates (Sect. 3.2). To avoid contamination from a source located from GRB 060124, we performed aperture photometry using a circular aperture with a radius of centred on the optical afterglow. A sky annulus of width and inner radius was used since this annulus encloses a large sample of sky pixels, and it avoids the bright sources near the optical afterglow. Aperture corrections were performed to convert the photometry aperture into the standard aperture radii used to define the photometric zero points. Six isolated stars were used to compute aperture corrections for each exposure. The RMS scatter in the aperture corrections is typically 0.02 mag.
The instrumental magnitudes were transformed to Vega magnitudes using the photometric zero points in the Swift-UVOT Calibration Database (CALDB 2.3). Colour terms have not been applied, but preliminary calibrations suggest that they are negligible. The adopted photometric zero points were , , , and . Table 3 reports the photometry. The UVOT fluxes reported in Table 3 are monochromatic fluxes computed at the central wavelength of the appropriate filter.
Figure 3 shows the Swift-UVOT and light curves for all observations where a detection of the afterglow was achieved. The first two -band points, at 183 and 633 s, differ from each other by 0.2 mag, which corresponds to a 2.3- variation. The UVOT light curve shows a remarkable amount of flickering (also see Sect. 4.2). We note that since these observations were performed in IMAGE mode, finer time resolution is not available for these data. Therefore, the actual, possibly variable behaviour of the optical light curve during the prompt phase remains unknown. We can estimate that if the prompt emission in the optical had occurred only in a time interval comparable to the one of the X-ray (and with no detectable emission outside, i.e. the effective exposure time is shorter), then the UVOT measurement would have been 1.7 mag brighter. Even with the (ad-hoc) estimate for this shorter interval the optical flux would not be larger by the factor by which the X- and gamma-ray flux increase in the same amount of time. In order for the optical emission to fully track the hard energy band behaviour, a timescale of emission much shorter ( s) than that observed in the X-ray would have been required.
4 Multi-wavelength timing
4.1 The prompt phase
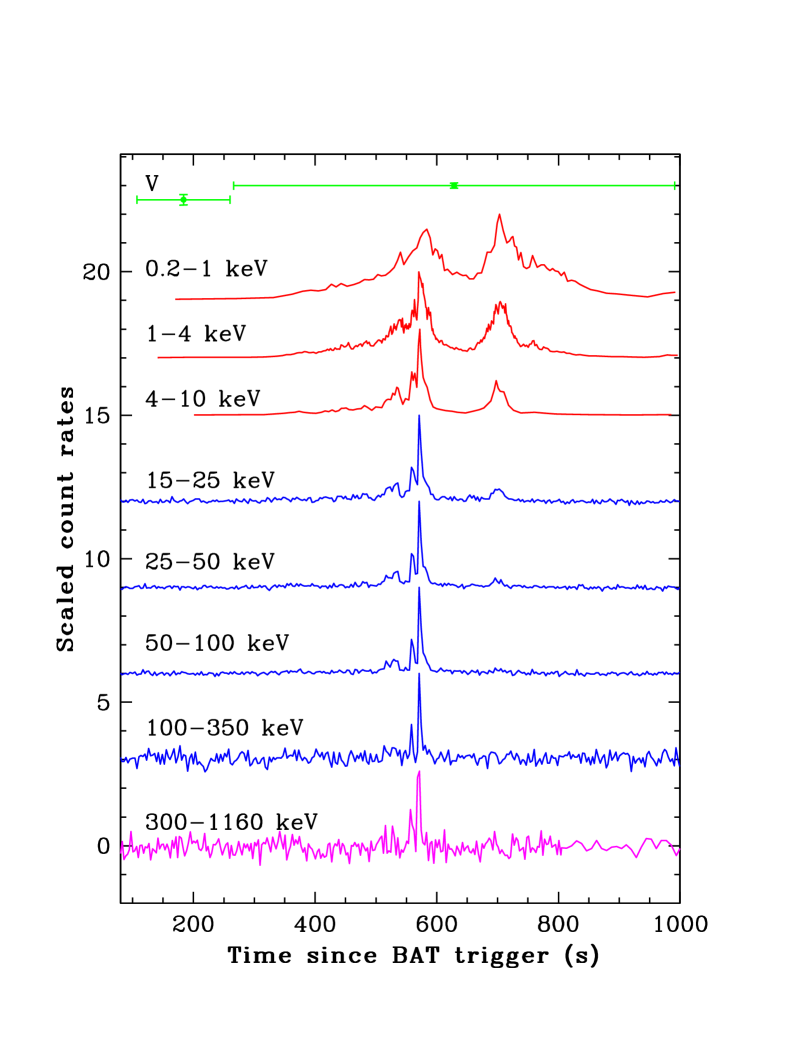
The prompt phase of GRB 060124 was observed by UVOT, XRT, BAT and Konus, as shown in Fig. 4, which illustrates the prompt emission in different energy bands. A few observational features can be noticed.
First, the relative importance of the three main peaks (as can be represented by the count rate ratios) varies through the prompt phase, in the sense that the third peak flux increases, relative to the second, as the energy band becomes softer. For example, the third peak in the 0.1–1 keV light curve is actually stronger than the second one, which indicates that strong spectral evolution is taking place (also, see Fig. 5c). This has often been observed before (e.g., Ford et al., 1995).
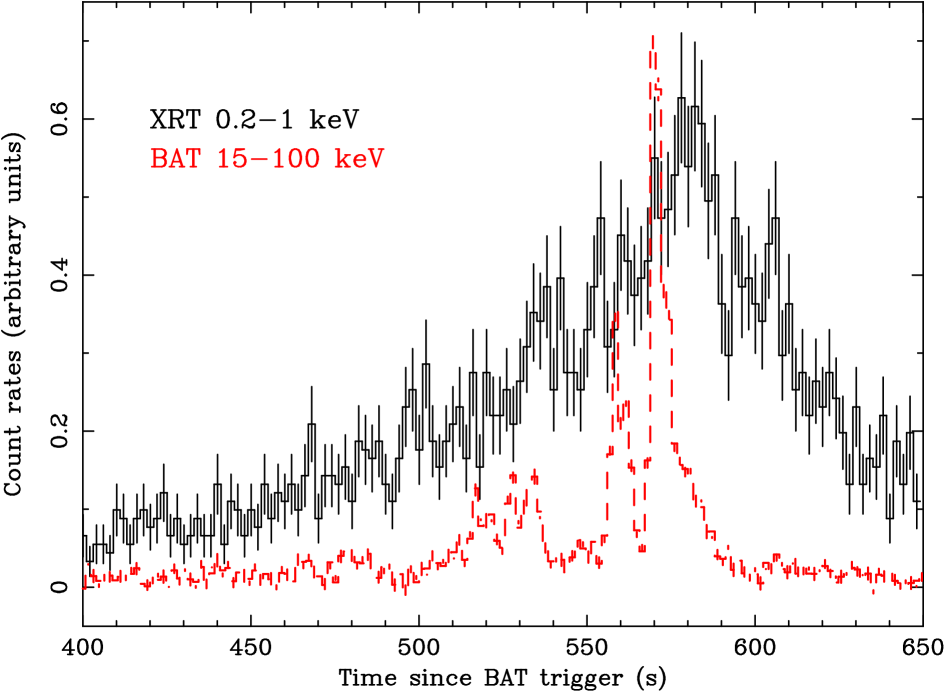
Second, the peak times of the emission shift with the energy band, as is shown in detail in Fig. 6, which shows the 0.2–1 keV XRT light curve compared with the BAT 15–100 keV one. In this extreme case, the lag between the peaks is s.
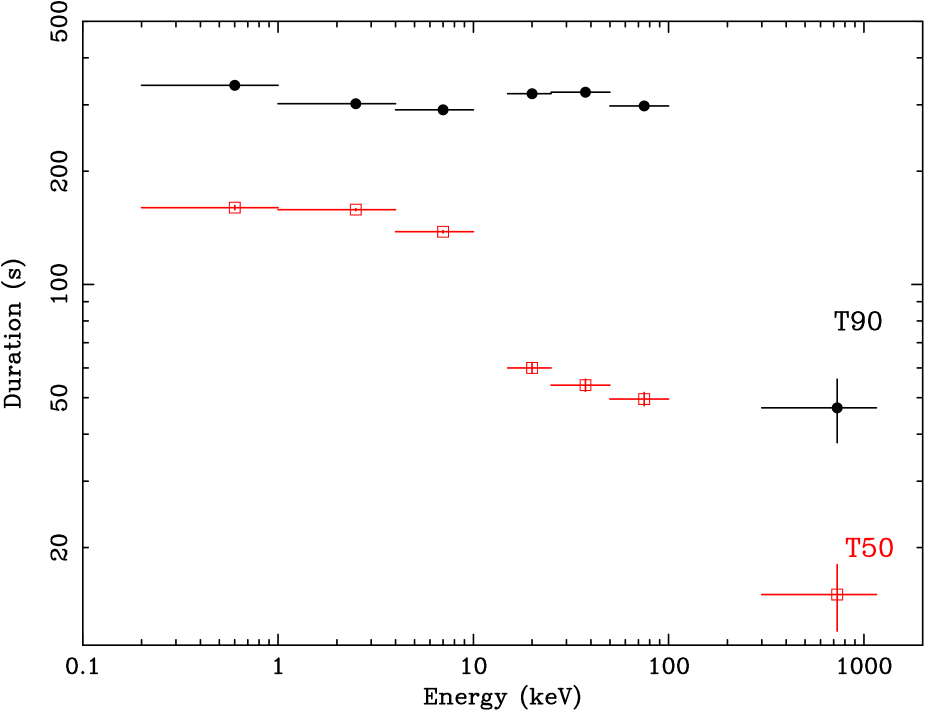
The emission starts off simultaneously in all bands (albeit with the shift described above), although it has a considerably lower S/N in the BAT and Konus bands (see Fig. 1 and Fig. 2 where the total light curves are shown). Furthermore, the emission becomes less spiky as the energy of the band decreases. This is more quantitatively described by the XRT and BAT and values which are reported in Table 2 and illustrated in Fig. 7. While the s are within 12% (fractional), the s vary by as much as 42%. This means that the peaks are much broader in the softer bands.
The X-ray peaks can be formally modelled with 12 Gaussians. When modelled with power laws, the prompt emission peaks show very high rise slopes, ranging from 5 to 12 if the time is referred to the BAT trigger, of the order of 1–2 if the initial time is set to the first point of the flare. We note that there is evidence of continued flaring after the end of the first snapshot (see Figs. 5 and 8), and our s and s may therefore be underestimated.
4.2 The afterglow phase
The afterglow phase was observed by XRT and UVOT. Since the XRT data are characterized by detection over a longer time and with a finer sampling, a joint fit is strongly biased in favour of the X-ray data. Therefore, we fit the XRT and UVOT data separately.
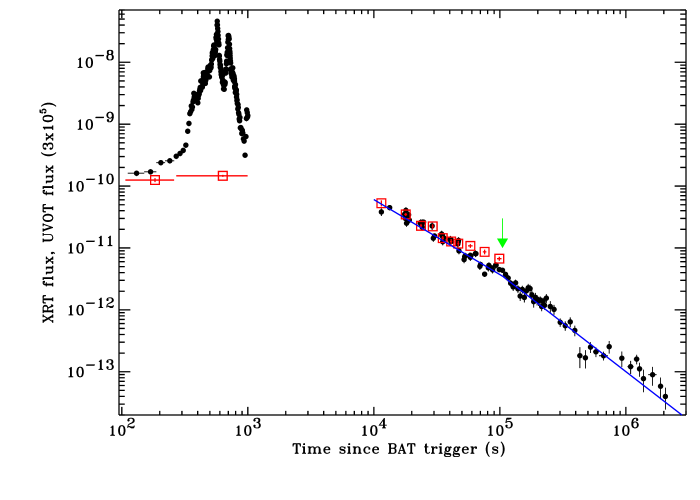
The XRT/PC portion of the light curve ( s) was first fit with a simple power-law model using the BAT trigger as origin of time (we perform a fit with a different origin, , below). The fit yields a decay index and (94 degrees of freedom, d.o.f.). A fit with a broken power law for and for , where is the time of the break, yields and , and a break at s (, 92 d.o.f.). This is a significant improvement over the simple power law (null hypothesis probability ).
We note that the XRT/PC light curve is affected by flickering, so that the residuals to the fits are dominated by rapid variations. Their intensity decreases as the time increases, a behaviour which has been observed before and which is due to both the logarithmic binning in our light curves and to the power-law decrease of the source counts. We tested the effect of flickering by removing the points in the light curve which were at least 2 above the model being tested for. Although the normalization of both the power-law and the broken power-law fits decrease, the slopes are consistent with the previous values within the uncertainties, and drops down to .
It is also interesting to fit the light curves considering an initial time different from the BAT trigger time, i.e. the beginning of the main peak. To this end, we performed a fit of the PC data, using a broken power-law model with an initial time fixed to the Konus trigger time s. We obtain , , and break at s (, 92 d.o.f.), which is consistent with what we found for the fits which adopted the BAT trigger as the starting time.
The late-time UVOT light curve ( s) is characterized by in the band and in the band. A simultaneous fit of and band data with the constraint of a single slope yields (68% error, , 7 d.o.f.). We infer an observed value of the colour and an optical spectral index (the latter was derived using an extinction correction of mag). Figure 8 shows the homogenized Swift-UVOT light curve (the wavelength dependency of the UVOT bands was taken into account) superimposed (by scaling) on the XRT flux light curve.
5 Broad-band spectroscopy: XRT, BAT and Konus
5.1 The prompt phase
As a way to characterize the fundamental burst parameters, we used the full Swift and Konus energy ranges. To this end we considered the 6 time intervals described in Sect. 3.1 and extracted spectra from BAT in interval A, from XRT and BAT data in intervals 1 and 2, and XRT, BAT and Konus in intervals 3–5. We fit all the spectra extracted in the same time interval simultaneously. We considered an absorbed power law model, with two absorption components, the Galactic one cm-2, and one at the GRB redshift (, Cenko et al. 2006). was free to vary between and cm-2. The lower limit was derived from the Galactic extinction estimate along the GRB line of sight mag (Schlegel et al., 1998), with a conversion into Hydrogen column cm-2 (Predehl & Schmitt, 1995). The second limit is the upper limit of neutral Hydrogen maps (Dickey & Lockman, 1990), calculated with the nh tool within FTOOLS. We note that the Leiden/Argentine/Bonn (LAB) Survey of Galactic HI (Kalberla et al., 2005) provides cm-2, which is within the considered range. We considered different emission models, ranging from a simple power-law, , a cutoff power-law, and the GRBM model (Band et al., 1993), for , for , where is the cutoff energy, and and are the low- and high-energy photon indices. The fits were performed in the 0.5–10, 14–150, 20–2 000 keV energy ranges for XRT/WT, BAT and Konus, respectively.
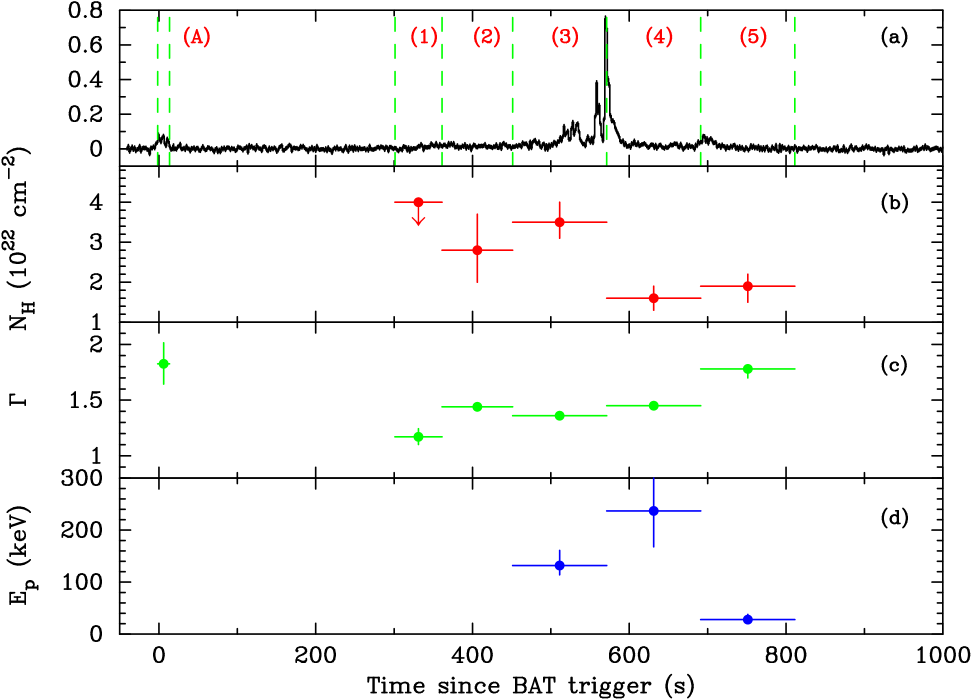
Our results for the best fitting model in each time interval are reported in Table 4 and illustrated in Fig. 9. At this time resolution, the photon index generally increases (softens) throughout the prompt phase (Fig. 9c). The precursor is significantly softer than the main burst prompt emission. However, we note that in the X-ray range, where a finer time sampling is available for spectroscopy, the hardness ratio tracks the count rate on a fine scale (see Fig. 5c). Therefore, the emission is softer when its intensity is lower (also, see Sect. 5.2). There is marginal evidence for variations in the intrinsic column density, with a - decrease between the third and fourth data point (Fig. 9b). We note that the break energy lies outside the XRT band even in the last bin (Fig. 9d).
For comparison, we considered the Konus spectrum around the Konus trigger (–575.5) as representative of the most intense part of the burst. Fitting this spectrum with a GRBM model, we obtain , and (, 61 d.o.f.). We derive keV.
We also fitted the total spectra (–811.2 s, last line in Table 4). Based on this last fit, we derive an observed and rest-frame peak energy of keV and keV, respectively. We also calculated integrated quantities, such as the fluence , the peak photon and energy flux in several energy bands. These are reported in Table 5.
The derived value of the isotropic energy, for a time integration of 510 s in the source 1–104 keV energy range, is erg. With these values, this burst is consistent with the - relation (Amati et al., 2002). The rest-frame isotropic luminosity in the 30–10000 keV range is erg s-1. This value is also consistent with the - relation (Yonetoku et al., 2004).
5.2 Spectral evolution of the prompt phase with XRT/WT data
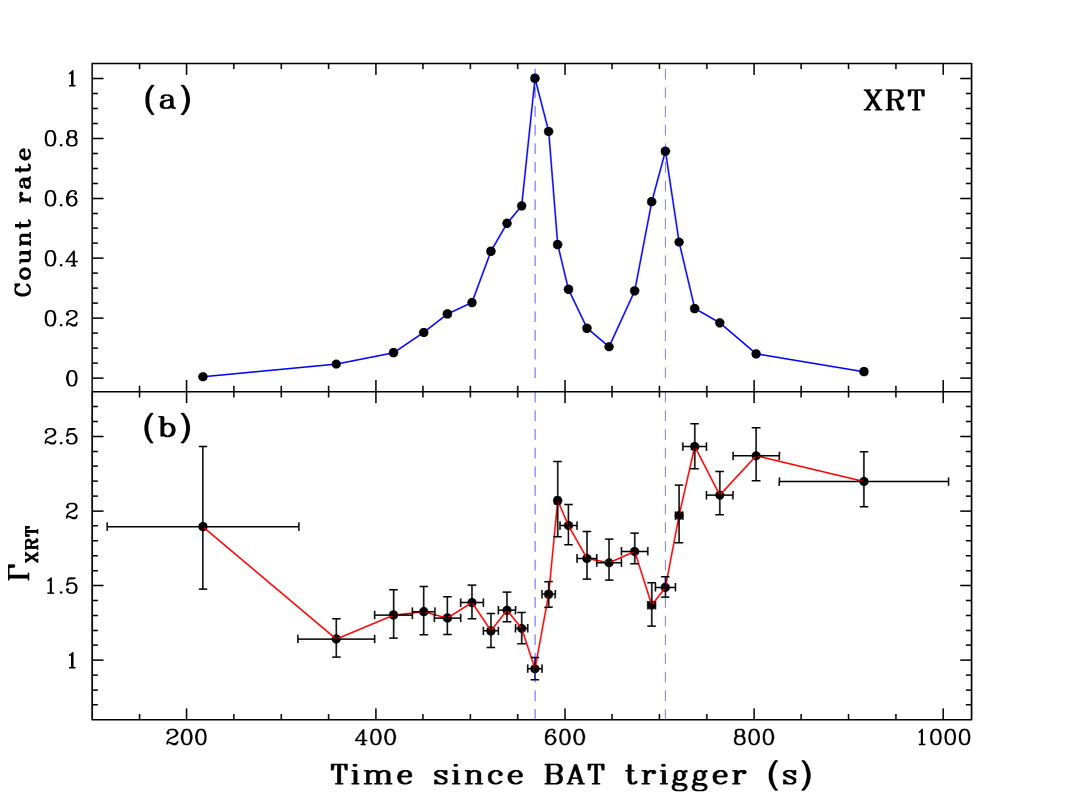
To study the spectral evolution during the prompt phase in more detail than possible with BAT or Konus data, we created 23 time intervals that covered the prompt phase, and extracted XRT/WT spectra in the regions defined above. We fit them in the 0.5–10 keV band, with an absorbed power law model, with the two absorption components described in Sect. 5.1. The results are shown in Fig. 10. As Fig. 5c also shows, there is strong spectral evolution during the prompt phase. In particular, the photon index has a minimum (i.e. the spectrum becomes harder) at the peaks of emission. Also, we note that the photon index achieves a plateau following each peak in the light curve, with each plateau becoming successively softer. During this time interval, the photon index increases by about 1, reaching a value consistent with the later afterglow spectrum by the end of the last peak.
5.3 XRT/PC spectrum of the afterglow
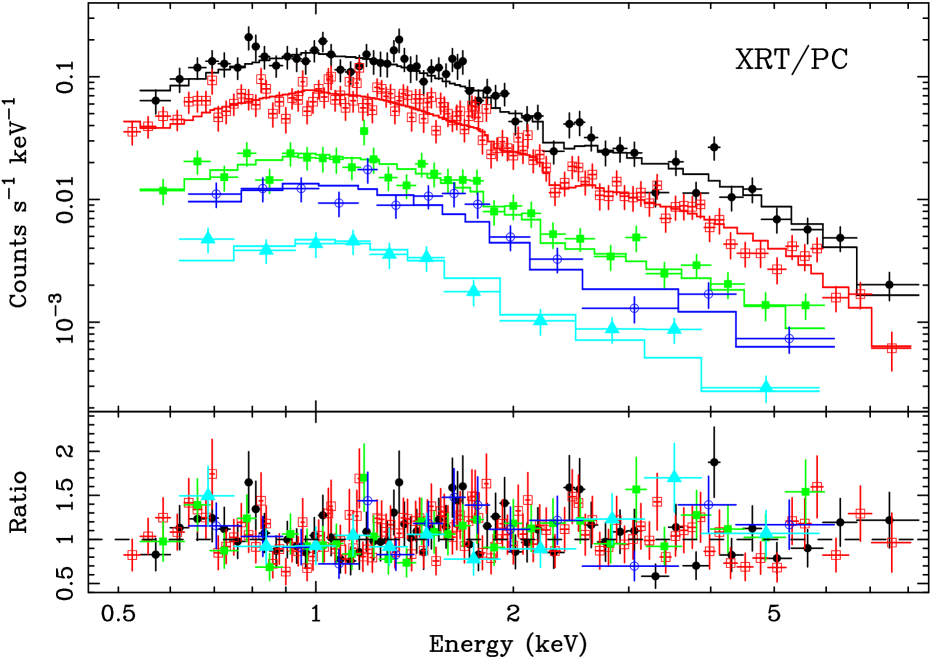
The only spectroscopic information on the pure afterglow comes from the XRT/PC data. We performed a fit of the PC data in the 0.5–10 keV band, which were rebinned with a minimum of 20 counts per energy bin to allow fitting within XSPEC. We considered an absorbed power law model, with the two absorption components described in Sect. 5.1. The fits for each sequence yield consistent photon indices and column density at the GRB redshift, as reported in Table 6. We also fitted all data sets together and obtained a photon index , cm-2, and a column density at the GRB redshift cm-2 (; 216 d.o.f., see Fig. 11). We confirm the presence of an excess of with respect to the Galactic Hydrogen column along the line of sight on the order of cm-2.
5.4 Summary of the observed properties of GRB 060124
-
1.
The precursor/prompt phase.
- (a)
-
(b)
The XRT, BAT and Konus light curves (0.2–2 000 keV) show the same overall structure consisting of three peaks. No time-resolved information is available from UVOT, but we observe that the optical behaviour during the prompt emission was significantly different from the X-ray one.
- (c)
-
(d)
The peaks of the prompt emission shift with the energy band, with the peaks observed in the harder bands preceding the ones observed in the softer bands. This lag is as much as s (between 15–100 keV and 0.2–1 keV).
-
(e)
Strong spectral evolution takes place during the prompt phase. We observe moving from higher energies to lower energies (Sect. 5.1, Fig. 12). The spectral evolution follows a “tracking” behaviour (Fig. 10), with the spectrum being softer when the flux is higher. The relative importance of the three main peaks varies with the energy band; the third peak in the 0.1–1 keV light curve is actually stronger than the second one, as opposed to what is observed in all the other energy bands.
-
(f)
The peaks are much broader in the softer bands.
-
(g)
We derive a mean rest frame peak and isotropic energy keV and erg.
-
2.
The afterglow phase.
-
(a)
The X-ray afterglow is modelled with a broken power-law decay with indices , and a break at s.
-
(b)
The optical afterglow is modelled with a power-law decay with index (the optical data are only available for s).
-
(a)
6 Discussion
One of the main results of Swift is the identification of a steep-decay phase which is observed in the early X-ray light curves of many GRBs, followed by a shallower phase (Tagliaferri et al., 2005; Nousek et al., 2006; O’Brien et al., 2006). Quite often an erratic flaring behaviour is observed superimposed on these phases (Burrows et al., 2005b; Falcone et al., 2006; Romano et al., 2006). The most accredited explanation for the steep phase is that we are seeing high-latitude emission due to the termination of the central engine activity (Kumar & Panaitescu, 2000; Zhang et al., 2006), while flares are probably due to the reactivation of the central engine. Here, for the first time, we have the chance to follow in the soft X-ray and in the optical/UV both the prompt phase and its transition to the afterglow phase.
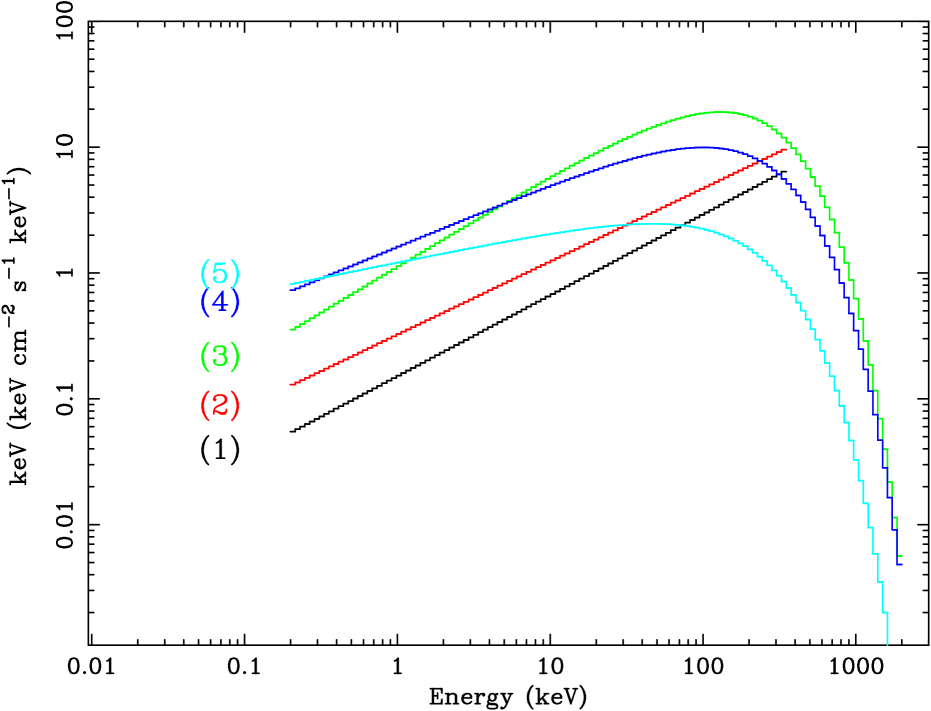
The panchromatic observation of GRB 060124 during the prompt phase provides the opportunity to study the broadband emission of the GRB prompt emission in great detail. Time-resolved spectra were analysed for 5 temporal segments (Fig. 12), each spanning nearly 4 decades in frequency (from the XRT to the BAT or Konus band). The flux levels at even lower frequencies (the UVOT band) are also measured, but at a much coarser temporal resolution. Whenever the joint BAT-Konus data are available (bin 3–5), a peak energy can be computed. The time-resolved spectral fits reveal an evolution of to lower energies. The origin of has been extensively discussed in the literature (Mészáros et al., 1994; Tavani, 1996; Pilla & Loeb, 1998; Zhang & Mészáros, 2002; Pe’er & Waxman, 2004; Rees & Mészáros, 2005; Pe’er et al., 2005; Ryde, 2005). The suggestions range from the optically-thin characteristic synchrotron emission frequency, to the optically-thick Comptonised spectral peak, to the thermal peak of the fireball photosphere. In particular, there have been questions about whether the synchrotron model can account for the observed spectrum (Lloyd & Petrosian, 2000; Ghisellini et al., 2000), since the standard synchrotron model requires fast cooling so that the photon index below the is expected to be . This is because for internal emission models (e.g. the internal shock model or the internal magnetic dissipation model), the magnetic fields in the dissipation region are so high that the electron cooling time scale is much shorter than the dynamical time scale. The measured photon index in the bins 2–5 are all close to this value, suggesting that the fast-cooling synchrotron model is a plausible mechanism at least for this burst. Lacking a temporally resolved UVOT light curve, one cannot derive a reliable time-resolved SED extending to the UVOT band. Nonetheless, connecting the time-averaged UVOT flux level to the flux level in the XRT band requires a further spectral break between the XRT and the UVOT band, which may be consistent with a cooling break or a synchrotron self-absorption break.
Both the spectral peak energy and the spectral indices evolve with time. This is likely due to the complicated interplay between particle heating and cooling as well as the emission contributions from many emission units (e.g. internal shocks). One interesting property is that the second main peak (bin 5, keV) is significantly softer than the first main peak (bin 4, keV). Within the internal dissipation models, one has (Zhang & Mészáros, 2002), where is the wind luminosity of the GRB outflow, is the emission radius, is the bulk Lorentz factor, and is the time variability from the central engine. The second part of proportionality is valid specifically for the internal shock model. The 15–150 keV fluence of the second main peak is about one order of magnitude lower than that of the first main peak . Given the similar durations of the two episodes, the luminosity of the second epoch is lower by a factor of . This would account for a factor of 3 reduction of the . The data then require a larger emission radius (by a factor of 3). In the internal shock scenario, this requires that the bulk Lorentz factor is somewhat higher. This may be consistent with the idea that the environment of the burst becomes cleaner with time as the initial jet has loaded most of the baryons along the path. This would be the first piece of evidence of an increase of the Lorentz factor during the prompt phase.
The fact that the pulses in the softer band tend to be broader is related to the temporal evolution of the spectrum. If the electron spectral index does not evolve with time (as is usually assumed in the afterglow modeling), the rising/falling time scales of the light curves should be similar in different energy bands. However, if during the acceleration processes the electron spectrum hardens with time, one can get a wider, soft wing with respect to a narrow, hard spike. The temporal decay slopes after the peaks are shallower than . This suggests that the decay is not due to the adiabatic cooling of the emission region. Rather, electron heating may be still going on but with a reduced rate. If one assumes that the electron spectral index softens with time during the decay, one can account for a longer soft tail with respect to the narrow hard spike. This is supported by our finding that the photon indices are systematically smaller near the peaks (Fig. 10).
The super-long duration of the burst suggests that the GRB central engine is active for hundreds of seconds. This has become a general feature of both long and short GRBs in view of the commonly detected X-ray flares hundreds of seconds after the burst trigger, which are generally interpreted as late central engine activities (Burrows et al., 2005b; Zhang et al., 2006; Romano et al., 2006; Falcone et al., 2006; Barthelmy et al., 2005b; Campana et al., 2006; Liang et al., 2006). The second main peak (excluding the precursor) would have been categorized as an X-ray flare had it been even softer. The “precursor” emission leads the main peak by about 500 s. This is inconsistent with precursor models that involve an erupting fireball from a massive stellar envelope, which predicts a precursor leading the main episode by several seconds (Ramirez-Ruiz et al., 2002). A straightforward possibility is that the precursor is also due to early central engine activity. Suggestions to produce episodic, erratic central engine activity include fragmentation of the collapsing star (King et al., 2005) or the accretion disk (Perna et al., 2006), a magnetic barrier modulated accretion flow (Proga & Zhang, 2006), or the magnetic activity of a massive neutron star central engine (Dai et al., 2006). An interesting question for these models would be how to generate a weak precursor s before the main episode.
The origin of the optical emission during the prompt phase is uncertain from the available data. However, a tracking behaviour would require timescales of optical emission in the order of s, which is short, compared with GRB 990123 (Akerlof et al., 1999). Lacking a clear tracking behaviour with the prompt gamma-ray and X-ray light curves suggests that it may come from a different emission site, e.g. the reverse shock (Mészáros & Rees, 1997, 1999; Sari & Piran, 1999a). Nonetheless, the level of the prompt optical emission clearly rules out the presence of a prominent reverse shock component as discovered in GRB 990123 (Akerlof et al., 1999) and GRB~021211 (Fox et al., 2003; Li et al., 2003), which generally requires that the magnetic fields in the reverse shock region are significantly stronger than that in the forward shock region (Zhang et al., 2003; Fan et al., 2002; Kumar & Panaitescu, 2003), and that the fireball has comparable energy in baryonic materials and magnetic fields (i.e. , Zhang & Kobayashi 2005). The contribution of the reverse shock could be less significant when is low (baryonic) or very high (Poynting-flux-dominated, Zhang & Kobayashi, 2005). In particular, various physical processes could lead to the suppression of the reverse shock emission even if the fireball is baryonic (e.g. Kobayashi, 2000; Nakar & Piran, 2004; Kobayashi et al., 2005). As a result, although the insignificant reverse shock emission is consistent with a Poynting flux dominated GRB model (e.g. Lyutikov & Blandford, 2003; Roming et al., 2005b), the baryonic GRB model is not disfavoured by the data.
The early part of the afterglow () can be explained well in terms of the standard model (Sari et al., 1998). In this case, the optical and X-ray data constrain the cooling frequency between the optical and X-ray bands. In fact, the X-ray and optical spectral indices and differ by , and constrain Hz. The temporal behaviour is fully consistent with this interpretation: both the optical and X-ray decay slopes are consistent with the model prediction: (valid for ) and (valid for ). The latter equation is valid only for a homogeneous external medium (the wind model would require a much steeper ). The electron distribution index is , which is in agreement with the shock theory.
The X-ray decay slope after the break is too shallow for the break being due to a standard, sideways-expanding jet, in which case would be expected (Rhoads, 1999). The break magnitude may be consistent with a jet which propagates in a wind environment suffering no sideways expansion (for which ). However, the wind model is ruled out by the early-time optical data. A solution which satisfies all the avaliable constraints is a structured jet having a homogeneous core surrounded by power-law wings with energy profile (Panaitescu, 2005). The break magnitude is dependent upon the index (and on the location of ). With the observed values, we infer . The break magnitude below the cooling frequency (i.e. in the optical) is slightly different: . This difference, however, is quite small and may be easily missed.
It is interesting to compare the expected break time according to the -- relation (Ghirlanda et al., 2005; Liang & Zhang, 2005), where is the temporal break identified in optical data. According to this relation one would expect a break at s, for erg and keV, which is broadly consistent with the observed break time s. According to the Amati relation (Amati et al., 2002; Amati, 2006), the expected intrinsic spectral break is keV. This is generally consistent with the measured value keV.
7 Summary and conclusions
We have presented observations of GRB 060124, the first event for which both the prompt and the afterglow emission could be observed simultaneously and in their entirety by the three Swift instruments. Since BAT triggered on a precursor s before the main burst peak, Swift repointed the narrow field instruments to the burst position s before the main burst occurred. GRB 060124 also triggered Konus-Wind, which observed the prompt emission up to MeV energies. Thanks to these exceptional circumstances, we could report on the temporal and spectral properties of the prompt emission in the optical, X-ray and gamma-ray ranges, as well as on the optical and X-ray properties of the afterglow.
We find that while the X-ray emission (0.2–10 keV) clearly tracks the gamma-ray burst, the optical component follows a different pattern, likely indicating a different origin, possibly the onset of external shocks. The prompt GRB spectrum shows significant spectral evolution, with both the peak energy and the spectral index varying. As observed in several long GRBs, significant lags are measured between the hard- and low-energy components, showing that this behaviour extends over 3 decades in energy. The GRB peaks are shown to be much broader at soft energies. This is related to the temporal evolution of the spectrum, and can be accounted for by assuming the electron spectral index softened with time. The burst energy ( erg) and average rest-frame peak energy keV) make GRB 010624 consistent with the Amati relation. The X-ray afterglow is characterized by a decay presenting a break at s, possibly due to the crossing of the cooling frequency .
Acknowledgements.
We thank the referee for a swift and through report and D. A. Kann for useful discussions. This work is supported at OAB by ASI grant I/R/039/04, at Penn State by NASA contract NAS5-00136 and at the University of Leicester by PPARC. We gratefully acknowledge the contributions of dozens of members of the XRT and UVOT team at OAB, PSU, UL, GSFC, ASDC, and MSSL and our subcontractors, who helped make this instruments possible. The Konus-Wind experiment is supported by the Russian Space Agency contract and RFBR grant 06-02-16070.| Obs/mode | Energy range | ||
|---|---|---|---|
| (keV) | (s) | (s) | |
| XRT/WT | 0.2–1 | 338 | 160 |
| XRT/WT | 1–4 | 302 | 158 |
| XRT/WT | 4–10 | 291 | 138 |
| BAT | 15–25 | 321 | 60 |
| BAT | 25–50 | 324 | 54 |
| BAT | 50–100 | 298 | 50 |
| Konus | 300–1160 |
-
Note: errors on and are the time-resolution of the light curve used for the calculation. The Konus values are probably lower limits, due to low S/N effects.
| Filter | T(mid) | T(expo) | Magnitudea | Flux densityb |
|---|---|---|---|---|
| (s) | (s) | (mag) | ||
| 183.40 | 153.31 | |||
| 632.99 | 725.22 | |||
| 11477.47 | 139.43 | |||
| 17915.40 | 884.89 | |||
| 23674.52 | 884.87 | |||
| 29314.24 | 884.85 | |||
| 35202.82 | 1573.78 | |||
| 41022.66 | 1575.25 | |||
| 46782.58 | 1575.15 | |||
| 58332.60 | 4725.17 | |||
| 75672.93 | 4752.29 | |||
| 99028.58 | 7947.60 |
-
a
Vega magnitudes.
-
b
In units of erg cm-2 s-1 .
-
Note. Errors are 1- values. RMS errors in the photometric zero points have not been included. UVOT magnitudes were not corrected for Galactic extinction. Mid times are measured since the BAT trigger.
| Time/Instrument | Model | Photon index | Normalization | (dof) | Start | End | ||
|---|---|---|---|---|---|---|---|---|
| Selectiona | (1022 cm-2) | (keV) | (ph cm-2 s-1 keV-1) | (s) | (s) | |||
| BAT Precursor | PL | 0.2 | (3.40.4) 10-3(b) | 0.88 (57) | 13.5 | |||
| XRT-BAT Bin 1 | PL | (7.2 1.1) 10-3(b) | 0.96 (70) | 301.2 | 361.2 | |||
| XRT-BAT Bin 2 | PL | 2.8 | (1.26 0.09) 10-3(b) | 0.97 (137) | 361.2 | 451.2 | ||
| XRT-BAT-Konus Bin 3 | CPL | 3.5 | 132 | (3.0 0.2) 10-3(c) | 1.09 (404) | 451.2 | 571.2 | |
| XRT-BAT-Konus Bin 4 | CPL | 1.6 0.3 | 237 | (1.7 ) 10-3(c) | 0.99 (431) | 571.2 | 691.2 | |
| XRT-BAT-Konus Bin 5 | CPL | 28 | 4.1 10-4(c) | 0.83 (393) | 691.2 | 811.2 | ||
| XRT-BAT-Konus (1–5) | CPL | 1.9 0.2 | 0.02 | 193 | (c) | 1.06 (618) | 301.2 | 811.2 |
-
a
See Fig. 9.
-
b
Normalization () at 50 keV.
-
c
Normalization () at 100 keV.
| Energy band | Energy fluence | Peak photon flux | Peak energy flux |
|---|---|---|---|
| (keV) | (erg cm-2) | (ph cm-2 s-1) | (erg cm-2 s-1) |
| 0.5–2 | (1.26 0.03) 10-6 | 15.8 1.2 | (2.6 0.3) 10-8 |
| 2–30 | (7.3 0.1) 10-6 | 19.1 1.6 | (2.7 0.3) 10-7 |
| 30–400 | (1.8 0.1) 10-5 | 7.8 0.6 | (1.4 0.2) 10-6 |
| 25–50 | (3.60 0.07) 10-6 | 3.2 0.3 | (1.8 0.2) 10-6 |
| 50–100 | (4.7 0.1) 10-6 | 2.5 0.2 | (2.8 0.4) 10-7 |
| 100–300 | 8.7 10-6 | 2.6 0.2 | (7.1 0.9) 10-7 |
| 20–2000 | 2.5 10-5 | 10.7 0.9 | (2.2 0.3) 10-6 |
| 15–150 | (1.35 0.03) 10-5 | 9.7 0.8 | (7.8 1.0) 10-7 |
| 0.5–2000 | 3.2 10-5 | 43.4 3.5 | (2.4 0.3) 10-6 |
| Spectrum | Model | Photon index | (d.o.f.) | Start time | End time | Total exposure | |
|---|---|---|---|---|---|---|---|
| ( cm-2) | (s since ) | (s tince ) | (s) | ||||
| XRT PC (001)a | PL | 1.14 (56) | 11408 | 30726 | 5479 | ||
| XRT PC (002)a | PL | 1.10 (104) | 34398 | 111665 | 21979 | ||
| XRT PC (003)a | PL | 0.82 (27) | 115809 | 197945 | 18495 | ||
| XRT PC (004)a | PL | 1.62 (10) | 202206 | 272587 | 14269 | ||
| XRT PC (mean AG)a | PL | 1.07 (216) | 11408 | 475924 | 92360 |
-
a
Model WABS*ZWABS(POWER) with a Galactic cm-2 and free photon index and column density at the GRB redshift.
References
- Akerlof et al. (1999) Akerlof, C., Balsano, R., Barthelemy, S., et al. 1999, Nature, 398, 400
- Amati (2006) Amati, L. 2006, MNRAS, submitted, arXiv:astro-ph/0601553
- Amati et al. (2002) Amati, L., Frontera, F., Tavani, M., et al. 2002, A&A, 390, 81
- Aptekar et al. (1995) Aptekar, R. L., Frederiks, D. D., Golenetskii, S. V., et al. 1995, Space Science Reviews, 71, 265
- Ballet (1999) Ballet, J. 1999, A&AS, 135, 371
- Band et al. (1993) Band, D., Matteson, J., Ford, L., et al. 1993, ApJ, 413, 281
- Barthelmy et al. (2005a) Barthelmy, S. D., Barbier, L. M., Cummings, J. R., et al. 2005a, Space Science Review, 120, 143
- Barthelmy et al. (2005b) Barthelmy, S. D., Chincarini, G., Burrows, D. N., et al. 2005b, Nature, 438, 994
- Bhatt et al. (2006) Bhatt, B. C., Sahu, D. K., Srividya, S., & Chakradhari, N. K. 2006, GCN Circulars, 4597, 1
- Blake et al. (2005) Blake, C. H., Bloom, J. S., Starr, D. L., et al. 2005, Nature, 435, 181
- Boër et al. (2005) Boër, M., Atteia, J. L., Damerdji, Y., et al. 2005, arXiv:astro-ph/051038
- Burrows et al. (2005a) Burrows, D. N., Hill, J. E., Nousek, J. A., et al. 2005a, Space Science Review, 120, 165
- Burrows et al. (2005b) Burrows, D. N., Romano, P., Falcone, A., et al. 2005b, Science, 309, 1833
- Campana et al. (2006) Campana, S., Tagliaferri, G., Lazzati, D., et al. 2006, A&A, in press
- Cenko et al. (2006) Cenko, S. B., Berger, E., & Cohen, J. 2006, GCN Circulars, 4592, 1
- Dai et al. (2006) Dai, Z. G., Wang, X. Y., Wu, X. F., & Zhang, B. 2006, Science, 311, 1127
- Dickey & Lockman (1990) Dickey, J. M. & Lockman, F. J. 1990, ARA&A, 28, 215
- Falcone et al. (2006) Falcone, A. D., Burrows, D. N., Lazzati, D., et al. 2006, ApJ, 641, 1010
- Fan et al. (2002) Fan, Y.-Z., Dai, Z.-G., Huang, Y.-F., & Lu, T. 2002, Chinese Journal of Astronony and Astrophysics, 2, 449
- Fenimore et al. (2006) Fenimore, E., Barbier, L., Barthelmy, S., et al. 2006, GCN Circulars, 4586, 1
- Ford et al. (1995) Ford, L. A., Band, D. L., Matteson, J. L., et al. 1995, ApJ, 439, 307
- Fox et al. (2003) Fox, D. W., Price, P. A., Soderberg, A. M., et al. 2003, ApJ, 586, L5
- Gehrels et al. (2004) Gehrels, N., Chincarini, G., Giommi, P., et al. 2004, ApJ, 611, 1005
- Ghirlanda et al. (2005) Ghirlanda, G., Ghisellini, G., & Firmani, C. 2005, MNRAS, 361, L10
- Ghisellini et al. (2000) Ghisellini, G., Celotti, A., & Lazzati, D. 2000, MNRAS, 313, L1
- Golenetskii et al. (2006) Golenetskii, S., Aptekar, R., Mazets, E., et al. 2006, GCN Circulars, 4599, 1
- Greco et al. (2006) Greco, G., Bartolini, C., Guarnieri, A., et al. 2006, GCN Circulars, 4605, 1
- Hill et al. (2004) Hill, J. E., Burrows, D. N., Nousek, J. A., et al. 2004, in X-Ray and Gamma-Ray Instrumentation for Astronomy XIII. Edited by Flanagan, Kathryn A.; Siegmund, Oswald H. W. Proceedings of the SPIE, Volume 5165, pp. 217-231 (2004)., ed. K. A. Flanagan & O. H. W. Siegmund, 217–231
- Holland et al. (2006) Holland, S. T., Barthelmy, S., Burrows, D. N., et al. 2006, GCN Circulars, 4570, 1
- Kalberla et al. (2005) Kalberla, P. M. W., Burton, W. B., Hartmann, D., et al. 2005, A&A, 440, 775
- Kann (2006) Kann, D. A. 2006, GCN Circulars, 4574, 1
- King et al. (2005) King, A., O’Brien, P. T., Goad, M. R., et al. 2005, ApJ, 630, L113
- Klotz et al. (2006) Klotz, A., Boer, M., & Atteia, J. L. 2006, GCN Circulars, 4581, 1
- Kobayashi (2000) Kobayashi, S. 2000, ApJ, 545, 807
- Kobayashi et al. (2005) Kobayashi, S., Zhang, B., Mészáros, P., & Burrows, D. N. 2005, ApJ, submitted, arXiv:astro-ph/0506157
- Kumar & Panaitescu (2000) Kumar, P. & Panaitescu, A. 2000, ApJ, 541, L51
- Kumar & Panaitescu (2003) Kumar, P. & Panaitescu, A. 2003, MNRAS, 346, 905
- Lamb et al. (2006) Lamb, D., Ricker, G., Atteia, J., Kawai, N., & Woosley, S. 2006, GCN Circulars, 4601, 1
- Lazzati (2005) Lazzati, D. 2005, MNRAS, 357, 722
- Li et al. (2003) Li, W., Filippenko, A. V., Chornock, R., & Jha, S. 2003, ApJ, 586, L9
- Liang & Zhang (2005) Liang, E. & Zhang, B. 2005, ApJ, 633, 611
- Liang et al. (2006) Liang, E., Zhang, B., O’Brien, P. T., et al. 2006, ApJ, submitted, astro-ph/0602142
- Lipunov et al. (2006) Lipunov, V., Kornilov, V., Kuvshinov, D., et al. 2006, GCN Circulars, 4572, 1
- Lloyd & Petrosian (2000) Lloyd, N. M. & Petrosian, V. 2000, ApJ, 543, 722
- Lyutikov & Blandford (2003) Lyutikov, M. & Blandford, R. 2003, arXiv:astro-ph/0312347
- Mangano et al. (2006) Mangano, V., Cusumano, G., Parola, V. L., Mineo, T., & Burrows, D. N. 2006, GCN Circulars, 4578, 1
- Masetti et al. (2006) Masetti, N., Palazzi, E., Maiorano, E., et al. 2006, GCN Circulars, 4587, 1
- Mészáros & Rees (1997) Mészáros, P. & Rees, M. J. 1997, ApJ, 476, 232
- Mészáros & Rees (1999) Mészáros, P. & Rees, M. J. 1999, MNRAS, 306, L39
- Mészáros et al. (1994) Mészáros, P., Rees, M. J., & Papathanassiou, H. 1994, ApJ, 432, 181
- Mirabal & Halpern (2006) Mirabal, N. & Halpern, J. P. 2006, GCN Circulars, 4591, 1
- Misra (2006) Misra, K. 2006, GCN Circulars, 4589, 1
- Nakar & Piran (2004) Nakar, E. & Piran, T. 2004, MNRAS, 353, 647
- Nousek et al. (2006) Nousek, J. A., Kouveliotou, C., Grupe, D., et al. 2006, ApJ, in press, arXiv:astro-ph/0508332
- O’Brien et al. (2006) O’Brien, P. T., Willingale, R., Osborne, J., et al. 2006, ApJ, sumbitted, astro-ph/0601125
- Paciesas et al. (1999) Paciesas, W. S., Meegan, C. A., Pendleton, G. N., et al. 1999, ApJS, 122, 465
- Panaitescu (2005) Panaitescu, A. 2005, MNRAS, 362, 921
- Pe’er et al. (2005) Pe’er, A., Mészáros, P., & Rees, M. J. 2005, ApJ, 635, 476
- Pe’er & Waxman (2004) Pe’er, A. & Waxman, E. 2004, ApJ, 613, 448
- Perna et al. (2006) Perna, R., Armitage, P. J., & Zhang, B. 2006, ApJ, 636, L29
- Pilla & Loeb (1998) Pilla, R. P. & Loeb, A. 1998, ApJ, 494, L167
- Predehl & Schmitt (1995) Predehl, P. & Schmitt, J. H. M. M. 1995, A&A, 293, 889
- Prochaska et al. (2006) Prochaska, J. X., Foley, R., Tran, H., Bloom, J. S., & Chen, H.-W. 2006, GCN Circulars, 4593, 1
- Proga & Zhang (2006) Proga, D. & Zhang, B. 2006, ApJ, submitted, arXiv:astro-ph/0601272
- Quimby et al. (2006) Quimby, R. M., Rykoff, E. S., Yost, S. A., et al. 2006, ApJ, in press, arXiv:astro-ph/0511421
- Ramirez-Ruiz et al. (2002) Ramirez-Ruiz, E., MacFadyen, A. I., & Lazzati, D. 2002, MNRAS, 331, 197
- Rees & Mészáros (2005) Rees, M. J. & Mészáros, P. 2005, ApJ, 628, 847
- Rhoads (1999) Rhoads, J. E. 1999, ApJ, 525, 737
- Romano et al. (2006) Romano, P., Moretti, A., Banat, P. L., et al. 2006, A&A, 450, 59
- Roming et al. (2005a) Roming, P. W. A., Kennedy, T. E., Mason, K. O., et al. 2005a, Space Science Review, 120, 95
- Roming et al. (2005b) Roming, P. W. A., Schady, P., Fox, D. B., et al. 2005b, arXiv:astro-ph/0509273
- Rumyantsev et al. (2006) Rumyantsev, V., Biryukov, V., & Pozanenko, A. 2006, GCN Circulars, 4609, 1
- Ryde (2005) Ryde, F. 2005, ApJ, 625, L95
- Rykoff et al. (2006) Rykoff, E. S., Mangano, V., Yost, S. A., et al. 2006, ApJ, 638, L5
- Rykoff et al. (2005) Rykoff, E. S., Yost, S. A., Krimm, H. A., et al. 2005, ApJ, 631, L121
- Sari & Piran (1999a) Sari, R. & Piran, T. 1999a, ApJ, 517, L109
- Sari & Piran (1999b) Sari, R. & Piran, T. 1999b, ApJ, 520, 641
- Sari et al. (1998) Sari, R., Piran, T., & Narayan, R. 1998, ApJ, 497, L17+
- Schlegel et al. (1998) Schlegel, D. J., Finkbeiner, D. P., & Davis, M. 1998, ApJ, 500, 525
- Sonoda et al. (2006) Sonoda, E., Maeno, S., Nakamura, Y., Masuda, S., & Yamauchi, M. 2006, GCN Circulars, 4576, 1
- Tagliaferri et al. (2005) Tagliaferri, G., Goad, M., Chincarini, G., et al. 2005, Nature, 436, 985
- Tavani (1996) Tavani, M. 1996, Physical Review Letters, 76, 3478
- Torii (2006) Torii, K. 2006, GCN Circulars, 4596, 1
- Vaughan et al. (2006) Vaughan, S., Goad, M. R., Beardmore, A. P., et al. 2006, ApJ, 638, 920
- Vestrand et al. (2005) Vestrand, W. T., Wozniak, P. R., Wren, J. A., et al. 2005, Nature, 435, 178
- Woźniak et al. (2005) Woźniak, P. R., Vestrand, W. T., Wren, J. A., et al. 2005, ApJ, 627, L13
- Yonetoku et al. (2004) Yonetoku, D., Murakami, T., Nakamura, T., et al. 2004, ApJ, 609, 935
- Zhang et al. (2006) Zhang, B., Fan, Y. Z., Dyks, J., et al. 2006, ApJ, in press, arXiv:astro-ph/0508321
- Zhang & Kobayashi (2005) Zhang, B. & Kobayashi, S. 2005, ApJ, 628, 315
- Zhang et al. (2003) Zhang, B., Kobayashi, S., & Mészáros, P. 2003, ApJ, 595, 950
- Zhang & Mészáros (2002) Zhang, B. & Mészáros, P. 2002, ApJ, 581, 1236
| Sequence | Obs/mode | Start time (UT) | End time (UT) | Net exposure | Time since trigger |
| (yyyy-mm-dd hh:mm:ss) | (yyyy-mm-dd hh:mm:ss) | (s) | (s) | ||
| 00178750000 | BAT/event-by-event | 2006-01-24 15:54:13 | 2006-01-24 15:59:55 | 342.3 | |
| 00178750000 | BAT/mask-weighted LC | 2006-01-24 15:55:12 | 2006-01-24 16:14:51 | 1179.2 | 19.2 |
| 00178750000 | BAT/DPH | 2006-01-24 15:59:54 | 2006-01-24 16:08:24 | 510 | 301.2 |
| 00178750000 | XRT/IM | 2006-01-24 15:56:36 | 2006-01-24 15:56:38 | 2.5 | 104 |
| 00178750000 | XRT/WT | 2006-01-24 15:56:44 | 2006-01-24 16:11:34 | 867 | 112 |
| 00178750000 | XRT/PC | 2006-01-24 15:58:13 | 2006-01-24 15:59:01 | 15 | 200 |
| 00178750001 | XRT/PC | 2006-01-24 19:05:00 | 2006-01-25 00:26:58 | 5501 | 11408 |
| 00178750002 | XRT/PC | 2006-01-25 01:28:10 | 2006-01-25 22:55:56 | 22067 | 34399 |
| 00178750003 | XRT/PC | 2006-01-26 00:05:00 | 2006-01-26 22:53:56 | 18569 | 115809 |
| 00178750004 | XRT/PC | 2006-01-27 00:04:58 | 2006-01-27 19:37:58 | 14327 | 202206 |
| 00178750005 | XRT/PC | 2006-01-28 00:08:40 | 2006-01-30 23:17:57 | 47631 | 288829 |
| 00178750007 | XRT/PC | 2006-01-31 00:24:14 | 2006-02-01 23:24:57 | 44595 | 548963 |
| 00178750009 | XRT/PC | 2006-02-02 00:41:55 | 2006-02-02 08:42:03 | 4759 | 722824 |
| 00178750010 | XRT/PC | 2006-02-03 23:24:51 | 2006-02-03 23:35:58 | 667 | 891000 |
| 00178750011 | XRT/PC | 2006-02-04 11:58:22 | 2006-02-04 20:28:57 | 4816 | 936210 |
| 00178750012 | XRT/PC | 2006-02-05 13:40:08 | 2006-02-06 23:59:57 | 10779 | 1028716 |
| 00178750013 | XRT/PC | 2006-02-07 01:11:20 | 2006-02-07 23:49:58 | 9483 | 1156588 |
| 00178750014 | XRT/PC | 2006-02-08 01:12:24 | 2006-02-08 23:51:55 | 10310 | 1243053 |
| 00178750015 | XRT/PC | 2006-02-09 06:07:56 | 2006-02-09 23:56:57 | 6443 | 1347185 |
| 00178750016 | XRT/PC | 2006-02-10 00:04:58 | 2006-02-10 22:43:49 | 423 | 1411807 |
| 00178750017 | XRT/PC | 2006-02-11 01:42:30 | 2006-02-13 23:03:56 | 7248 | 1504059 |
| 00178750018 | XRT/PC | 2006-02-15 00:10:07 | 2006-02-15 22:55:56 | 11664 | 1844115 |
| 00178750019 | XRT/PC | 2006-02-17 00:20:47 | 2006-02-17 23:07:57 | 15741 | 2017556 |
| 00178750000 | UVOT/V | 2006-01-24 15:56:38 | 2006-01-24 15:59:14 | 153 | 106 |
| 00178750000 | UVOT/V | 2006-01-24 15:59:17 | 2006-01-24 16:11:34 | 725 | 265 |
| 00178750001 | UVOT/B | 2006-01-24 19:04:58 | 2006-01-24 19:07:20 | 139 | 11407 |
| 00178750001 | UVOT/UVM2 | 2006-01-24 19:35:31 | 2006-01-24 19:39:15 | 221 | 13239a |
| 00178750001 | UVOT/UVM2 | 2006-01-24 19:39:18 | 2006-01-24 19:40:03 | 43 | 13466a |
| 00178750001 | UVOT/B | 2006-01-24 20:45:53 | 2006-01-24 21:01:02 | 885 | 17461 |
| 00178750001 | UVOT/UVW2 | 2006-01-24 21:01:08 | 2006-01-24 21:04:53 | 221 | 18376a |
| 00178750001 | UVOT/UVW2 | 2006-01-24 21:04:56 | 2006-01-24 21:08:41 | 221 | 18604a |
| 00178750001 | UVOT/UVW2 | 2006-01-24 21:08:44 | 2006-01-24 21:12:29 | 221 | 18832a |
| 00178750001 | UVOT/UVW2 | 2006-01-24 21:12:32 | 2006-01-24 21:16:17 | 221 | 19060a |
| 00178750001 | UVOT/B | 2006-01-24 22:21:52 | 2006-01-24 22:37:01 | 885 | 23220 |
| 00178750001 | UVOT/UVW2 | 2006-01-24 22:37:07 | 2006-01-24 22:40:52 | 221 | 24135a |
| 00178750001 | UVOT/UVW2 | 2006-01-24 22:40:55 | 2006-01-24 22:44:40 | 221 | 24363a |
| 00178750001 | UVOT/UVW2 | 2006-01-24 22:44:43 | 2006-01-24 22:48:28 | 221 | 24591a |
| 00178750001 | UVOT/UVW2 | 2006-01-24 22:48:31 | 2006-01-24 22:52:16 | 221 | 24819a |
| 00178750001 | UVOT/B | 2006-01-24 23:55:52 | 2006-01-25 00:11:00 | 885 | 28860 |
| 00178750001 | UVOT/UVW2 | 2006-01-25 00:11:07 | 2006-01-25 00:14:52 | 221 | 29775a |
| 00178750001 | UVOT/UVW2 | 2006-01-25 00:14:55 | 2006-01-25 00:18:40 | 221 | 30003a |
| 00178750001 | UVOT/UVW2 | 2006-01-25 00:18:43 | 2006-01-25 00:22:28 | 221 | 30231a |
| 00178750001 | UVOT/UVW2 | 2006-01-25 00:22:31 | 2006-01-25 00:26:16 | 221 | 30459a |
| 00178750002 | UVOT/V | 2006-01-25 01:28:09 | 2006-01-25 01:55:00 | 1574 | 34398 |
| 00178750002 | UVOT/V | 2006-01-25 03:05:09 | 2006-01-25 03:32:00 | 1575 | 40217 |
| 00178750002 | UVOT/V | 2006-01-25 04:41:09 | 2006-01-25 05:08:00 | 1575 | 45977 |
| 00178750002 | UVOT/V | 2006-01-25 06:17:09 | 2006-01-25 09:57:00 | 4725 | 51737 |
| 00178750002 | UVOT/V | 2006-01-25 11:06:09 | 2006-01-25 14:46:00 | 4752 | 69078 |
| 00178750002 | UVOT/V | 2006-01-25 15:54:41 | 2006-01-25 22:56:00 | 7948 | 86389 |
-
a
Upper limit on detection.
Appendix A Pile-up estimation in XRT/WT data
The pile-up effect is a well known feature of CCD detectors (Ballet 1999). It occurs when the input count rate is so high that more than one X-ray photon is collected in a given pixel region defining an X-ray event in a single frame and the charges produced by the two separate events are recorded as one. This effect causes groups of relatively soft X-ray photons to be detected as one single high-energy photon. The observed spectrum of an astrophysical source, therefore, is distorted from its true form, with a general hardening of the slope (decrease of the photon index).
Another feature of CCD detectors is that the charge produced by a cosmic ray is usually spread over many pixels, as opposed to charge produced by X-ray photons. For this reason, a classification of the possible shapes of the charge distribution is defined associating to each of them a grade number: low grades correspond to confined charge distributions and high grades to extended charge distributions. Cosmic rays are then recognized and rejected on the basis of the event grade number. Pile-up also occurs when two X-rays are collected in neighbouring pixels in one frame. In this case groups of low grade events can be recorded as a single high grade event. Then, when pile-up occurs, the observed grade distribution of the events will show a deficit of low grade events and an excess of high grade events as compared with event grade distribution of fainter sources. Since higher grade events are rejected as cosmic rays, the pile-up effect causes an apparent loss of flux, particularly from the centre of the PSF where the count rate intensity is higher.
The standard way to correct for the pile-up effect is to determine the extension of the PSF core affected by pile-up and exclude from the analysis all the events that fell within that region. Based on the three observable effects we have described, three different methods can be formulated to check for the presence of pile-up and estimate the inner PSF region to exclude. They involve a study of the distortion of 1) the radial intensity profile; 2) the spectrum; 3) the grade distribution. The first method was discussed in detail by Vaughan et al. (2006), with particular attention to Swift-XRT observations in PC mode, and it is widely applied as standard correction technique for PC data. The present analysis will focus on the following two methods as favourite pile-up diagnostic tools for Swift-XRT WT data.
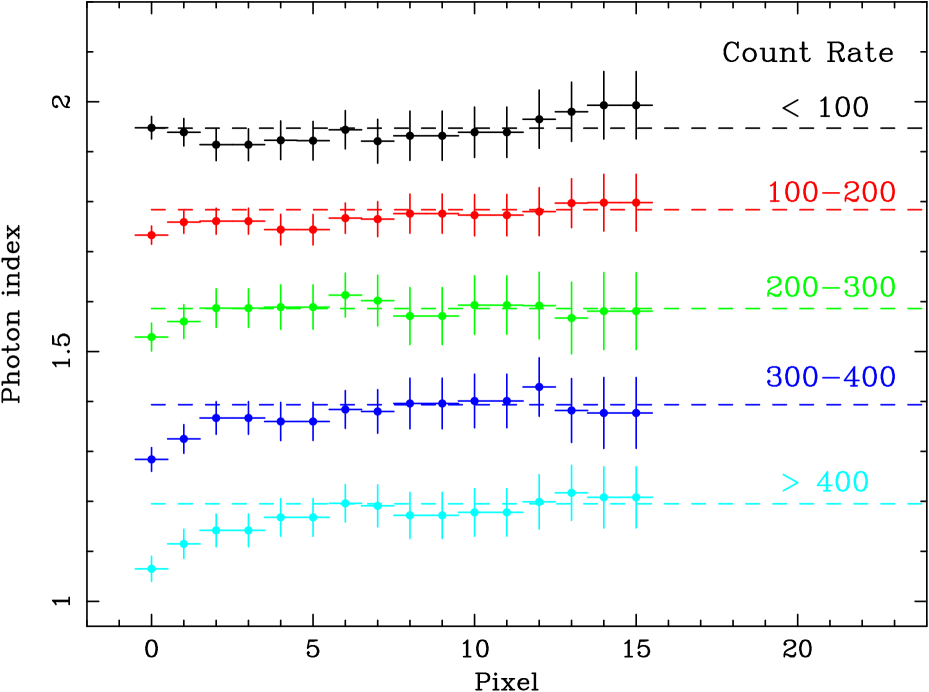
Ground testing and calibration of the XRT integrated system carried out in 2002 Sep. 23–Oct. 4 at the Panter laboratory of the Max-Planck-Institut fur extraterrestrische Physik showed that WT mode data are affected by pile-up for point source input intensities above 250 counts s-1. To determine the extent to which pile-up distorts the spectral shape, we selected 5 time intervals during which the observed source count rate was , 100–200, 200–300, 300–400, and counts s-1. For each count rate range, spectra were extracted from rectangular 4020-pixel regions (40 pixels long along the image strip and 20 pixels wide) with a region of increasing size (020–1520 pixels) excluded from its centre. The spectra were fit with an absorbed power law with fixed to the one obtained from the fit to the spectrum extracted with the exclusion of 15 pixels (which is assumed to be unaffected by piled-up). The spectra had 1433–2529 counts, depending on intensity cut and exclusion region. Figure 13 illustrates the pile-up-driven spectral changes. It demonstrates that in the range 0–100 counts s-1 the source is not piled-up, since no point deviates from the horizontal line, which represents the best fit to the photon index values obtained in the 10–15 pixel exclusion range. For this intensity range, there is no need to exclude any pixels from the extraction region. The source is only affected by moderate pile-up for 100–300 counts s-1; in this case it is necessary to exclude 1 pixel from the extraction region. Finally, two and four pixels must be excluded for 300–400 counts s-1) and counts s-1, respectively.
To determine the extent to which pile-up distorts the grades, we studied the grade distribution for the same 5 time intervals and the same exclusion regions as for the spectral study. We derive analogous conclusions on the number of pixels to exclude from the extraction regions as a function of observed source count rate. The definitions of XRT grades for timing modes are different from the ones for PC mode (Burrows et al. 2005a). Grades in WT span from 0 to 15, and good events are likely associated to grades from 0 to 2 only. If we assume that a good approximation of the expected grade distribution with no pile-up is obtained excluding 10 central pixels, the distributions we obtained show a deficit at grade zero (associated to an increase at higher grades) that becomes negligible if a region of at least 4-pixels is excluded.