“Anomalous” Optical GRB Afterglows are Common: Two Bursts, GRB 060206 and 06021011affiliation: Based on data from the MDM 2.4-m and 1.3-m telescopes
Abstract
We report on two recent gamma-ray bursts (GRBs), GRB 060206 and GRB 060210, for which we have obtained well-sampled optical light curves. Our data, combined with early optical data reported in the literature, shows unusual behavior for both afterglows. In -band GRB 060206 () experienced a slow early decay, followed by a rapid increase in brightness by factor about 1 hour after the burst. Its afterglow then faded in a broken power-law fashion, with a smooth break at days, but with additional, less dramatic () “bumps and wiggles”, well detected in the densely sampled light curve. The -band afterglow of GRB 060210 () is also unusual: the light curve was more or less flat between 60 and sec after the burst, followed by increase at sec after the burst, after which the light curve declined as a power-law. Despite reports to the contrary, we find that for GRB 060206 X-rays follow the optical decay, but with significant variations on short timescales. However, the X-ray afterglow is contaminated by a nearby, variable source, which especially at late times obscures the behavior of the X-ray afterglow. The early X-ray light curve of GRB 060210 exhibited two sharp flares, without corresponding peaks in the optical light. We find that the late X-ray light curve is well described by a broken power-law model, with a smooth break at hours after the burst. The early decay index of the X-ray light curve is not consistent with the power-law seen in optical.
We argue that “anomalous” optical afterglows are likely to be the norm, and that the rapid variations often seen in Swift-XRT data would also be seen in the optical light curves, given good enough sampling. As a result, some of the often employed procedures, such as deriving the jet opening angle using a broken power-law fit to the optical light curves, in many cases might have a poor statistical significance. Finally, we argue that the rapid rise at sec in the optical for GRB 060206 and the optical bump at sec in GRB 060210 might be due to the turn-on of the external shock. If indeed the case, the existence and timing of such features could provide valuable additional information about the energy of the GRB jet and the density of the circumburst medium it is plowing into.
1 Introduction
Gamma-ray bursts (GRBs) continue to surprise us. With the Swift satellite (Gehrels et al., 2004) providing quick and accurate localizations for many bursts (for example, 20 GRBs were localized between January 1st - February 15th, 2006), it is now possible to find and study in even more detail bursts which are “unusual”. Those are more than just mere curiosity—they test and verify our understanding of physics of these extreme events.
The physics of GRB afterglow emission appears on solid footing. The GRB sweeps up ambient gas and the resulting shock emits synchrotron radiation from X-rays to radio wavelengths (e.g. Piran, 2005). The light curve decays as a power-law with a break when the opening angle of the beamed emission exceeds the opening angle of the jet (e.g., Stanek et al. 1999; Rhoads 1999). But the fast localizations of the Swift satellite means that optical and X-ray observations can begin before the -rays have completely faded. The transition between the end of the “prompt” emission and the rise of the shocked ambient gas emission is uncertain territory. Internal shocks may be the source of prompt emission or continued activity from the central engine may inject more energy into the external shock. Deciphering the effects of these processes requires high-quality observations obtained rapidly after the burst. What also helps is time dilation. High-redshift bursts have the advantage of being observed in slow motion.
Two such high-redshift bursts have been recently detected by the Swift satellite. GRB 060206 triggered Swift-BAT on Feb. 6, 04:46:53 UT (Morris et al., 2006a). A likely afterglow has been identified by Fynbo et al. (2006a), who also determined that the afterglow was at high redshift of (Fynbo et al., 2006b). A presence of a bright afterglow has been reported by several groups, most notably by RAPTOR (Wozniak et al., 2006a), who indicated that the afterglow has increased in brightness by mag about 1 hour after the burst. Wozniak et al. (2006b) has released detailed description of the RAPTOR data for this event, which we will discuss later in this paper.
GRB 060210 triggered Swift-BAT on Feb. 10, 04:58:50 UT (Beardmore et al., 2006a). Fox & Cenko (2006) have quickly identified a possible afterglow, and Cucchiara et al. (2006) measured a high redshift of . KAIT robotic telescope has obtained extensive optical observations starting as soon as 62 sec after the burst (Li, 2006a), indicating that the afterglow brightened by 0.4 mag by 9 minutes after the burst (Li, 2006b). Beardmore et al. (2006b) reported on the Swift-XRT data, which showed two strong flares 200 sec and 385 sec after the trigger, followed by a power-law decay.
In this paper we report on our optical follow-up of these two bursts. Our data, described in Section 2, combined with the data reported in the literature clearly shows two very unusual optical afterglows, whose evolution we describe in Section 3. In section 4 we analyze Swift-XRT data for these two events. We briefly summarize our results and discuss their implications in Section 5.
2 The Optical and X-Ray Data
The majority of our data were obtained with the MDM-2.4m telescope, with additional data obtained using the MDM-1.3m telescope. For the bright afterglow of GRB 060206, we have obtained 83 high signal-to-noise -band images between 1.7 and 8.7 hours after the burst, followed by additional 16 -band images during the next two nights. For the much fainter afterglow of GRB 060210, we have obtained 12 -band images between 0.48 and 2.0 hours after the burst, until the object has set.
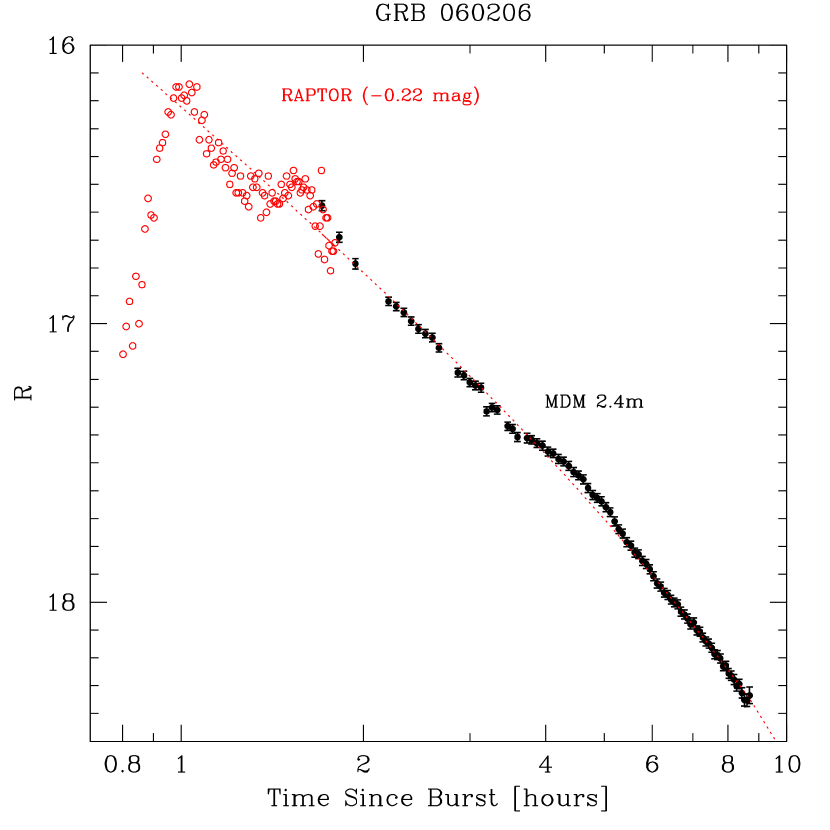
All the light curves were extracted using ISIS2 image subtraction package (Alard, 2000). To obtain absolute calibration, for GRB 060206 we used nine stars in the field with SDSS photometry (Cool et al., 2006; Adelman-McCarthy et al., 2006) to transform to the standard system fitting a zero-point difference and a color-term. We used the transformation equations of Lupton (2005) to transform SDSS griz magnitudes to BVRI. For future references and cross-calibrations, this transformation gives mag and mag for the star SDSS J133130.4+350416.1. We assumed mag for the afterglow (Greco et al., 2006). The absolute photometric calibration is thought to be better than 5%. We found that in order to match Wozniak et al. (2006b) data to our data, we had to subtract mag from their unfiltered -band magnitudes (see Fig.2). This offset does not affect any of our conclusions. For GRB 060210 we used the calibration of the field obtained with the KAIT telescope (Li et al. 2006, in preparation). A USNO-B1 (Monet et al., 1998) star 1170-0048923 at 03:50:53.00, 27:01:30.54 (J2000), which is close to the GRB, is measured at mag using KAIT calibration, mag fainter than the USNO magnitude. This is not unusual, since the magnitudes of stars in the USNO-B1 catalog were obtained with photographic plates. Tables 1 and 2 present our -band photometry for the two bursts.
We have also analyzed the X-ray data obtained by the Swift-XRT
instrument. We started with the XRT level 2 event files for both the
windowed timing mode and the photon counting mode observations. There
was a hot CCD column in the windowed timing observation for
GRB 060206. We filtered the events on these hot CCD pixels. We used
the
xselect111http://heasarc.gsfc.nasa.gov/docs/software/lheasoft/ftools/xselect/xselect.html
software package to extract the X-ray light curves and spectra. The
background subtracted light curves were adaptively binned according to
the signal-to-noise ratios. We fit the spectra with XSPEC
(Arnaud 1996) to convert XRT count rates to fluxes. We use the
rmf files from standard XRT calibration distribution, and
generated the arf files with the Swift-XRT software tool
xrtmkarf222http://swift.gsfc.nasa.gov/docs/swift/analysis/xrt_swguide_v1_2.pdf
.
3 Evolution of Optical Afterglows
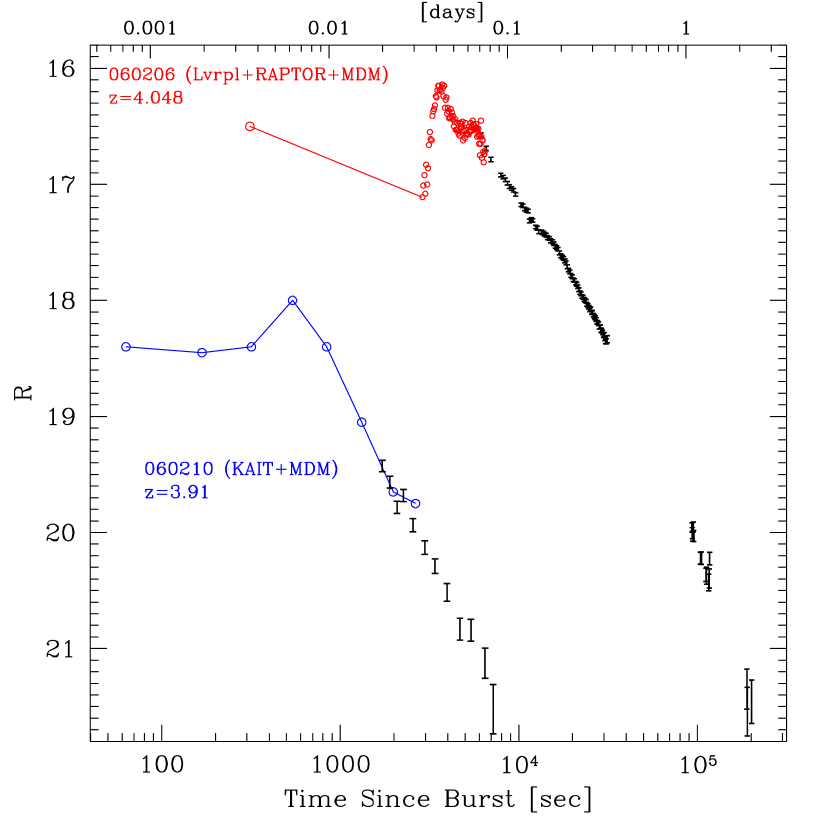
Figure 1 presents the -band light curves for GRB 060206 and GRB 060210 (see Tables 1,2). In addition to our MDM 2.4-m data, we have added some data from the literature to extend the time coverage. For GRB 060206, we add one early data point from Guidorzi et al. (2006) and 101 densely sampled RAPTOR data points from Wozniak et al. (2006b). For GRB 060210, we add eight very early data points from the KAIT telescope reported by Li (2006a, b). All the literature data were brought to the common zero-point with our data, using overlaps between the data sets.
Figure 1 shows most unusual behavior for both afterglows. As described in detail by Wozniak et al. (2006b), GRB 060206 experienced a slow early decay, followed by a rapid increase in brightness by mag about 1 hour after the burst. Its afterglow then faded in a typical broken power-law fashion, with a smooth break at days, but with additional, less dramatic () “bumps and wiggles”, well detected in the densely sampled light curves. These deviations from smooth decay can be seen better in Figure 2, where we show the RAPTOR data and our first night MDM data.
To characterize the long timescales behavior of its afterglow, we have fit all our GRB 060206 -band data with the broken power-law model of Beuermann et al. (1999) (see also Stanek et al. 2001):
| (1) |
where is the time of the break, is the -band flux at and is a parameter which determines the sharpness of the break, where a larger gives a sharper break. This formula smoothly connects the early time decay () with the later time decay (). The fit results in the following values for the parameters: days. Given that the data show clear variations from the smooth behavior, these are only approximate values, and should be treated with caution (see the Discussion below). The overall fit is reasonable and it supports a break in the light curve, traditionally interpreted as a jet break (e.g. Stanek et al., 1999). This is broadly consistent with the behavior in other optical bands reported by LaCluyze et al. (2006) and Reichart et al. (2006).
The -band afterglow of GRB 060210 () closely resembles recently reported behavior of GRB 0508101 (Rykoff et al., 2006), who called that event an “Anomalous Early Afterglow”. The light curve of GRB 060210, as reported by Li (2006b), was more or less flat between 60 and sec after the burst, followed by mag increase by sec after the burst. Using Li (2006b) and our data we show that the light curve then declined as a power-law. If we bring GRB 060210 to a fiducial redshift of , which is close to a likely redshift of GRB 050801 (Rykoff et al., 2006), then these two burst are even closer in their evolution, as can be seen comparing to their Figure 1.
4 Comparison of Optical to X-Ray Data
Given the unusual behavior observed in the optical wavelengths for these two bursts, it is useful to investigate their X-ray light curves as well. Indeed, X-ray afterglows observed by Swift-XRT have been shown to have features (Nousek et al., 2006) not expected in the standard afterglow models, including giant flares such as observed in GRB 050502B (Falcone et al., 2006). The origin of the flares is still under investigation (e.g. Zhang et al., 2006; Perna et al., 2005).
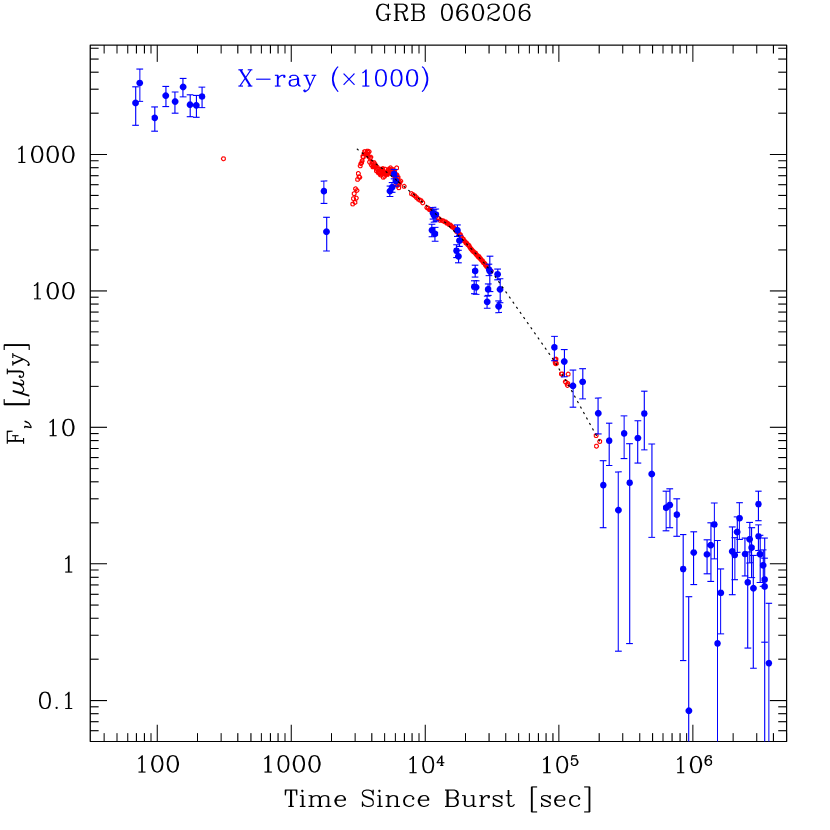
In Figure 3 we compare the X-ray to optical light curves for GRB 060206. While it was intrinsically a very bright afterglow in optical, it was a faint X-ray event, with the ratio of . Despite earlier reports to the contrary (Morris et al., 2006b), the overall behavior between the two bands is similar, but with clear short-timescale variations, as reported before by Morris et al. (2006b). However, by analyzing the later XRT observation, we clearly see a nearby, contaminating X-ray source, about away. This nearby source is most likely variable, obscuring the true behavior of the X-ray afterglow, especially at later times. That also explains the flattening of the late X-ray light curve, as seen in Figure 3.
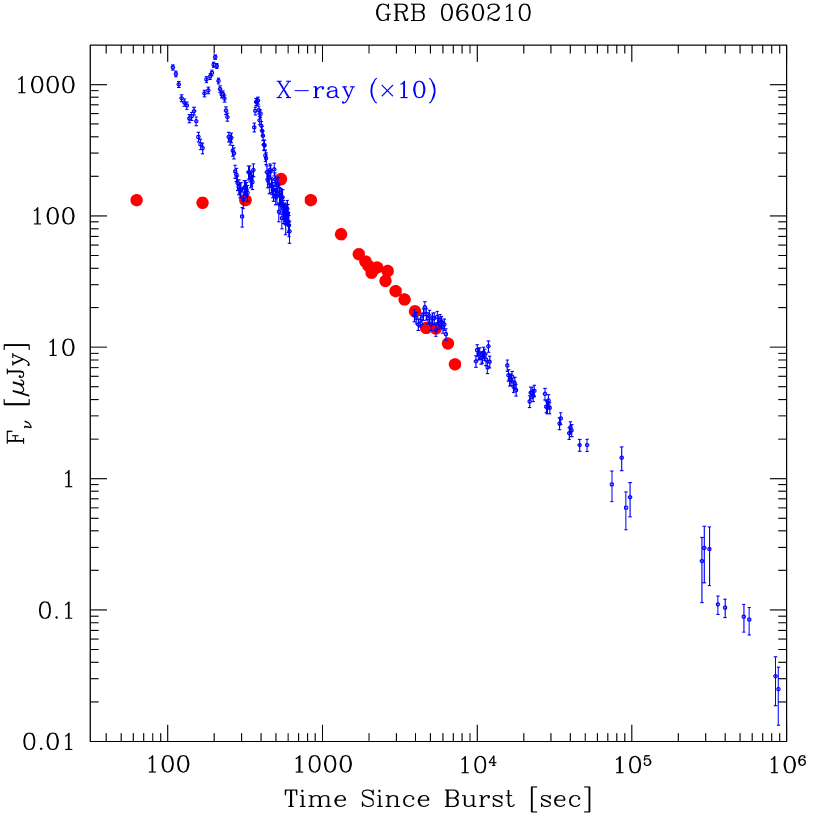
In Figure 4 we compare the X-ray to optical light curves for GRB 060210. Here the ratio of , much lower than for GRB 060206. As reported by Beardmore et al. (2006b), X-rays show two strong flares 200 sec and 385 sec after the trigger, followed by a smoother decay. As already reported by Dai & Stanek (2006), the analysis of the entire XRT light curve indicates a presence of a broken power-law. They fitted both a single power-law and a broken power-law model to the XRT light curve from sec to sec after the BAT trigger. For the single power-law model they found a decay index of , but the fit was poor. For the broken power-law model they found , hours, with the broken power-law providing a much better fit. The power-law decay index for the X-ray light curve before the jet break is not consistent with the optical decay index of discussed above. It would be most interesting to add later -band data for this event to see if the X-rays are indeed different from optical.
We note that the X-ray flares in GRB 060210 do not have corresponding optical peaks (as far as we can tell from the data reported by Li, 2006b). This would indicate that the X-ray flares are occurring in a different region from where the optical light is formed.
5 Summary and Discussion
We have presented optical light curves for two recent afterglows, GRB 060206 and GRB 060210. They both show unusual behavior, with significant re-brightening by as much as factor of about 1 hour (min in the rest frame) after the burst in case of 060206. GRB 060210 also shows unusual optical evolution, similar to “anomalous afterglow” of GRB 050801 recently described by Rykoff et al. (2006). Both bursts show complex behavior in the X-rays as seen with Swift-XRT instrument.
Significant “bumps an wiggles” have been seen before in a number of optical afterglows. One of the first well-observed afterglows, GRB 970508 (e.g. Galama et al., 1998) had a light curve rather similar in shape to GRB 060206, as it brightened by mag by days after the burst, after which it decayed is a smooth power-law fashion. GRB 000301C exhibited achromatic, short-timescale bump that was difficult to reconcile with the standard relativistic shock model, and which was proposed to be caused by microlensing (Garnavich et al., 2000). GRB 021004 (e.g. Bersier et al., 2003) was not only bumpy, but also showed clear color variations in optical bands (Bersier et al., 2003; Matheson et al., 2003a). GRB 030329 was so bumpy (e.g. Matheson et al., 2003b) that if not for the spectroscopic observations (e.g. Stanek et al., 2003), we would still argue if it showed a “supernova bump” or not. In fact, a significant deviations from a smooth decay have been seen in the light curve of GRB 030329 as late as two months after the burst (so called “jitter event”: Matheson et al. 2003b; Bersier et al. 2006, in preparation). Bumps have also been seen in some previous Swift afterglows (e.g., GRB 050525a: Klotz et al. 2005).
Given the above and the two bursts discussed in this paper, it is becoming clear that the “unusual” or “anomalous” optical afterglows might be more of a norm than an exception. And while “nice and smooth” afterglows have been seen as well (e.g. GRB 990510: Stanek et al. 1999; GRB 020813: Laursen & Stanek 2003; GRB 041006: Stanek et al. 2005) in some well-observed cases, the large number of anomalous optical afterglows can no longer be seen as a small wrinkle on the standard afterglow model. In fact, unless there is sufficient data to suggest otherwise, it would be only prudent to assume that any given afterglow might be anomalous. As a result, some of the often employed procedures, such as deriving the jet opening angle using a broken power-law fit to the optical light curve, in many cases might have a poor statistical significance and be simply not applicable.
Finally, given the totality of the data presented in this paper, we believe that the rise at sec in the optical for GRB 060206 and the optical bump at sec in GRB 060210 might be due to the turn-on of the external shock—that is, the GRB jet has swept up enough circumstellar/interstellar gas and the magnetic field has developed enough so the standard afterglow has turned-on and it starts to dominate the light in both X-rays and optical. If that is indeed the case, the existence and timing of such features could provide valuable additional information about the energy of the GRB jet and the density of the circumburst medium it is plowing into. This idea is discussed in more detail by Rykoff et al. (2006), when describing the “anomalous afterglow” of GRB 050801.
References
- Adelman-McCarthy et al. (2006) Adelman-McCarthy J. K., et al. 2006, ApJS, 162, 38
- Alard (2000) Alard, C. 2000, A&AS, 144, 363
- Arnaud (1996) Arnaud, K.A., 1996, ASP Conf. Ser. 101: Astronomical Data Analysis Software and Systems V, ed. Jacoby G. & Barnes J., 17
- Beardmore et al. (2006a) Beardmore, A., et al. 2006a, GCN 4724
- Beardmore et al. (2006b) Beardmore, A., et al. 2006b, GCN 4733
- Bersier et al. (2003) Bersier, D., et al. 2003, ApJ, 584, L43
- Beuermann et al. (1999) Beuermann, K., et al. 1999, A&A, 352, 26
- Cool et al. (2006) Cool, R. J., et al. 2006, GCN 4695
- Cucchiara et al. (2006) Cucchiara, A., et al. 2006, GCN 4729
- Dai & Stanek (2006) Dai, X., & Stanek, K. Z. 2006, GCN 5147
- Falcone et al. (2006) Falcone, A. D., et al. 2006, ApJ, in press (astro-ph/0512615)
- Fox & Cenko (2006) Fox, D. B., & Cenko, S. B. 2006, GCN 4723
- Fynbo et al. (2006a) Fynbo, J. P. U, et al. 2006a, GCN 4683
- Fynbo et al. (2006b) Fynbo, J. P. U, et al. 2006b, GCN 4692
- Galama et al. (1998) Galama, R. J., et al. 1998, ApJ, 497, L13
- Garnavich et al. (2000) Garnavich, P. M., Loeb, A., & Stanek, K. Z. 2000, ApJ, 544, L11
- Gehrels et al. (2004) Gehrels, N., et al. 2004, ApJ, 611, 1005
- Greco et al. (2006) Greco, G., et al. 2006, GCN 4732
- Guidorzi et al. (2006) Guidorzi, C., et al. 2006, GCN 4693
- Klotz et al. (2005) Klotz, A., et al. 2005, A&A, 439, L35
- LaCluyze et al. (2006) LaCluyze, A., et al. 2006, GCN 4750
- Laursen & Stanek (2003) Laursen, L. T. & Stanek, K. Z., 2003, ApJ, 597, L107
- Li (2006a) Li, W. 2006a, GCN 4725
- Li (2006b) Li, W. 2006b, GCN 4727
-
Lupton (2005)
Lupton, R. 2005
(http://www.sdss.org/dr4/algorithms/sdssUBVRITransform.htm) - Matheson et al. (2003a) Matheson, T., et al. 2003a, ApJ, 582, L5
- Matheson et al. (2003b) Matheson, T., et al. 2003b, ApJ, 599, 394
- Monet et al. (1998) Monet, D. G., et al. 2003, AJ, 125, 984
- Morris et al. (2006a) Morris, D. C., et al. 2006a, GCN 4682
- Morris et al. (2006b) Morris, D. C., et al. 2006b, GCN 4764
- Nousek et al. (2006) Nousek, J. A., et al. 2006, ApJ, in press (astro-ph/0508332)
- Perna et al. (2005) Perna, R., Armitage, P. J., & Zhang, B. 2006, ApJ, 636, L29
- Piran (2005) Piran, T. 2005, RvMP, 76, 1143
- Reichart et al. (2006) Reichart, D., et al. 2006, GCN 4768
- Rhoads (1999) Rhoads, J. E. 1999, ApJ, 525, 737
- Rykoff et al. (2006) Rykoff, E. S., et al. 2006, ApJ, 638, 5
- Stanek et al. (1999) Stanek, K. Z., et al. 1999, ApJ, 522, L39
- Stanek et al. (2001) Stanek, K. Z., et al. 2001, ApJ, 563, 592
- Stanek et al. (2003) Stanek, K. Z., et al. 2003, ApJ, 591, L17
- Stanek et al. (2005) Stanek, K. Z., et al. 2005, ApJ, 626, L5
- Wozniak et al. (2006a) Wozniak, P. R., et al. 2006a, GCN 4687
- Wozniak et al. (2006b) Wozniak, P. R., et al. 2006b, ApJ, 642, L99
- Zhang et al. (2006) Zhang, B., et al. 2006, ApJ, 642, 354
| Time | ||
|---|---|---|
| 0.0712 | 16.576 | 0.018 |
| 0.0760 | 16.690 | 0.018 |
| 0.0809 | 16.785 | 0.019 |
| 0.0917 | 16.920 | 0.015 |
| 0.0944 | 16.938 | 0.015 |
| 0.0972 | 16.960 | 0.015 |
| 0.1000 | 16.991 | 0.015 |
| 0.1027 | 17.019 | 0.015 |
| 0.1055 | 17.036 | 0.015 |
| 0.1083 | 17.050 | 0.015 |
| 0.1110 | 17.087 | 0.015 |
| 0.1193 | 17.176 | 0.016 |
| 0.1221 | 17.186 | 0.015 |
| 0.1249 | 17.211 | 0.015 |
| 0.1276 | 17.222 | 0.016 |
| 0.1304 | 17.230 | 0.016 |
| 0.1332 | 17.315 | 0.016 |
| 0.1359 | 17.301 | 0.015 |
| 0.1387 | 17.310 | 0.015 |
| 0.1442 | 17.368 | 0.015 |
| 0.1470 | 17.378 | 0.016 |
| 0.1498 | 17.407 | 0.016 |
| 0.1553 | 17.411 | 0.017 |
| 0.1581 | 17.417 | 0.015 |
| 0.1612 | 17.429 | 0.016 |
| 0.1646 | 17.438 | 0.016 |
| 0.1681 | 17.459 | 0.016 |
| 0.1715 | 17.466 | 0.015 |
| 0.1750 | 17.486 | 0.016 |
| 0.1785 | 17.495 | 0.016 |
| 0.1819 | 17.511 | 0.016 |
| 0.1854 | 17.533 | 0.016 |
| 0.1889 | 17.545 | 0.016 |
| 0.1923 | 17.559 | 0.016 |
| 0.1958 | 17.590 | 0.016 |
| 0.1992 | 17.615 | 0.016 |
| 0.2027 | 17.626 | 0.016 |
| 0.2062 | 17.638 | 0.016 |
| 0.2096 | 17.659 | 0.016 |
| 0.2131 | 17.677 | 0.016 |
| 0.2165 | 17.710 | 0.016 |
| 0.2200 | 17.738 | 0.016 |
| 0.2235 | 17.754 | 0.016 |
| 0.2269 | 17.785 | 0.016 |
| 0.2304 | 17.797 | 0.016 |
| 0.2339 | 17.822 | 0.016 |
| 0.2373 | 17.828 | 0.016 |
| 0.2408 | 17.852 | 0.016 |
| 0.2442 | 17.863 | 0.016 |
| 0.2477 | 17.882 | 0.016 |
| 0.2512 | 17.907 | 0.016 |
| 0.2546 | 17.933 | 0.016 |
| 0.2581 | 17.944 | 0.016 |
| 0.2615 | 17.966 | 0.016 |
| 0.2650 | 17.974 | 0.016 |
| 0.2684 | 17.991 | 0.016 |
| 0.2719 | 18.001 | 0.016 |
| 0.2754 | 18.008 | 0.016 |
| 0.2789 | 18.034 | 0.016 |
| 0.2823 | 18.044 | 0.016 |
| 0.2858 | 18.059 | 0.016 |
| 0.2892 | 18.080 | 0.016 |
| 0.2927 | 18.073 | 0.016 |
| 0.2962 | 18.101 | 0.016 |
| 0.2996 | 18.106 | 0.016 |
| 0.3031 | 18.127 | 0.016 |
| 0.3065 | 18.141 | 0.016 |
| 0.3100 | 18.149 | 0.016 |
| 0.3135 | 18.164 | 0.016 |
| 0.3169 | 18.187 | 0.016 |
| 0.3204 | 18.190 | 0.016 |
| 0.3238 | 18.202 | 0.016 |
| 0.3273 | 18.230 | 0.016 |
| 0.3308 | 18.228 | 0.016 |
| 0.3342 | 18.256 | 0.017 |
| 0.3377 | 18.264 | 0.017 |
| 0.3411 | 18.278 | 0.018 |
| 0.3446 | 18.302 | 0.018 |
| 0.3481 | 18.294 | 0.017 |
| 0.3515 | 18.326 | 0.019 |
| 0.3550 | 18.351 | 0.022 |
| 0.3585 | 18.353 | 0.022 |
| 0.3619 | 18.335 | 0.030 |
| 1.0802 | 19.957 | 0.041 |
| 1.0844 | 20.006 | 0.048 |
| 1.0910 | 20.032 | 0.043 |
| 1.0993 | 19.952 | 0.042 |
| 1.1076 | 20.030 | 0.047 |
| 1.2053 | 20.221 | 0.052 |
| 1.2137 | 20.222 | 0.054 |
| 1.2220 | 20.222 | 0.054 |
| 1.2939 | 20.364 | 0.057 |
| 1.3023 | 20.373 | 0.073 |
| 1.3407 | 20.431 | 0.072 |
| 1.3490 | 20.397 | 0.082 |
| 1.3556 | 20.224 | 0.055 |
| 2.1932 | 21.350 | 0.173 |
| 2.2033 | 21.543 | 0.209 |
| 2.3331 | 21.458 | 0.187 |
Note. — Table 1 is available in its entirety in the electronic version of the Journal. A portion is shown here for guidance regarding its form and content.
| Time | ||
|---|---|---|
| 0.0199 | 19.427 | 0.050 |
| 0.0220 | 19.566 | 0.051 |
| 0.0240 | 19.783 | 0.053 |
| 0.0261 | 19.681 | 0.052 |
| 0.0296 | 19.938 | 0.057 |
| 0.0344 | 20.130 | 0.059 |
| 0.0393 | 20.291 | 0.063 |
| 0.0459 | 20.516 | 0.076 |
| 0.0542 | 20.833 | 0.094 |
| 0.0625 | 20.842 | 0.093 |
| 0.0749 | 21.127 | 0.130 |
| 0.0832 | 21.523 | 0.212 |
Note. — Table 2 is available in its entirety in the electronic version of the Journal. A portion is shown here for guidance regarding its form and content.