Quasi Periodic Oscillations and Strongly Comptonized X-ray emission from Holmberg IX X-1
Abstract
We report the discovery of a quasi-periodic oscillation (QPO) in the X-ray emission from a bright ultra-luminous X-ray source (ULX) Holmberg IX X-1 using a long XMM-Newton observation. The QPO has a centroid at , a coherence and an amplitude (rms) of in the band. This is only the second detection of a QPO from an ULX, after M 82 X-1, and provides strong evidence against beaming. The power spectrum is well fitted by a power law with an index of . The total integrated power (rms) is in the range. The X-ray spectrum shows clear evidence for a soft X-ray excess component that is well described by a multicolor disk blackbody () and a high energy curvature that can be modeled either by a cut-off power law (; ) or as a strongly Comptonized continuum in an optically thick () and cool () plasma. Both the presence of the QPO and the shape of the X-ray spectrum strongly suggest that the ULX is not in the high/soft or thermally dominated state. A truncated disk and inner optically thick corona may explain the observed X-ray spectrum and the presence of the QPO.
Subject headings:
accretion, accretion disks — stars: individual (Holmberg IX X-1; M81 X-9) — X-rays: stars1. Introduction
Ultra-luminous X-ray sources (ULXs) are extra-nuclear point X-ray sources with luminosities exceeding the Eddington limit for a black hole (BH). The most popular model to explain the high luminosities of ULX is the “intermediate mass BH” with mass (e.g., Colbert & Mushotzky 1999). Other popular models include X-ray binaries (XRBs) with anisotropic emission (King et al. 2001), beamed XRBs with relativistic jets directly pointing towards us i. e., scaled down versions of blazars (Mirabel & Rodriguez 1999), and XRBs with super-Eddington accretion rates (Begelman 2002).
There is now extensive study of X-ray spectra of ULXs with XMM-Newton & Chandra. ULXs show a variety of spectral shapes: () simple power law similar to the low/hard state of BH XRBs (Winter, Mushotzky & Reynolds 2005), () disk blackbody () plus power law similar to the high/soft state of BH XRBs (see e.g., Feng & Kaaret 2005), () strongly curved spectra at high energies (Stobbart, Roberts & Warwick 2004; Feng & Kaaret 2005; Agrawal & Misra 2006; Dewangan, Griffiths & Rao 2006a; Stobbart, Roberts & Wilms 2006) without a corresponding spectral state in BH XRBs. These spectra are physically well described by a cool disk and thermal Comptonization in an optical thick corona. The cool disk plus power-law spectra of ULXs may not always correspond to the high/soft state of BH XRBs (see Roberts et al. 2005; Dewangan et al. 2006a). The detailed variability properties of ULXs are yet to be known. It is important to study both the spectral and temporal characteristics of ULXs to understand their nature. BH XRBs exhibit characteristic power density spectra (PDS) depending on their X-ray spectral state (McClintock & Remillard 2003). Many BH XRBs show quasi-periodic oscillations (QPOs) and breaks in their PDS that represent characteristic timescales close to the BH. These characteristic frequencies scale with the mass of the BH. Therefore, determination of the shape of the PDS and the detection of QPOs is crucial to understand the nature of ULXs. To date, there is only one ULX, M 82 X-1, that is known to show QPOs (Strohmayer & Mushotzky 2003; Fiorito & Titarchuk 2004; Dewangan, Titarchuk & Griffiths 2006b; Mucciarelli et al. 2006).
In this Letter, we report the discovery of a QPO from the bright ULX Holmberg IX X-1 (hereafter Ho IX X-1; also known as M81 X-9) based on a long XMM-Newton observation. The ULX is located in the dwarf irregular galaxy Holmberg IX, a companion to M 81. The position of the ULX is away from the optical center of the host galaxy. Ho IX X-1 is a bright X-ray source () that is variable on time scales of weeks and months (La Parola et al. 2001). Miller, Fabian & Miller (2004) presented X-ray spectra of Ho IX X-1 based on two snapshot XMM-Newton observations. The spectra were modeled by a cool () disk emission and simple power-law components. Miller et al. (2004) suggested a BH mass of by scaling the disk temperatures measured in Ho IX X-1 to those usually observed in BH XRBs in their high state. Here we present power and energy spectral analysis and show evidence for a QPO and high energy spectral curvature.
2. Observation & Data Reduction
XMM-Newton observed Holmberg IX on 2004 September 26 for . The EPIC PN and MOS cameras were operated in the large window and the full frame modes, respectively, using the thin filter. We used SAS version 6.5.0 and the most recent calibration database to process and filter the event data. Examination of the background rate above showed that the observation is completely swamped by the particle background after an elapsed time of and this latter period was therefore excluded from the rest of the analysis. For temporal analysis, we used all the PN and MOS events with patterns and a continuous exposure of during which both the PN and MOS cameras operated simultaneously. For spectral analysis, we chose a count rate cut-off criterion to exclude the high particle background and used event patterns (singles and doubles) and FLAG=0. We extracted events from the PN and MOS cameras using a circular region centered at the peak position of the ULX (, ; La Parola et al. 2001). We also extracted appropriate background events within nearby circular regions free of sources.
3. The power spectrum
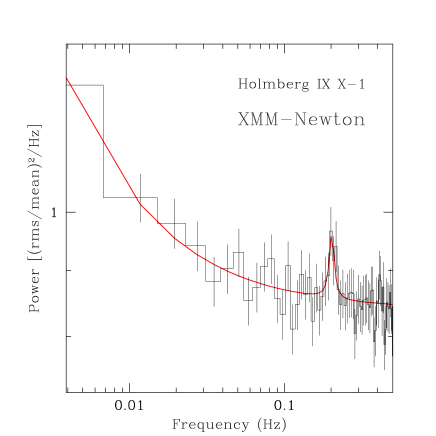
For temporal analysis, we combined the PN and MOS data to increase the signal-to-noise ratio. We calculated a power density spectrum (PDS) using the background corrected PN+MOS light curves sampled at . Figure 1 shows the PDS of Ho IX X-1 rebinned by a factor of yielding a frequency resolution of . The PDS continuum falls off approximately following a power law up to where the white noise arising from the Poisson errors starts to dominate the continuum. The white noise continuum above is not shown in Fig. 1. There is a prominent QPO with its peak frequency near .
To fit the PDS, we used a simple power law for the continuum, a Lorentzian to describe the QPO and a constant to account for the white noise. This model resulted in an acceptable fit, providing a minimum for degrees of freedom (dof). In Fig. 1, we show the best-fit model to the PDS as a thick line. The errors on the best-fit PDS model parameters, quoted below, are at a level. The best-fit model resulted in a QPO centroid frequency , a width and an amplitude . The best-fit power-law index and the amplitude are and at , respectively. The best-fit constant is . The total integrated power () and the QPO power expressed as are and , respectively. To estimate the statistical significance of the detection of the QPO, we also fitted the PDS with a simple power law and a constant. This model provided a minimum for dof. Thus the addition of the Lorentzian for the QPO was an improvement ( for three additional parameters) at a significance level of based on the maximum likelihood ratio test.

| Parameter | Model AaaModel A: 2Edge(MCD+cutoff PL+Gaussian); Model B: 2Edge(MCD+compTT+Gaussian). For the MOS data, the edges and the Gaussian line were excluded from the above models. | Model BaaModel A: 2Edge(MCD+cutoff PL+Gaussian); Model B: 2Edge(MCD+compTT+Gaussian). For the MOS data, the edges and the Gaussian line were excluded from the above models. | ||
|---|---|---|---|---|
| PN | MOS | PN | MOS | |
| bbIn units of . | ||||
| ccIn units of . | – | – | ||
| – | – | |||
| ccIn units of . | – | – | ||
| – | – | |||
| ccIn units of . | ||||
| ddThe MCD normalization , where is the inner radius and is the distance. is the power-law normalization in units of at . | ||||
| – | – | |||
| ccIn units of . | – | – | ||
| ddThe MCD normalization , where is the inner radius and is the distance. is the power-law normalization in units of at . | – | – | ||
| ccIn units of . | – | – | ||
| ccIn units of . | – | – | ||
| – | – | |||
| ccIn units of . | – | – | ||
| ccIn units of . | (f) | – | (f) | – |
| eeIn units of . | – | – | ||
| ccIn units of . | – | – | ||
| ffObserved flux and luminosity in units of and , respectively, and in the band of . | ||||
| ffObserved flux and luminosity in units of and , respectively, and in the band of . | ||||
| 983.3 | ||||
| dof | 988 | 1903 | 987 | 1902 |
4. The energy spectrum
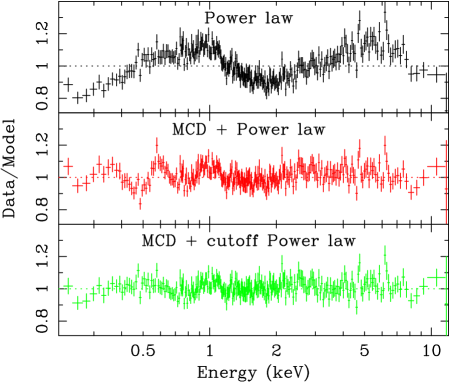
The PN and MOS spectra were grouped to a minimum of and counts per spectral channel, respectively, and analyzed with XSPEC 11.3. The errors on the best-fit spectral parameters are quoted at a confidence level. First we fitted a simple absorbed power law (PL) model to the PN and MOS spectra of Ho IX X-1. We fit the MOS1 and MOS2 data jointly with an overall normalization constant to account for possible differences in the source extraction areas or calibration uncertainties. We used the band in all the fits. The simple power law model resulted in minimum for dof and for dof for the PN and MOS data, respectively, thus providing statistically unacceptable fits to both the PN and MOS data. We have plotted the ratio of the PN data and the best-fit PL model in Figure 2 (top panel). This plot clearly show a broad hump in the band and a soft X-ray hump or excess emission below . The shape of the X-ray spectrum of Ho IX X-1 is very similar to that observed for NGC 1313 X-1 (Dewangan et al. 2006a). Similar ULX spectra have also been reported by Feng & Kaaret (2005) and Stobbart et al. (2006). These spectra are well described by a steep power law at low energies and a hot accretion disk emission at high energies (Stoobart et al. 2006; Feng & Kaaret 2005) or by a cool disk component and a cutoff power-law (Dewangan et al. 2006a). Addition of a hot multicolor disk blackbody (MCD) component improved the fit to the PN data significantly ( for 995 dof). Significant improvement is found for the MOS data also. Fig. 2 (middle panel) shows the ratio of the PN data and the best-fit MCD+PL model. The high energy curvature is well described by the hot MCD component but the soft excess component is not well modeled by the steep power-law component. Replacing the simple power-law with a cut-off power law improves the fit (PN: for 994 dof and MOS: for 1903 dof) and the MCD component results in cool disk (). Examination of the ratio of the PN data and the best-fit MCD+cutoff PL model, shown in Fig. 2 (bottom panel), reveals several weak features e.g., possible edges at and and an emission feature at . Addition of edges at and to the MCD+cutoff PL model improves the fits to the PN data by and , respectively, for two additional parameters. Addition of a narrow Gaussian line at improves the PN fit marginally ( for two additional parameters). The best-fit parameters are listed in Table 1. The MOS data do not show evidence for any discrete feature, addition of edges or lines does not improve the fit.
The high energy curvature or cut-off around can physically be described as arising from thermal Comptonization in an optically thick corona (Goad et al. 2006; Agrawal & Misra 2006; Stobbart et al. 2006). To test such a scenario for Ho IX X-1, we used the XSPEC model compTT (Titarchuk 1994) that describes thermal Comptonization of soft photons in a hot plasma. The parameters of this model are the soft photon temperature (), electron plasma temperature (), plasma optical depth () and the normalization. We also used the MCD model to describe the soft excess component. The MCD+compTT model provided minimum values similar to that obtained for the MCD+cutoff PL model. Additions of two absorption edges at and and a narrow Gaussian line at improved the fit to the PN data by , and , respectively. The best-fit parameters are listed in Table 1. The curvature or cut-off is well modeled by thermal Comptonization in an optically thick ( and relatively cool () electron plasma. Using the above model, we derive an unabsorbed flux of for Ho IX X-1 in the band. This translates into a bolometric luminosity of using a distance of 3.4 Mpc (Georgiev et al. 1991; Hill et al. 1993).
5. Discussion
Based on a long XMM-Newton observation, we have discovered a QPO with centroid frequency in the power spectrum of Ho IX X-1. The QPO has an amplitude (rms) of and a coherence . The underlying PDS is well described by a power law with an index of . This is only the second detection of a QPO from any ULX. M82 X-1 was the first ULX to show clear evidence for a QPO (Strohmayer & Mushotzky 2003). M82 X-1 shows a variable QPO with the centroid frequency in the range of (Muccarelli et al. 2006). The QPO from Ho IX X-1 appears to be similar to the QPO (rms amplitude ; ; Strohmayer & Mushotzky 2003), seen in the first XMM-Newton observation of M82 X-1, in terms of the amplitude and coherence. The PDS continua of Ho IX X-1 and M 82 X-1 (in the first XMM-Newton observation) are also simple power laws without a clear evidence for a break.
BH XRBs show flat-topped, band-limited noise in their low state (LS). The flat-topped noise weakens in the intermediate/very high states (IS/VHS) and is absent in the high state (HS). Strong low frequency QPOs are observed in the IS/VHS and occasionally in the LS but are usually not present in the HS (see e.g., McClintock & Remillard 2003). The IS/VHS are also known as the soft or hard intermediate states (SIMS or HIMS), depending on whether the spectrum is soft or hard, in the classification scheme of Belloni (2005). In the HIMS, BH XRBs show strong QPO with high Q-factor () and large amplitude ( rms). These are called type C QPOs (Casella et al. 2005). The QPO in Ho IX X-1 (as well as in M82 X-1) have properties similar to the type C QPOs and suggest that the variability properties of these ULXs are likely to be similar to that of BH XRBs in their HIMS.
X-ray spectrum of Ho IX X-1 is curved at high energy () and shows a soft X-ray excess emission at low energies . The PN spectrum is well described by an MCD () and a cut-off power law (; ) or a compTT component (; and ). While this form of unusual X-ray spectrum is common among bright ULXs (Stobbart et al. 2006), there is no corresponding spectral states of BH XRBs. Both the presence of the QPO and the high energy curvature in the X-ray emission from Ho IX X-1 are inconsistent with the ULX being in the high/soft state and the soft X-ray excess emission cannot be interpreted as the optically thick emission from a disk extending down to the last stable orbit. Thus the temperature of the soft excess component cannot be used to estimate the BH mass for Ho IX X-1.
In BH XRBs, QPOs are observed when both the disk and power-law components contribute significantly to the total X-ray emission (e.g., Sobczak et al. 2000). When strong QPOs are seen in the LS, IS and VHS, the temperature of the disk component is cooler than that in the HS. In these cases, the inner disk is thought to be truncated (Done & Kubota 2005). The presence of the strong QPO in the power spectrum of Ho IX X-1, then, implies that its accretion disk must be truncated at some inner radius, larger than the radius of the innermost stable orbit. Done & Kubota (2005) have investigated accretion disk structure of BH XRBs in their VHS characterized by strongly Comptonized spectra and cooler disk temperatures compared to that in the HS. They have proposed a model in which the corona and the disk are parts of the same accretion flow. At high accretion rates, the inner corona is energetically-coupled to an outer disk that is truncated at some inner radius, thus resulting in a cooler disk and optically thick inner corona. ULXs with cool soft X-ray emission and high energy curvature such as Ho IX X-1 may be the extreme cases of VHS of BH XRBs. In Ho IX X-1, the disk truncation radius is likely to be larger and the inner corona is optically thicker compared to that in the VHS of BH XRBs. Thus Ho IX X-1 may be accreting at a rate (relative to the Eddington rate) larger than that in the VHS of BH XRBs. Interestingly, some BH XRBs e.g., GRS 1915+105 show spectral curvature around in their HIMS (Vadawale et al. 2001; Kubota & Done 2004). Due to the presence of a strong QPO and spectral curvature at in ULXs, Ho IX X-1 and M 82 X-1, similar to the type-C QPO and high energy curvature at in the HIMS of some BH XRBs, it is quite conceivable that ULXs have their spectral curvature at lower energies in their HIMS.
If the association of the observed QPO in ULXs to type-C QPO of BH XRBs is correct, it gives a useful handle to constrain the mass of the BH in Ho IX X-1. In the HIMS states, the accretion rate is typically of the Eddington luminsoity. Considering the fact that QPOs are associated with accretion discs (and hence ruling out the possibility of beamed jet emission for the observed X-ray emission), this puts a strong upper limit of 400 M⊙ for the mass of the BH in Ho IX X-1. Further, the spectral curvatures in GRS 1915+105 are preferentially seen just before radio flares and the QPO frequencies during such states are in the range of (Vadawale et al. 2003). If we equate this frequecy range to the observed QPO in Ho IX X-1, we get an estimate for the BH mass in Ho IX X-1 as .
Associating the observed QPO in Ho IX X-1 to type C QPO in BH XRBs has another interesting consequence. It is observed that transition from HIMS to soft state (or SIMS) gives rise to fast relativistic jet in galactic sources. Similarly, such ultra-luminous jets should be seen in ULXs, when they make a transition from HIMS to SIMS. Detecting such relativistic jets in ULXs will put the association with the BH XRBs on a firm footing.
References
- Agrawal & Misra (2006) Agrawal, V. K., & Misra, R. 2006, ApJ, 638, 83
- Belloni (2005) Belloni, T. 2005, ArXiv Astrophysics e-prints, arXiv:astro-ph/0507556
- Casella et al. (2005) Casella, P., Belloni, T., & Stella, L. 2005, ApJ, 629, 403
- Colbert & Mushotzky (1999) Colbert, E. J. M. & Mushotzky, R. F. 1999, ApJ, 519, 89 (CM99)
- Dewangan et al. (2006a) Dewangan, G. C., Griffiths, R. E., & Rao, A. R. 2006a, submitted to ApJ, ArXiv Astrophysics e-prints, arXiv:astro-ph/0511112
- Dewangan et al. (2006b) Dewangan, G. C., Titarchuk, L., & Griffiths, R. E. 2006b, ApJ, 637, L21
- Done & Kubota (2005) Done, C., & Kubota, A. 2005, ArXiv Astrophysics e-prints, arXiv:astro-ph/0511030
- Feng & Kaaret (2005) Feng, H., & Kaaret, P. 2005, ApJ, 633, 1052
- Fiorito & Titarchuk (2004) Fiorito, R., & Titarchuk, L. 2004, ApJ, 614, L113
- Georgiev et al. (1991) Georgiev, T. B., Bilkina, B. I., Tikhonov, N. A., & Karachentsev, I. D. 1991, A&AS, 89, 529
- Goad et al. (2006) Goad, M. R., Roberts, T. P., Reeves, J. N., & Uttley, P. 2006, MNRAS, 365, 191
- Hill et al. (1993) Hill, J. K., et al. 1993, ApJ, 402, L45
- King et al. (2001) King, A. R., Davies, M. B., Ward, M. J., Fabbiano, G., & Elvis, M. 2001, ApJ, 552, L109
- Kubota & Done (2004) Kubota, A., & Done, C. 2004, MNRAS, 353, 980
- La Parola et al. (2001) La Parola, V., Peres, G., Fabbiano, G., Kim, D. W., & Bocchino, F. 2001, ApJ, 556, 47
- McClintock & Remillard (2003) McClintock, J. E., & Remillard, R. A. 2003, ArXiv Astrophysics e-prints, arXiv:astro-ph/0306213
- Miller et al. (2004) Miller, J. M., Fabian, A. C., & Miller, M. C. 2004, ApJ, 607, 931
- Mirabel & Rodríguez (1999) Mirabel, I. F., & Rodríguez, L. F. 1999, ARA&A, 37, 409
- Mucciarelli et al. (2006) Mucciarelli, P., Casella, P., Belloni, T., Zampieri, L., & Ranalli, P. 2006, MNRAS, 365, 1123
- Roberts et al. (2005) Roberts, T. P., Warwick, R. S., Ward, M. J., Goad, M. R., & Jenkins, L. P. 2005, MNRAS, 357, 1363
- Soria et al. (2004) Soria, R., Motch, C., Read, A. M., & Stevens, I. R. 2004, A&A, 423, 955
- Stobbart et al. (2004) Stobbart, A.-M., Roberts, T. P., & Warwick, R. S. 2004, MNRAS, 351, 1063
- Stobbart et al. (2006) Stobbart, A., Roberts, T. P., & Wilms, J. 2006, ArXiv Astrophysics e-prints, arXiv:astro-ph/0601651
- Strohmayer & Mushotzky (2003) Strohmayer, T. E., & Mushotzky, R. F. 2003, ApJ, 586, L61 (SM03)
- Titarchuk (1994) Titarchuk, L. 1994, ApJ, 434, 570
- Titarchuk & Fiorito (2004) Titarchuk, L., & Fiorito, R. 2004, ApJ, 612, 988 (TF04)
- Vadawale et al. (2001) Vadawale, S. V., Rao, A. R., & Chakrabarti, S. K. 2001, A&A, 372, 793
- Vadawale et al. (2003) Vadawale, S. V., Rao, A. R., Naik, S., Yadav, J. S., Ishwara-Chandra, C. H., Pramesh Rao, A., Pooley, G. G. 2003, ApJ, 597, 1023
- Winter et al. (2005) Winter, L. M., Mushotzky, R. F., & Reynolds, C. S. 2005, ArXiv Astrophysics e-prints, arXiv:astro-ph/0512480
- Sobczak et al. (2000) Sobczak, G. J., et al., 2000a, ApJ, 531, 537