A test of the power law relationship between gamma-ray burst pulse width ratio and energy expected in fireballs or uniform jets111Send offprint requests to: Y.-P. Qin (E-mail: ypqin@ynao.ac.cn)
Abstract
A power law relationship between the pulse width and energy of gamma-ray bursts (GRBs) was found by many authors. Recently, under the assumption that the Doppler effect of the relativistically expanding fireball surface (or in some papers, the curvature effect) is important, Qin et al. showed that in most cases the mentioned power law relationship would exist in a certain energy range and within a similar range a power law relationship of an opposite trend between the ratio of the rising width to the decaying width and energy would be expectable for the same burst. We check this prediction with two GRB samples which contain well identified pulses. A power law anti-correlation between the full pulse width and energy and a power law correlation between the pulse width ratio and energy are seen in the light curves of the majority (around 65%) of bursts of the two samples within the energy range of BATSE, suggesting that these bursts are likely to arise from the emission associated with the shocks occurred on a relativistically expanding fireball surface. For the rest of the bursts, the relationships between these quantities were not predicted previously. We propose to consider other spectral evolutionary patterns or other radiation mechanisms such as a varying synchrotron or Comptonized spectrum to check if the observed relationships for these rest bursts can also be accounted for by the Doppler model. In addition, we find that the upper limits of the width ratio for the two samples do not exceed 0.9, in agrement with what predicted previously by the Doppler model. The plateau/power law/plateau and the peaked features predicted and detected previously by Qin et al. are generally observed, with the exceptions being noticed only in a few cases. According to the distinct values of two power law indices and , we divide the bursts into three subsets which are located in different areas of the plane. We suspect that different locations of (, ) might correspond to different mechanisms.
keywords:
gamma-rays: bursts — gamma-rays: theory — relativity1 Introduction
Information of the dependence of the temporal profiles of gamma-ray bursts (GRBs) on energy is important since it might reflect the process of emission and suggest the form of radiation. However, the variance of the GRB temporal profiles is very enormous, and one cannot find two bursts having exactly the same temporal and spectral developments (Nemiroff et al. 1993). Some well-separated pulses which appear to have a fast rise and an exponential decay (FRED) phases (see Fishman et al. 1994) are generally believed to represent the fundamental constituent of GRB light curves. Many investigations on modeling pulse profiles have previously been made, and several flexible functions describing the profiles of individual pulses based on empirical relations were proposed (see e.g., Norris et al. 1996; Lee et al. 2000a, 2000b; Ryde et al. 2000, 2002). When fitted with these functions many statistical properties of GRB pulses have been revealed.
In early statistical analysis, light curves of GRB pulses were found to become narrower at higher energies (Fishman et al. 1992; Link, Epstein, & Priedhorsky 1993). Fenimore et al. (1995) used the average autocorrelation function to study the average pulse width, and showed that the average pulse width of many bursts is well fitted by a power law of energy and the power law index is about . Norris et al. (1996) also found that the average pulse shape dependence on energy is approximately a power law, consistent with the analysis of Fenimore et al. (1995). This was confirmed by later studies (Norris et al. 1996, 2000; Costa 1998; Piro et al. 1998; Nemiroff 2000; Feroci et al. 2001; Crew et al. 2003).
Many authors have attempted to interpret the light curves of GRBs in the past few years (see, e.g., Fenimore et al. 1996; Norris et al. 1996; Norris et al. 2000; Ryde & Petrosian 2002; Kocevski et al. 2003). It was suggested that the power law relationship could be attributed to synchrotron radiation (see Fenimore et al. 1995; Cohen et al. 1997; Piran 1999). Kazanas, Titarchuk, & Hua (1998) proposed that the relationship could be accounted for by synchrotron cooling (see also Chiang 1998; Dermer 1998; and Wang et al. 2000). It was suspected that the power law relationship might result from a relative projected speed or a relative beaming angle (Nemiroff 2000). Phenomena such as the hardness-intensity correlation and the FRED form of pulses were recently interpreted as signatures of the relativistic curvature effect (Fenimore et al. 1996; Ryde & Petrosian 2002; Kocevski et al. 2003; Qin et al. 2004; Qin & Lu 2005; Qin et al. 2005, hereafter Paper I). It is likely that the observed difference between different channel light curves might mainly be due to the energy channels themselves, owing to the feature of self-similarity across energy bands observed (see, e.g., Norris et al. 1996). In other words, light curves of different energy channels might arise from the same mechanism (e.g., parameters of the rest frame spectrum and parameters of the expanding fireballs are the same for different energy ranges), differing only in the energy ranges involved. This is what the Doppler model (or in some papers, the curvature effect) predicts (see Qin et al. 2004). The Doppler model is the model describing the kinetic effect of the expanding fireball surface on the radiation observed, where the variance of the Doppler factor and the time delay due to different emission areas on the fireball surface (or the spherical surface of uniform jets) are the key factors to be concerned (for a detailed description, see Qin 2002 and Qin et al. 2004).
The observed gamma-ray pulses are believed to be produced in a relativistically expanding and collimated fireball because of the large energies and the short timescales involved. As shown in Kocevski et al. (2003), when taking into account the curvature effect, a FRED pulse can be expected. With their equations, individual pulse shapes of a GRB sample were well characterized.
The formula of the Doppler model derived in details in Qin (2002) is applicable to cases of relativistic, sub-relativistic, and non-relativistic motions as no terms are omitted in the corresponding derivation. With this formula, Qin (2003) studied how emission and absorption lines are affect by the effect. Qin et al. (2004) rewrote this formula in terms of the integral of the local emission time, which is in some extent similar to that presented in Ryde & Petrosian (2002), where relation between the observed light curve and the local emission intensity is clearly illustrated. Based on this model, many characteristics of profiles of observed gamma-ray burst pulses could be explained. Profiles of FRED pulse light curves are mainly caused by the fireball radiating surface, where emissions are affected by different Doppler factors and boostings due to different angles to the line of sight, and they depend also on the width and structure of local pulses as well as rest frame radiation mechanisms. This allows us to explore how other factors such as the width of local pulses affect the profile of the light curve observed. Recently, Qin et al. (Paper I) studied in details how the pulse width of gamma-ray bursts is related with energy under the assumption that the sources concerned are in the stage of fireballs. As revealed in Paper I, owing to the Doppler effect of fireballs, it is common that there exists a power law relationship between the full width at half-maximum () and energy and between and energy within a limited range of frequency, where and are the widths in the rising and decaying phases of the light curve, respectively. They showed that, while emission of pulses over a relativistically expanding fireball surface would lead to A power law anti-correlation between the full pulse width and energy, it would lead to a power law correlation between the ratio of the rising width to the decaying width and energy. The power law range and the corresponding index not only depend on the rest frame radiation form but also on the observed peak energy (the range could span over more than one to five orders of magnitudes of energy for different rest frame spectra). The upper and lower limits of the power law range can be determined by the observed peak energy . In cases when the development of the rest frame spectrum could be ignored, a plateau/power law/plateau feature would be formed, while in cases when the rest frame spectrum is obviously softening with time, a peaked feature would be expected. In addition, they found that local pulse forms affect only the magnitude of the width and the ratio of widthes.
Although A power law anti-correlation between the pulse width and energy was observed by many authors, it is unclear if a power law correlation between the width ratio and energy could be detected in the same source. First of all, we would like to check if the expected power law relationships between and energy and and energy indeed hold for GRBs. When they hold, how the two power-law indices are related? The primary goal of this paper is to employ GRB samples to check in details these expected relationships and to explore the possible relationship between the two indices. In section 2, we present our sample description and pulse fitting. The result are given in section 3. Discussion and conclusions are presented in the last section.
2 Sample description and light curve fitting
The first GRB sample we select comes from Kocevski et al. (2003), where the bursts are found to contain individual FRED pulses. The data are provided by the BATSE instruments on board the CGRO spacecraft. The bursts of the sample they selected are from the entire BATSE catalog with the criteria that the peak flux is greater than 1.0 photons on a 256 ms timescale. They limited the bursts to events with durations longer than 2 s. The sample consists of 67 bursts. (For more details of the sample selection, see Kocevski et al. 2003.) The second sample is presented in Norris et al. (1999) which contains 66 single pulse GRBs. They performed a several-step program, starting with the largest available sample of bursts and decimating the sample according to criteria designed to preserve recognizable wide, single-pulse GRBs. (For further information about the sample, one can refer to Norris et al. 1999.)
Only those bursts with the background-subtracted parameters available are included in our analysis. In addition, we generally consider the first well identified pulse for each burst since this pulse is more closely associated with the initial condition of the event and might be less affected by environment. For each burst we require that the signal should be detectable at least in three channels (in this way, the relation between the pulse width and energy could be studied). With these requirements, we get 62 GRBs (the KRL sample) from the 67 bursts of the first sample (Kocevski et al. 2003) and 41 sources (the Norris sample) from the 66 bursts of the second sample (Norris et al. 1999), respectively. The two selected samples share the following 19 bursts: 563, 914, 1406, 1467, 1883, 2193, 2387, 2484, 2665, 2880, 3003, 3155, 3257, 3870, 3875, 3892, 3954, 5517, and 6504.
The background of light curves is fitted by a polynomial expression using 1.024 s resolution data that are available from 10 minutes before the trigger to several minutes after the burst. The data along with the background fit coefficients can be obtained from the CGRO Science Support Center (CGROSSC) at NASA Goddard Space Flight Center through its public archives. We adopt the function presented in equation (22) of Kocevski et al. (2003) (the KRL function) to fit all of the background-subtracted light curves since we find that this function could well describe the observed profile of a FRED pulse. In addition, a fifth parameter , which measures the offset between the start of the pulse and the trigger time, is introduced. The adopted KRL function is
| (1) |
where is the time of the pulse’s maximum flux, ; r and d are the power-law rise and decay indexes, respectively. Note that equation (1) holds for , when we take .
To obtain an intuitive view on the result of the fit, we develop and apply an interactive IDL routine for fitting pulses in bursts, which allows the user to set and adjust the initial pulse parameter manually before allowing the fitting routine to converge on the best-fit model via the reduced minimization. With the two samples, the fits to the four channel light curves are performed in sequence for each burst. The fits are examined many times to ensure that they are indeed the best ones (the reduced is the minimum).
We find in our analysis that there are a few with very large values of the reduced and a few with very small values. Shown in Figs. 1 and 2 are typical bursts with very large or very small values of the reduced drawn from the two samples, respectively.
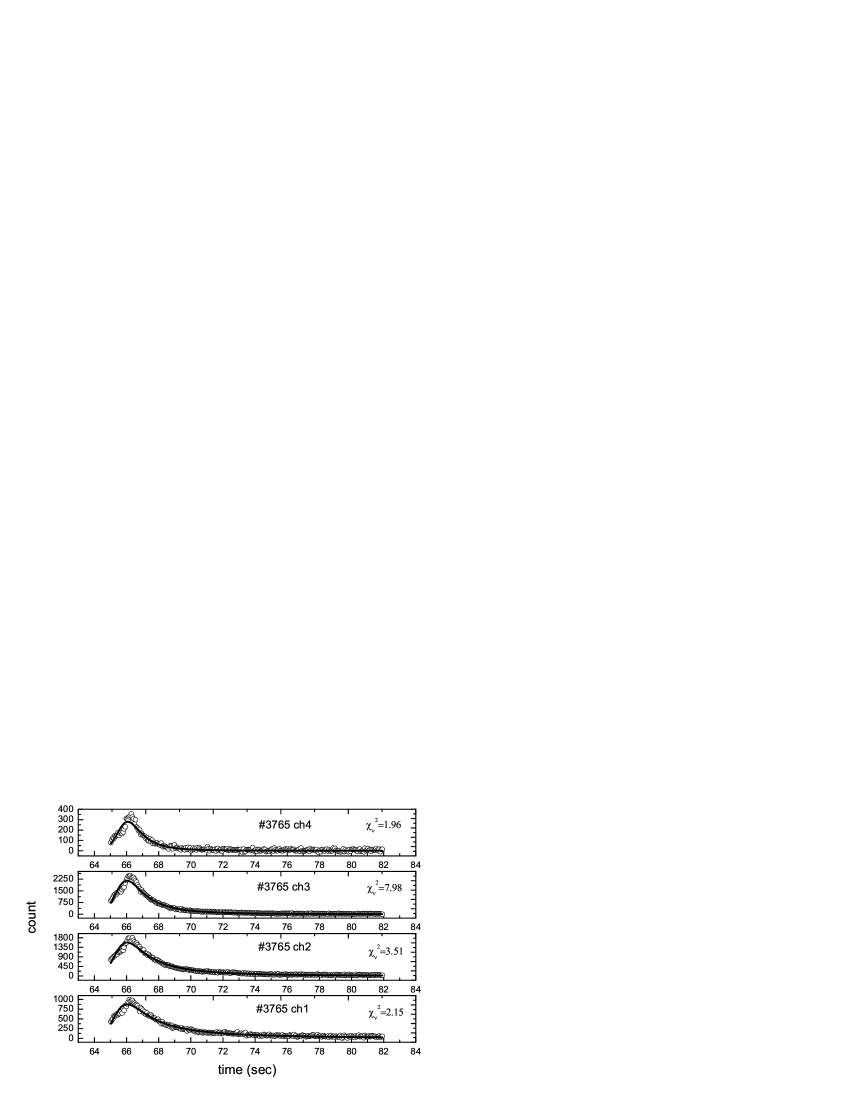
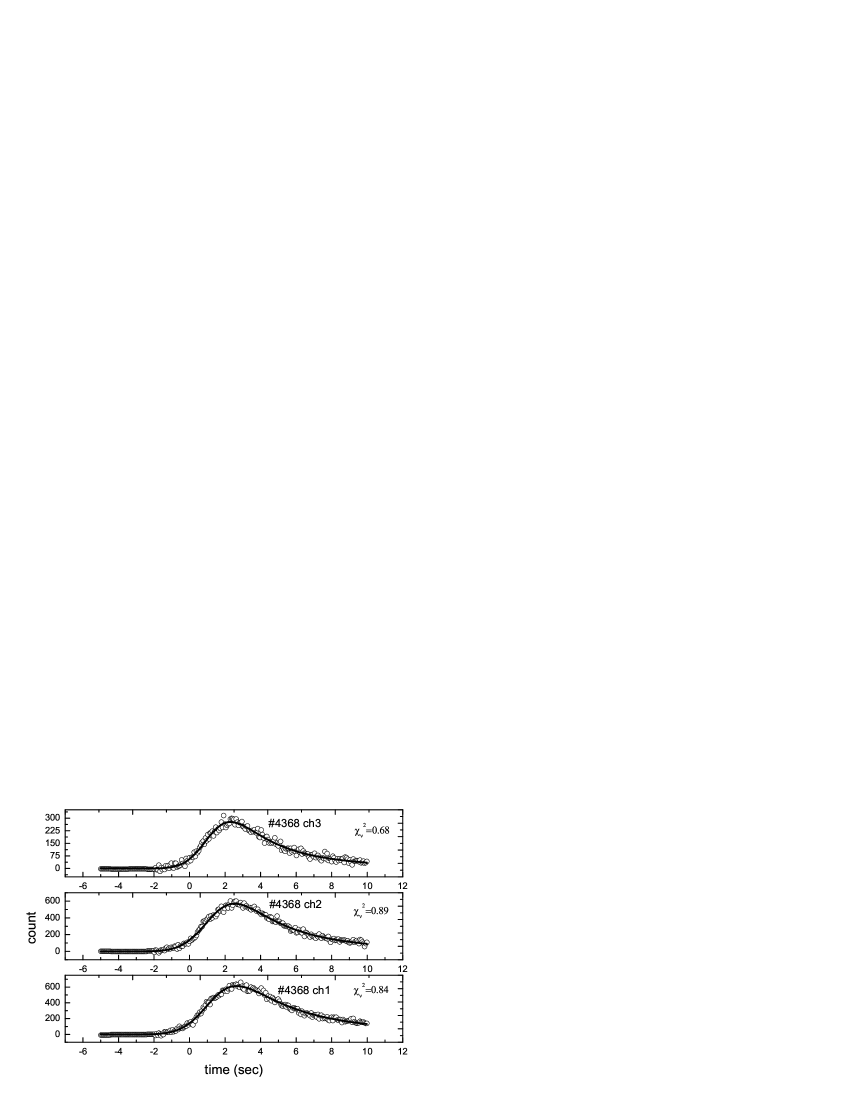
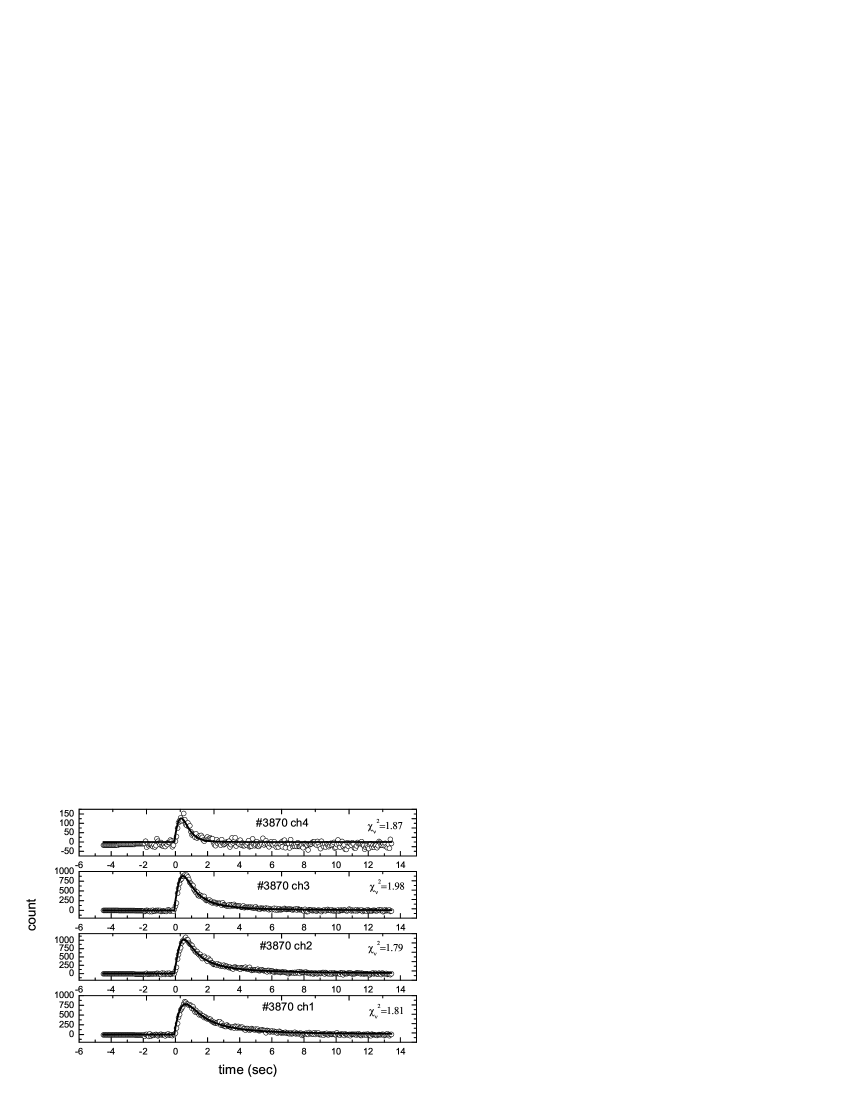
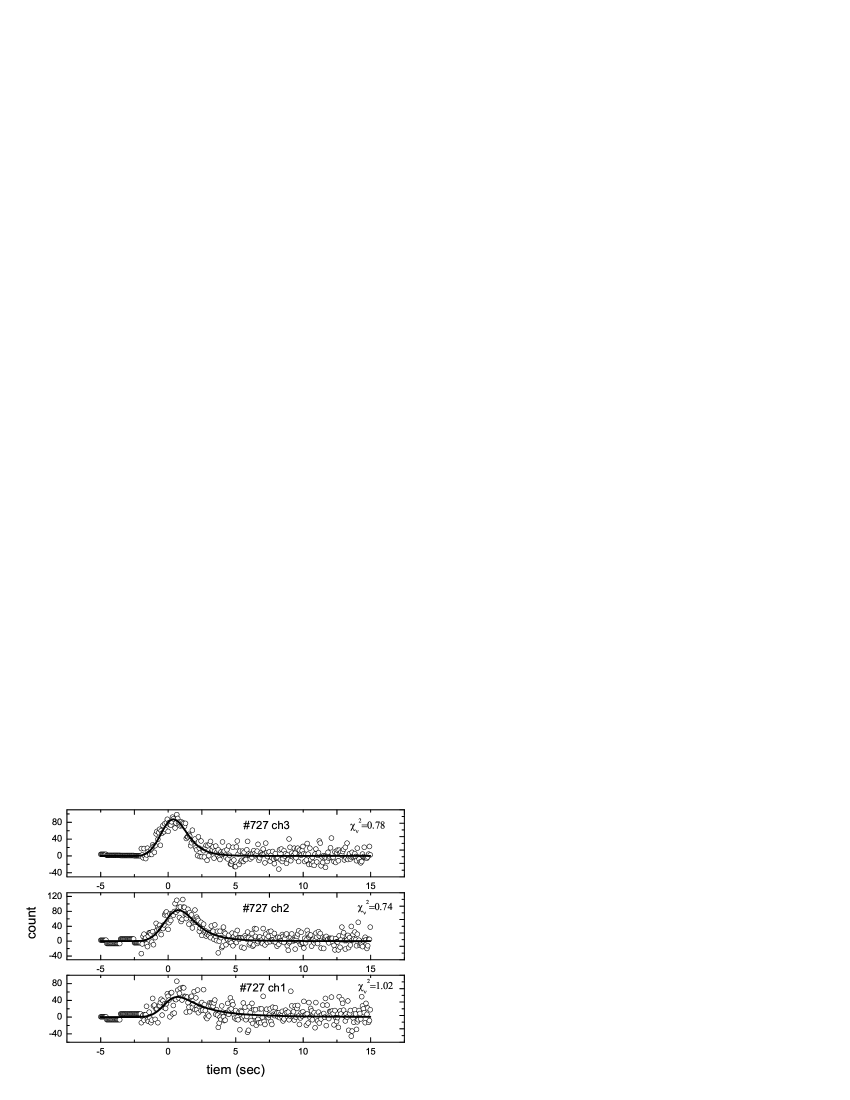
One finds from the two figures that, the result of the fit is quite satisfied. The distributions of the reduced for the two samples are displayed in Fig. 3. The reduced distributions of the KRL and Norris samples peak closely at 1.05 and 1.00, respectively, with a width of approximately 0.200 and 0.200, respectively. The medians for the the KRL and Norris samples are 1.065 and 1.019, respectively. The distribution of the reduced , , is so narrow that we are satisfied by the fits.

3 Result
3.1 Relationships between the pulse width ratio and energy shown in the two samples
In the last section we adopt the KRL function described by equation (1) to fit the light curves of the two samples. The full pulse width () together with the rising width () and the decaying width () in each energy channel for the bursts are estimated with equation (1) along with the five fitting parameters of the function. The uncertainties of these widthes are calculated with the errors of the fitting parameters through the error transfer formula.
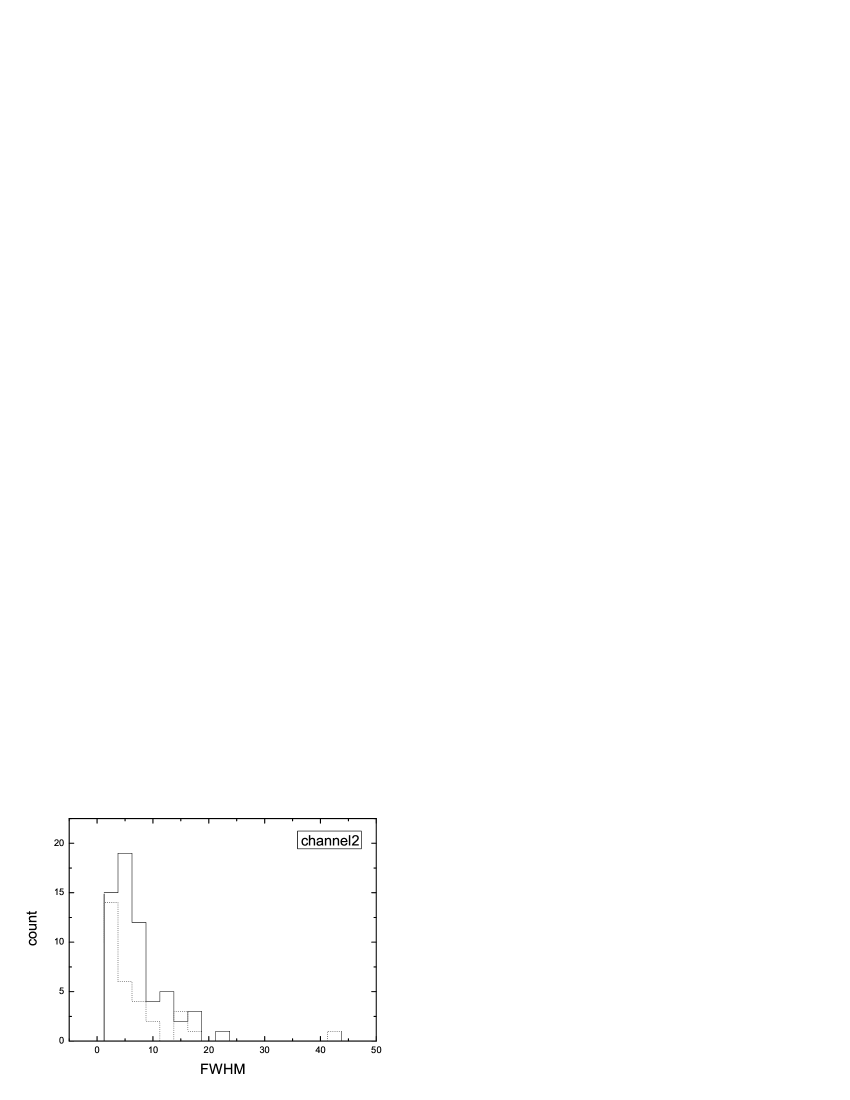
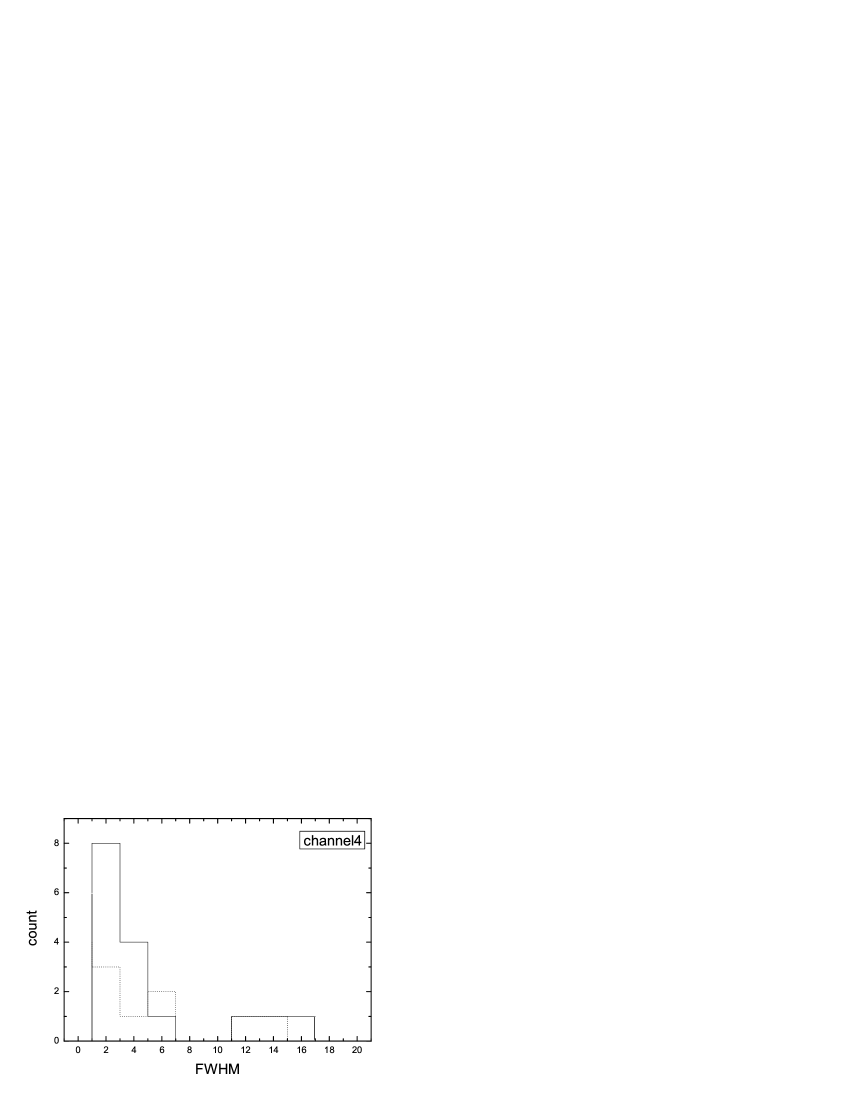
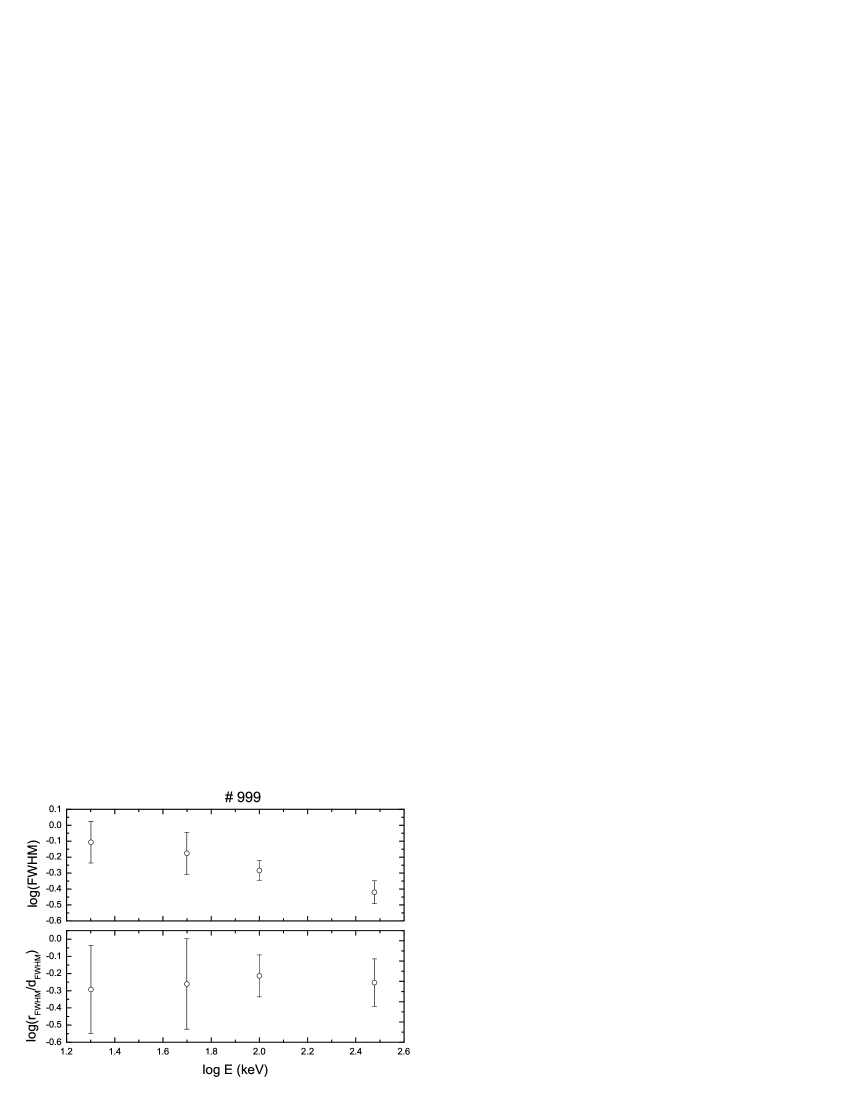
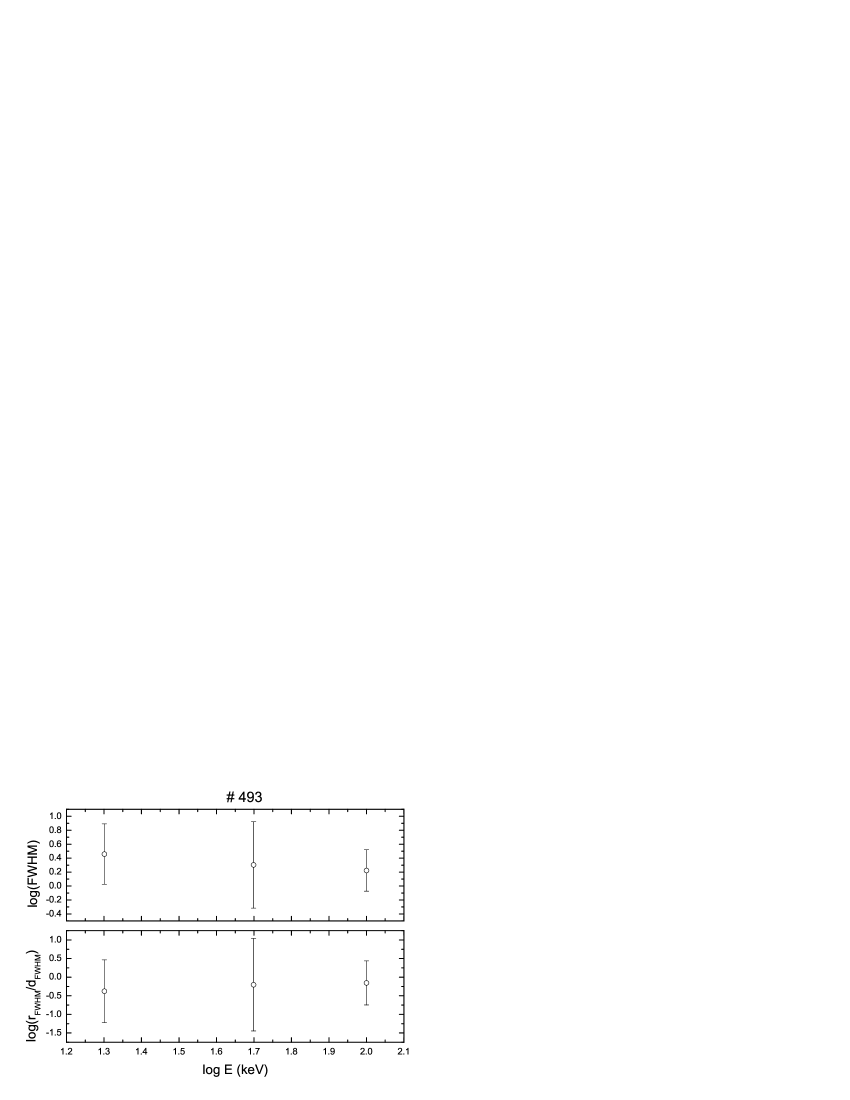
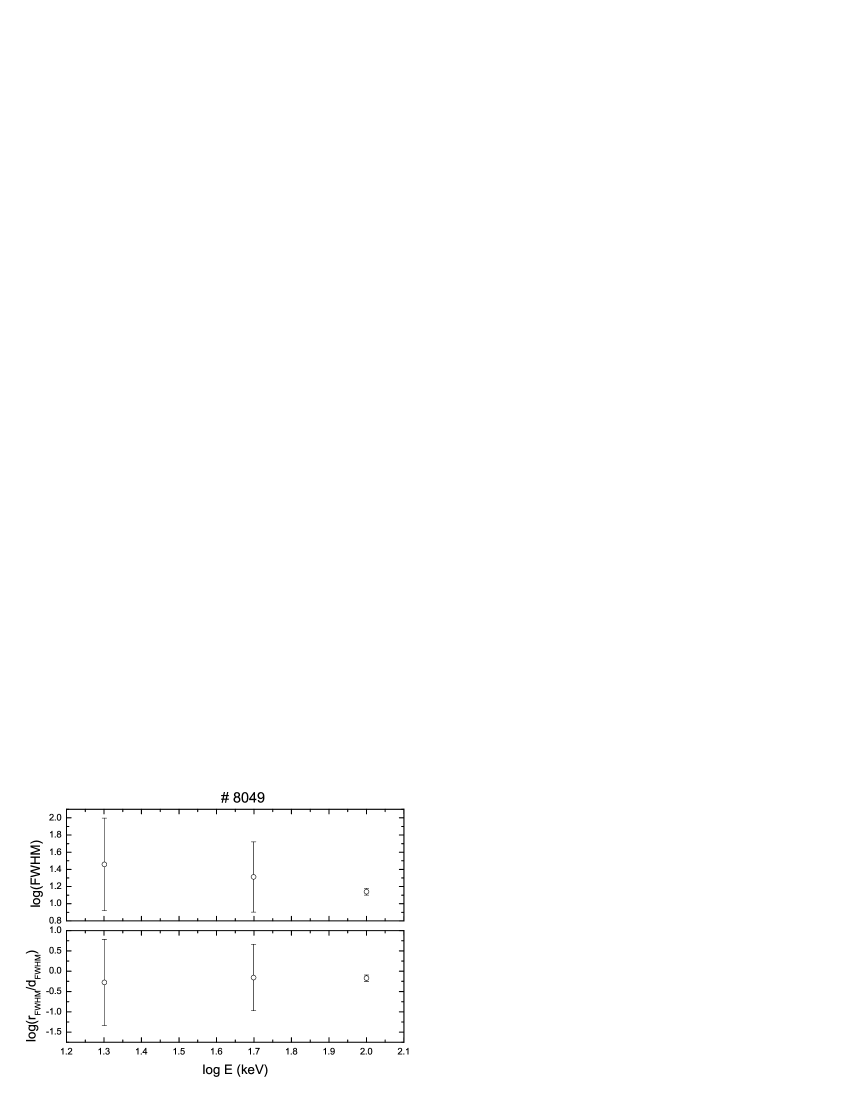
Displayed in Fig. 4 are the distributions of and (the ratio of the rising width to the decaying width) for the two samples. We also obtain the relationships between and energy and that between and energy for the two samples. Examples of the relationships are presented in Fig. 5. There are 3 sub-figures (for three bursts) included in Fig. 5, where each sub-figure is composed of two panels, with the upper panel showing the plot of and the lower one displaying the plot of for the same source, where is the lower energy bound of the four corresponding channels as generally adopted in previous works (see, e.g., Fenimore et al. 1995).
We find from the distributions of and for the two samples that: (a) the corresponding values of the medians are approximately the same for the two samples; (b) while the median of declines with energy (when fitting them with a power law, the index would be negative), increases with energy (when fitting them with a power law, the index would be positive); (c) the ratio of the rising width to the decaying width is around 0.5. Combining result (a) and those shown in Figs. 1, 2, and 3, one can conclude that the KRL and Norris samples share approximately the same statistical properties. Assuming a power law relationship, we get from the median of and energy an index of -0.267 and obtain from the median of and energy an index of 0.0386 for the KRL sample. The fact that the sign of the former index is negative and that of the latter is positive is in well agreement with what predicted previously by Qin et al. in Paper I. The fact that the median of is around 0.5 suggests that the pulses observed are asymmetric, where the decaying width is generally larger than the rising width by a factor of two.
From the estimated values of the and of the four BATSE channels available and the indices derived from and energy and from and energy for our selected samples one finds that, for the KRL sample, the largest values of in the four channels are 0.813, 0.699, 0.724, and 0.712 respectively, while the corresponding values for the Norris sample are 0.723, 0.789, 0.860, and 0.718 respectively. This is in agrement with what predicted previously in Qin et al. (2004), where they suggested that there is an upper limit of which is approximately 1.3.
Examining the relationship between and energy and that between and energy for the two samples we find that there are three kinds of burst identified by the relationship between and energy and that between and energy for the two samples. They can be divided by the index of the power law relationship between and energy, , and the index of the power law relationship between and energy, .
The first class consists of bursts that are seen or suspected to possess A power law anti-correlation between and energy () and a power law correlation between and energy (). The number is 55 which is around 65% of the total bursts of the two samples.
The second class includes such bursts that are seen or suspected to possess negative index power law relationships between and energy () and between and energy (). The number is 24 which is around 29% of the total bursts of the two samples.
The third class contains the bursts that are seen or suspected to possess a power law correlation between and energy (). The number is 5 which is around 6% of the total bursts of the two samples.
Bursts of class 1 are obviously those predicted in Paper I, in which the prediction was performed under the assumption that the so-called curvature effect (the Doppler and time delay effect over the relativistically expanding fireball surface) is important. The fact that the number of bursts of this class is around 65% of the total bursts of the two samples indicates that light curves of the majority of bursts of these samples are likely to suffer from the curvature effect. This conclusion is in agreement with what suggested in Qin & Lu (2005) and Paper I. Sources of the second class are not predicted in Paper I. Recalled that what discussed in Paper I involves only simple cases. For example, when they considered the situation of the rest frame radiation varying with time, they discussed only a varying Band function and involved only a pattern of a linear softening. It is unclear if a varying synchrotron or Comptonized radiation is concerned or a different pattern of the spectral evolution is considered, both negative index power law relationships for a burst could be expected (this might deserves a further investigation). For the same reason, the mechanism accounting for the third class is also unclear.
3.2 Relationship between power law indices
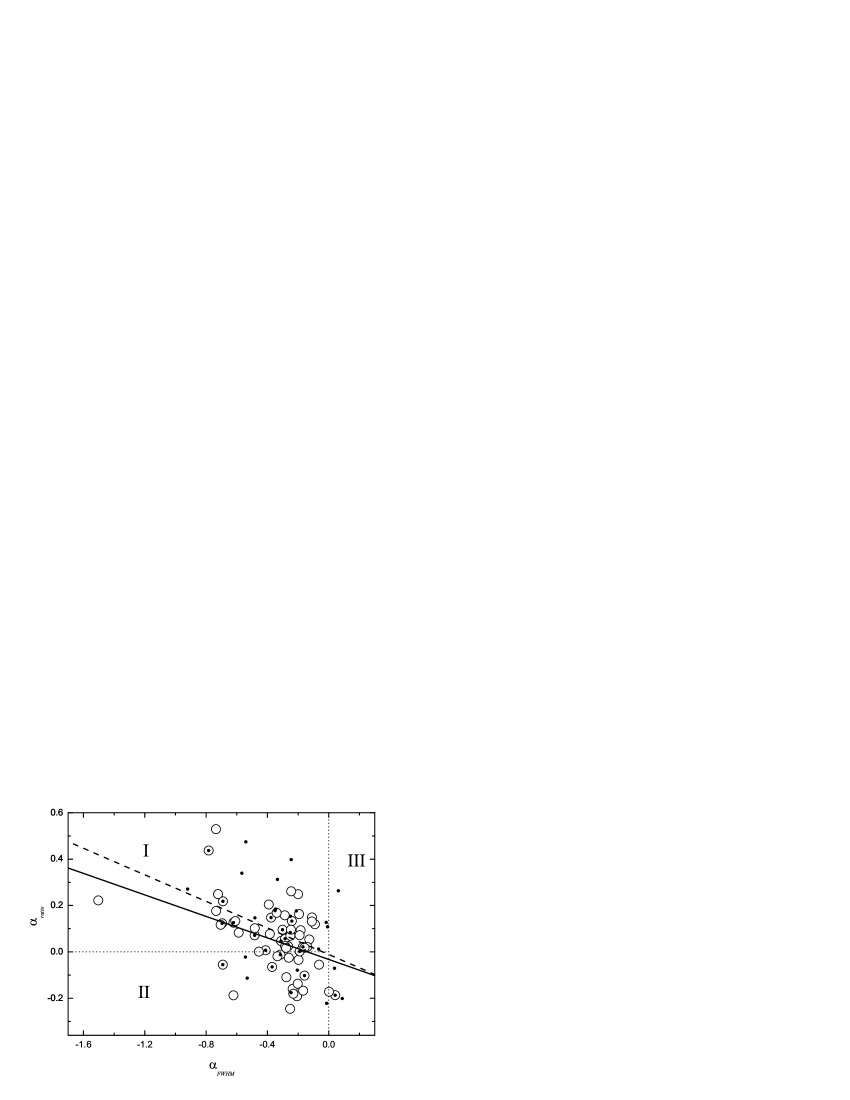
As predicted in Paper I and suggested in the bursts of class 1, the power law phase in the relationship between and energy shows an opposite tendency to that between and energy. We are curious about how the two power law indices and being related. Presented in Fig. 6 is the plot of vs. for the KRL and Norris samples. An anti-correlation between the two quantities is observed in both samples. For the KRL sample, a regression analysis yields , with the correlation coefficient being (), while for the Norris sample, the analysis produces , with the correlation coefficient being (). Plotted in Fig. 6 are also three distribution regions for the two indices, which are associated with the three classes defined above. Since for a certain energy range the sign of the indices depends obviously on the radiation mechanism (see Figs. 1, 2 and 3 in Paper I), these different regions might correspond to different mechanisms (this deserves a detailed analysis).
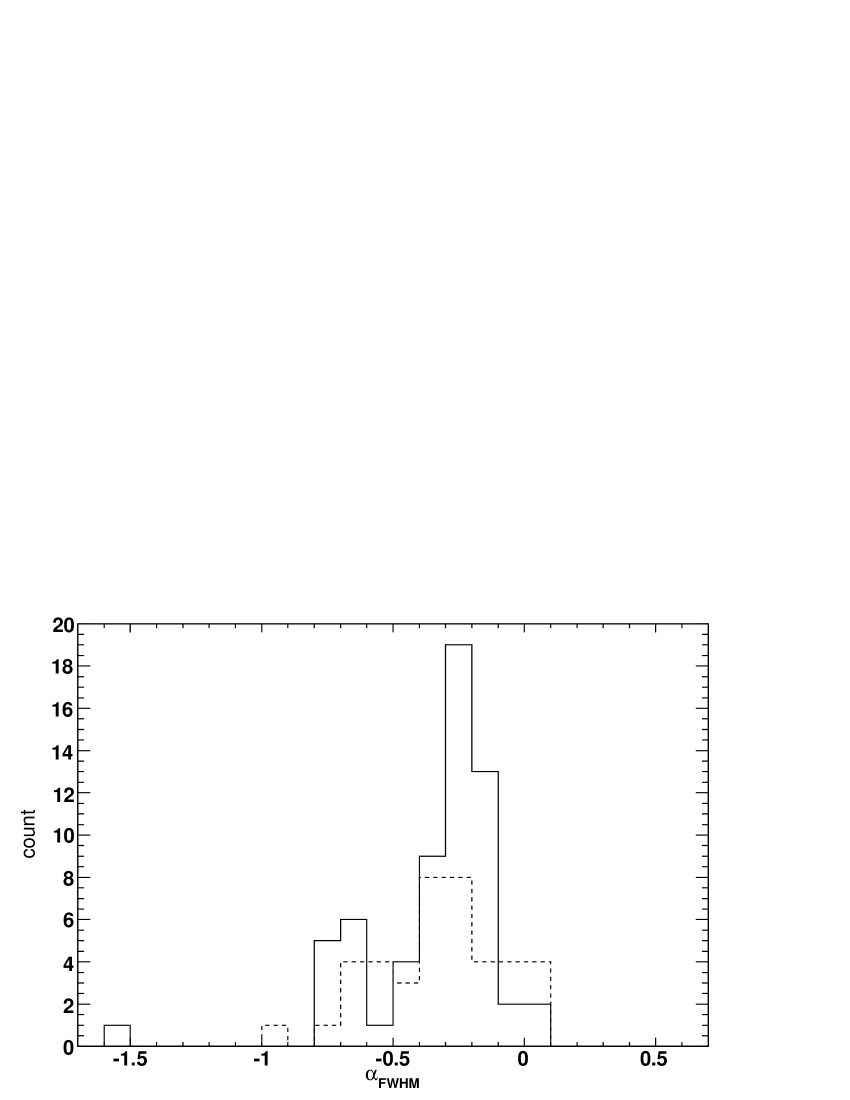
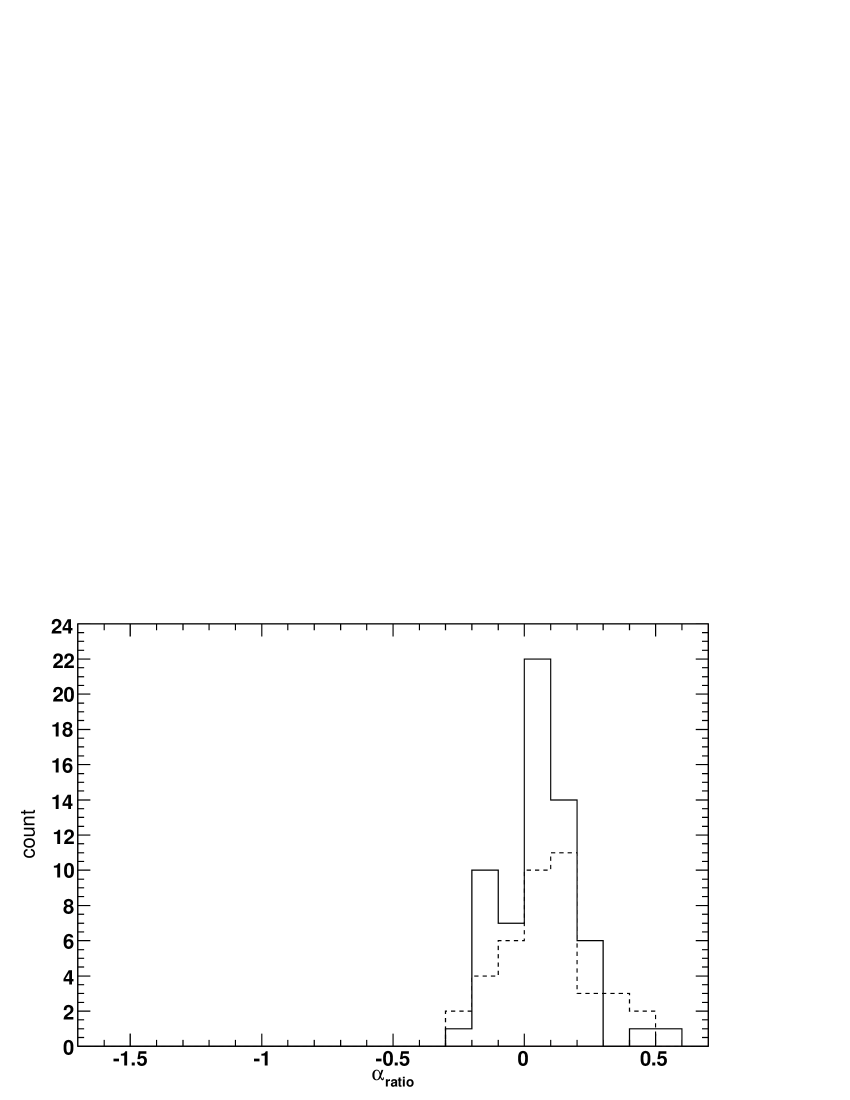
Distributions of and are displayed in Fig. 7. For the KRL sample, the median of the distribution of is and that of is . For the Norris sample, the medians of the distributions of and are and , respectively. Two statistical characteristics are observed. One is that the typical value of is negative while that of is positive. The other is that the absolute value of the typical is about four times of that of . If this is expectable by the Doppler model is unclear. In addition, we find that the distribution of is much narrower than that of , which suggests that if served as a parameter associated with mechanisms, the latter index must be more sensitive than the former.
4 Discussion and conclusions
As predicted previously, emission of pulses over a relativistically expanding fireball surface could lead to A power law anti-correlation between the pulse width and energy and a power law correlation between the ratio of the rising width to the decaying width and energy. Although A power law anti-correlation between the pulse width and energy was observed by many authors, it is unclear if a power law correlation between the width ratio and energy could be detected in the same sources. In this paper we investigate this issue with two samples which contain well identified pulses, with one being the KRL sample (Kocevski et al. 2003) and the other being the Norris sample (Norris et al. 1999).
There are 84 sources in total for the two samples (where 19 bursts are included in both samples). Shown in these samples, a power law relationship could indeed be well established between not only the pulse width and energy but also the ratio of rising width to the decaying width and energy. A power law anti-correlation between and energy and a power law correlation between and energy are seen in the light curves of the majority (around 65%) of bursts of the two samples. This suggests that these bursts are likely to arise from the emission associated with the shocks occurred on a relativistically expanding fireball surface, where the curvature effect must be important (see Paper I). For the rest of the bursts, the corresponding mechanism is currently unclear. We propose that a varying synchrotron or Comptonized radiation or a different pattern of the spectral evolution should be concerned. In this case, one might be sure if the observed relationships for these rest bursts can also be accounted for by the curvature effect.
In addition, we find that the largest values of in the four channels of the two samples do not exceed 0.9, which is in agrement with what predicted previously in Qin et al. (2004), where they suggested that there is an upper limit of which is approximately 1.3.
An analysis of the relationship between the two power law indices and reveals an anti-correlation between the two. We divide the plane into three regions. They are regions I ( and ), II ( and ) and III () (see Fig. 6). Sources inside these regions are defined as classes 1, 2 and 3, respectively. While bursts in region I (class 1) were predicted previously, those in regions II (class 2) and III (class 3) are unfamiliar. We suspect that different locations of (, ) might correspond to different mechanisms such as the pattern of the evolution and the real form of the rest frame spectrum. If so, the plot of might be useful to provide information of mechanisms. We observe that the absolute value of the typical is about four times of that of , and the distribution of is much narrower than that of . This indicates that, if they are parameters confined by mechanisms, must be more sensitive than .
One might observe from the estimated values of the and of the four BATSE channels available and the indices derived from and energy and from and energy for the KRL sample and the Norris sample that uncertainties of are larger than the uncertainties of the corresponding index . This is due to the error transform nature (note that the uncertainty of is determined by the uncertainty of , while the uncertainty of is determined by the uncertainty of ; the later must be larger than the former). The large uncertainty and the narrow distribution makes the estimated values of quite uncertain. This might misidentify some bursts of class 1 as those of class 2, or vice versa. Therefore, definitions of many of the bursts of classes 1 and 2 are not certain, and thus the percentage of the number of any of the classes to the total number is not certain. However, due to the following reasons we argue that this is unlikely to change the percentage dramatically. The first is that we have checked each burst very carefully and then have been sure that the fitting curves pass through indeed the central regions of the observed data. This could be confirmed by the very narrow distribution of the reduced shown in Fig. 3 (for the goodness of fit one can also refer to Figs. 1 and 2). The second is that while some bursts of class 1 might be misidentified as those of class 2, some sources of class 2 might also be misclassified as those of class 1, and this will ease the problem (one can observe from Fig. 6 that there are bursts of both classes 1 and 2 located around the horizon line of ).
As suggested by Qin et al. in Paper I, for the two relationships concerned, there would be a plateau or a slope (appeared also as a power law) beyond the main power law range, depending on the form and the evolution pattern of the rest-frame spectrum. These were noticed in the much smaller sample employed in Paper I. They are also observed in the two samples employed here. It should be noticed that in some cases these features might lead to a smaller absolute value of the power law index (e.g., when the turnover appears within the energy range concerned). If the energy range of observation is large enough, one can expect to measure the indices within the main power law range for each burst, and in that case the bursts would be easier to classified. Also in this case the lower and upper limits of the main power law range would be well measured and this in turn would provide an independent test to the Doppler model. As revealed in Paper I, besides the common features (the plateau/power law/plateau and the peaked features), there exhibit other features in a few cases. For a small number of bursts in our samples, a abnormal sinkage feature could be observed in the two relationships, which is not a result predicted in Paper I. What causes this is unclear.
The conclusion that the ratio of the rising width to the decaying width of the majority of bursts tend to be larger at higher energies shown in this paper is conflicted with what was noticed previously. We argue that this effect is indeed very small and is hard to be observed as pointed out above. However, this tendency holds in terms of statistics. The tendency can also be observed from Fig. 7 (right panel), where the majority of bursts have greater than zero. Direct evidence of the tendency can be obtained in the relationships between and energy and that between and energy for the two samples, when one paying attention to the bursts of class 1, which are about 65% of the total bursts. We suspect that it is the small absolute values of that make the detection difficult and this probably leads to the un-detection of the tendency in previous works.
As suggested previously, when the opening angle of uniform jets is sufficiently larger (say, much larger than ), the pulse observed would not be significantly different from that arising from the whole fireball surface (see Qin and Lu 2005). Therefore, conclusions favoring a fireball generally favor a uniform jet.
This work was supported by the Special Funds for Major State Basic Research Projects (“973”) and National Natural Science Foundation of China (No. 10273019).
References
- [Chiang (1998)] Chiang, J. 1998, ApJ, 508, 752
- [Cohen et al. (1997)] Cohen, E., Katz, J. I., Piran, T., & Sari, R. 1997, ApJ, 488, 330
- [Costa (1998)] Costa, E. 1998, Nuclear Physics B (Proc. Suppl.), 69/1-3, 646
- [Crew et al. (2003)] Crew, G. B.; Lamb, D. Q.; Ricker, G. R.; Atteia, J.-L.; Kawai, N.; Vanderspek, R.; Villasenor, J.; Doty, J.; et al. 2003, ApJ, 599, 387
- [Dermer (1998)] Dermer, C. D. 1998, ApJ, 501, L157
- [Fenimore et al. (1993)] Fenimore, E., Epstein, R., & Ho, C. 1993, A&AS, 97, 59
- [Fenimore et al. (1995)] Fenimore, E. E.; in ’t Zand, J. J. M.; Norris, J. P.; Bonnell, J. T.; Nemiroff, R. J. 1995, ApJ, 448, L101
- [Fenimore et al. (1996)] Fenimore, E. E., Madras, C. D., and Nayakshin, S. 1996, ApJ, 473, 998
- [Feroci et al. (2001)] Feroci, M.; Antonelli, L. A.; Soffitta, P.; in’t Zand, J. J. M.; Amati, L.; Costa, E.; Piro, L.; Frontera, F.; et al. 2001, A&A, 378, 441
- [Fishman et al. (1992)] Fishman, G., et al. 1992, in Gamma-Ray Bursts: Huntsville, 1991, ed. W. S. Paciesas & G. J. Fishman (New York: AIP), 13
- [Fishman et al. (1994)] Fishman, Gerald J.; Meegan, Charles A.; Wilson, Robert B.; Brock, Martin N.; Horack, John M.; Kouveliotou, Chryssa; Howard, Sethanne; Paciesas, William S.; et al. 1994, ApJS, 92, 229
- [Kazanas et al. (1998)] Kazanas, D., Titarchuk, L. G., & Hua, X.-M. 1998, ApJ, 493, 708
- [Kocevski et al. (2003)] Kocevski, D., Ryde, F., and Liang, E. 2003, ApJ, 596, 389
- [Lee et al.(2005)] Lee, A., Bloom, E. D., & Petrosian, V. 2000a, ApJS, 131,1
- [Lee et al. (2005)] Lee, A., Bloom, E. D., & Petrosian, V. 2000b, ApJS, 131, 21
- [Link, Epstein, & Priedhorsky (1993)] Link, B., Epstein, R. I., & Priedhorsky, W. C. 1993, ApJ, 408, L81
- [Nemiroff et al. (1993)] Nemiroff, R. J.; Norris, J. P.; Wickramasinghe, W. A. D. T.; Horack, J. M.; Kouveliotou, C.; Fishman, G. J.; Meegan, C. A.; Wilson, R. B.; et al. 1993, ApJ, 414, 36
- [Nemiroff (2000)] Nemiroff, R. J. 2000, ApJ, 544, 805
- [Norris et al. (1996)] Norris, J. P.; Nemiroff, R. J.; Bonnell, J. T.; Scargle, J. D.; Kouveliotou, C.; Paciesas, W. S.; Meegan, C. A.; Fishman, G. J. 1996, ApJ, 459, 393
- [Norris et al. (1999)] Norris, J. P.; Bonnell, J. T.; Watanabe, K. 1999, ApJ, 518, 901
- [Norris et al. (1996)] Norris, J. P.; Marani, G. F.; Bonnell, J. T. 2000, ApJ, 534, 248
- [Piran (1999)] Piran, T. 1999, Phys. Rep., 314, 575
- [Piro et al. (1998)] Piro, L.; Heise, J.; Jager, R.; Costa, E.; Frontera, F.; Feroci, M.; Muller, J. M.; Amati, L.; et al. 1998, A&A, 329, 906
- [Qin (2002)] Qin, Y.-P. 2002, A&A, 396, 705
- [Qin (2003)] Qin, Y.-P. 2003, A&A, 407, 393
- [Qin et al. 2004] Qin, Y.-P., Zhang, Z.-B., Zhang, F.-W., and Cui, X.-H. 2004, ApJ, 617, 439
- [Qin $ Lu 2005] Qin, Y.-P., Lu,R.-J. 2005, MNRAS, 362, 1085
- [Qin et al. 2005] Qin, Y.-P., Dong, Y.-M., Lu, R.-J., Zhang, B.-B., and Jia, L.-W. 2005, ApJ, 632, 1008Q (Paper I)
- [Ryde and Svensson (2002)] Ryde, F., & Svensson, R. 2000, ApJ, 529, L13
- [Ryde and Petrosian (2002)] Ryde, F., and Petrosian, V. 2002, ApJ, 578, 290
- [Wang et al. (2000)] Wang, J. C., Cen, X. F., Qian, T. L., Xu, J., & Wang, C. Y. 2000, ApJ, 532, 267