Deuterated molecules in DM Tau: DCO+, but no HDO
We report the detection of the J=2-1 line of DCO+ in the proto-planetary disk of DM Tau and re-analyze the spectrum covering the 465 GHz transition of HDO in this source, recently published by Ceccarelli et al. (2005). A modelling of the DCO+ line profile with the source parameters derived from high resolution HCO+ observations yields a DCO+/HCO+ abundance ratio of , an order of magnitude smaller than that derived in the low mass cores. The re-analysis of the 465 GHz spectrum, using the proper continuum flux (0.5 Jy) and source systemic velocity (), makes it clear that the absorption features attributed to HDO and C6H are almost certainly unrelated to these species. We show that the line-to-continuum ratio of an absorption line in front of a Keplerian disk can hardly exceed the ratio of the turbulent velocity to the projected rotation velocity at the disk edge, unless the line is optically very thick (). This ratio is typically 0.1-0.3 in proto-planetary disks and is in DM Tau, much smaller than that for the alleged absorption features. We also show that the detection of H2D+ in DM Tau, previously reported by these authors, is only a 2-sigma detection when the proper velocity is adopted. So far, DCO+ is thus the only deuterated molecule clearly detected in proto-planetary disks.
Key Words.:
Stars: circumstellar matter – planetary systems: protoplanetary disks – individual: DM Tau – Radio-lines: stars1 Introduction
Deuterated molecules are powerful probes of the physical and chemical state of star forming regions. They are routinely observed in low mass pre-stellar cores where they are found to be particularly abundant (see e.g. Butner et al., 1995). Since the detection of several H-bearing molecules in the protoplanetary disks surrounding DM Tau and GG Tau (Dutrey et al., 1997), the question rose of whether deuterated molecules could also be observed in proto-planetary disks. van Dishoeck et al. (2003) have reported the detection of DCO+ in the disk of TW Hya. Recently, Ceccarelli et al. (2004, 2005) (hereafter CD04,CD05) have reported the detection in DM Tau of H2D+, a key ion in deuterium enhancement reactions, and of deuterated water, HDO. In this letter, we present the detection of DCO+ in the disk of DM Tau.
The HDO line reported by CD05 and two lines of C6H present in the same spectrum appear in absorption against the thermal emission of the dusty disk. These absorptions, if real, forces us to revise our views on the disk structure, since water is expected to freeze onto grains at the low temperatures ( K) encountered in such disks. They also imply very large molecular column densities. We argue in this letter that the low signal-to-noise ratio of the observations and an overestimation of the continuum flux by a factor 4 cast doubt on the reality of the HDO and C6H detections.
2 Observational Data
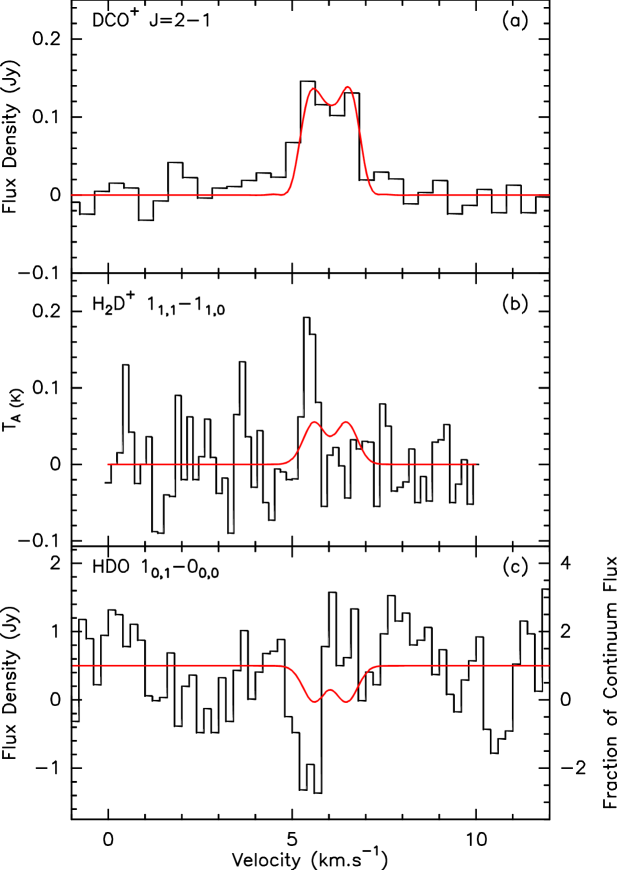
We have observed the DCO+ J=2-1 transition at 144.0773 GHz using the IRAM 30-m telescope in Oct 199, Feb and Sep 2000, using the observing strategy of Dutrey et al. (1997). The system temperature was about 200 K, and the total integration time 39 hours. The resulting spectrum is presented in Fig.1a, with the best fit profile derived using a double gaussian with parameters ( and and line width ) taken from the fit of the J=21 transition given by Guilloteau & Dutrey (1994). The integrated line flux is .
CD05 report the detection of the HDO line with a peak line to continuum ratio of about 0.9, a linewidth of , and an LSR velocity of (using the rest frequency of the HDO transition, 464.9425 GHz from DeLucia et al., 1971). However, the systemic velocity of the DM Tau disk is (Guilloteau & Dutrey, 1998), and all molecular lines detected by Dutrey et al. (1997) exhibit a flat-topped or double-peaked profile typical of Keplerian disks, with a line width of .
Furthermore, CD05 used a continuum flux of 2.0 Jy for DM Tau at 464 GHz (650 m), based on a model of the source presented in their Figure 2. However, the model curve indicates a 464 GHz flux of erg cm-2 s-1, or Jy only, in agreement with the two measurements near this frequency displayed on the same Figure. Dartois et al. (2003) quote mJy in the millimeter range, which yields 630 mJy at 464 GHz. This is an upper limit, since the SED is expected to flatten above 250 GHz because of the contribution of the optically thick core (as can be seen in Figure 2 of CD05). Andrews & Williams (2005) measured flux densities of Jy at 350 m and mJy at 850 m, which, interpolated by a single power law, gives 380 mJy (in this case a lower limit to the flux). Thus, the continuum flux of DM Tau at 464 GHz is most likely about 0.45 Jy, more than a factor of 4 below what has been assumed. Fig.1c displays the HDO spectrum with the line to continuum ratio computed assuming a continuum flux of 0.5 Jy and an antenna gain of 35 Jy/K, as appropriate for the JCMT at 460 GHz.
Using the correct continuum flux and systemic velocity, the fitted equivalent width of the HDO line (which is the integrated area of the line to continuum ratio) is . Similar results are obtained when fixing the line width to , or by using a double-peaked line profile as above for DCO+. The absorption feature assigned to HDO is thus not significant.
The inappropriate velocity of 5.5 was used by CD04 for the detection of the ortho-H2D+ line. When analyzed with the 6.05 velocity as above, the integrated area of this line is K , i.e. at best a 2 detection (see Fig.1b).
3 Absorption Lines in Keplerian Disks
In proto-planetary Keplerian disks, the line formation process is different from that in an homogeneous static medium, and this for three reasons: 1) the velocity shear created by the disk rotation 2) the strong surface density gradient as a function of radius, and 3) the radial temperature gradient.

The first effect has been discussed in details in the context of line emission from Keplerian disks by Horne & Marsh (1986), for application to cataclysmic binaries. For absorption, the maximum line to continuum ratio is limited by the velocity coherence along the line of sight. Unless the disk is seen face on, only a fraction of the disk projects at any given velocity. This fraction can be estimated with simple reasoning. From a point at (in cylindrical coordinates, with at the intersection of the disk plane with the plane of the sky) in a geometrically thin Keplerian disk, the projected velocity along the line of sight is
| (1) |
We can set by a simple change of referential. The projection of the rotation velocities along the line of sight breaks the azimuthal symmetry, but preserves
| (2) |
allowing to study only the interval . The locii of isovelocity is given by
| (3) |
Eq.2 implies that the spectrum is symmetric. With a finite local line width , the line at a given velocity originates from a region included between and :
| (4) | |||||
| (5) |
assuming a rectangular line shape for simplification. We define as :
| (6) |
where is the disk outer radius. In general, unless is small, . Then for , . For larger velocities, , is smaller and given by
| (7) |
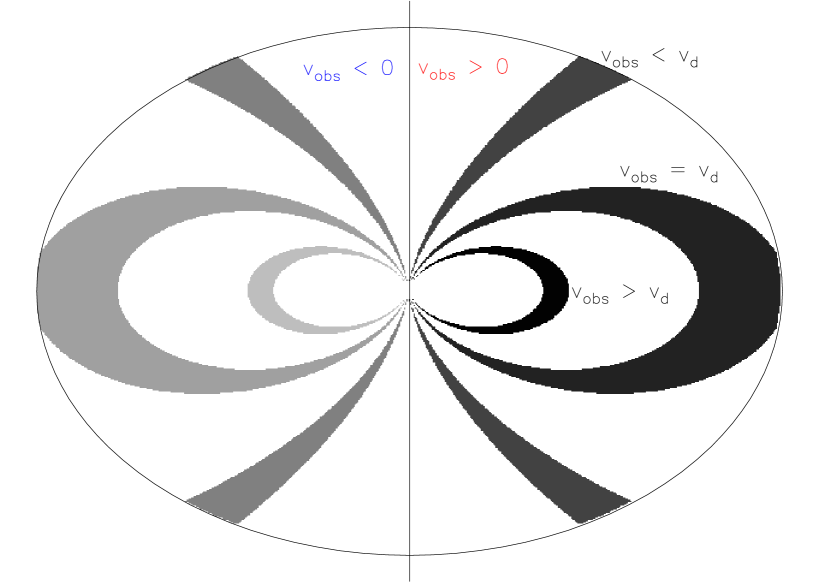
Figure 2 indicates the regions of equal projected velocities for 6 different values: , , , and their symmetric counterpart at negative velocities. Fig.2 shows that the fraction of the disk covered by the gas at velocities is of order , and drops very rapidly for larger velocities. Accordingly, the line to continuum ratio of absorption lines cannot exceed this value, and will be smaller for optically thin lines.
For a more quantitative evaluation, we used the radiative transfer code developed by Dutrey et al. (1994) to simulate the expected line shape for an absorption line from a Keplerian disk with parameters (inclination, dust emission, , scale height) similar to those of DM Tau. To perform this simulation, we assumed that the HDO abundance is constant, and that the surface density is a power law as function of radius with exponent . We did not assume LTE, but because HDO is difficult to excite by collisions, we assumed instead that the levels are populated only by the cosmological background, with a line excitation temperature of 2.7 K. The continuum emission comes from dust with a power law distribution for the temperature K, with the same surface density power law. Unless otherwise specified, the disk inclination is set to , the local line width to 0.2 , the outer radius to AU, the orbital velocity at 100 AU to 2.10 , corresponding to a stellar mass of , and the HDO column density at 100 AU to cm-2.
Fig 3a-f show the expected profile for different disk parameters. Since the continuum brightness is highly centrally peaked, the line to continuum ratio depends significantly neither on the disk outer radius, nor on the surface density exponent (Fig 3a-b). Only the separation between the two peaks depends on these parameters. Fig 3e shows that the line shape depends strongly on the disk inclination. For a face on disk, the line is single-peaked, and its width depends on the local line width (with a opacity broadening factor). For moderate inclination, the line becomes double-peaked, with the two peaks corresponding to the projected rotation velocity near the disk outer edge. For an edge-on disk, the opacity towards the central star (thus at a zero projected velocity) becomes important, and the central dip is filled again when the column density is high enough (as in this example).
The two most significant effects are due to the intrinsic line-width (Fig.3c) and the molecular column density (Fig.3d). The equivalent width increases nearly linearly with the local line width, but only with the logarithm of the column density (through the opacity broadening effect), as can be seen in Fig.4.
We used in Fig.3a-e a minimal excitation temperature, 2.7 K. For increasing values of , due e.g. to collisions, the absorption at zero velocity will first diminish, then reverse to emission, the line wing reversing to emission at slightly higher values (because the wings originate from the inner disks, where the dust brightness temperature is higher), as shown in Fig.3f. Non uniform mixing with the dust will affect the line intensity, although in general weakly, see e.g. Walterbos & Kennicutt (1988), but will not significantly affect the line shape which is dictated by the velocity structure.

Finally, we note that the simulated profiles could also be applied to other molecular transitions, provided the column density is changed to the appropriate scale: here, a column density of cm-2 corresponds to a typical opacity of 4 at 100 AU.
4 Discussion
We have shown in Sec.2 that there is little evidence that the absorption feature identified by CD05 with the line of HDO (see Fig.1c) is real and arises in the disk of DM Tau, and we have set in Sec.3 further constraints on the expected line profiles in such a disk. Two additional absorption features at 464917.2 MHz and 465051.1 MHz, observed in the same spectrum, were identified by CD05 with lines of C6H. This identification also is almost certainly incorrect. Although two C6H transitions are listed at these frequencies in the JPL Spectral line catalog (Pickett et al., 1998), these are cross-ladder transitions that connect the upper spin state of C6H to the ground spin state. These transitions are intrinsically weak and originate from levels with high energies ( K): they are very unlikely to be seen in DM Tau, especially in absorption. Mostly, their frequencies depend on the spin orbit constant , whose value has not been directly measured, and are uncertain by several hundred MHz (Pearson et al., 1988), which prevents any sensible identification.
The detection of H2D+ in DM Tau reported by CD04 is also not secure, as it is only at the level when fitted with an appropriate line profile. Since the tentative detection in TW Hya reported in the same paper has also not been confirmed, but remains consistent with a 2 upper limit of 0.3 K from the JCMT (Thi & van Dishoeck 2004, cited by CD04), this re-analysis casts doubt on the detection of H2D+ in proto-planetary disks at large.
This brings the number of deuterated species firmly detected in proto-planetary disks down to only one, DCO+, in two sources: in TW Hya, through the detection of the DCO+ J=5-4 transition by van Dishoeck et al. (2003), and in DM Tau (this work).
We have analyzed the DCO+ line using the DM Tau disk parameters derived from high angular resolution observations of the HCO+ J=1-0 line performed with the IRAM interferometer (Piétu et al., 2006). We find that this line profile corresponds to a DCOHCO+ ratio of , provided this ratio is constant throughout the disk. Note that a derivation which does not take into account the specificity of the line formation process in a disk (e.g. which would assume HCO+ and DCO+ lines to be optically thin, or would not take into account the density and temperature gradients) would give a completely different DCO+/HCO+ ratio. When no resolved image is available, the analysis must still use an approximate disk structure, as done for example by Dutrey et al. (1997). The DCO+/HCO+ abundance ratio derived for DM Tau is smaller than in typical dark clouds or (cold) proto-stellar envelopes (, see Butner et al., 1995).
Finally, Sec.3 shows that the detection of absorption lines from proto-planetary disks require very high sensitivities, and that such lines are very insensitive tracers of the total column density. At 464 GHz, with 1 velocity resolution, and a system temperature of 400 K, a good sub-mm 12-m antenna such as APEX would reach a noise of 0.3 Jy in 1 hour. This is 3 times more than the maximum absorption signal that could be expected in typical proto-planetary disks (line to continuum ratio 0.2, flux density 0.5 Jy). A 4 detection would require more than 100 hours. Only ALMA, with its 50 antennas, would reach enough sensitivity, mJy in 1 hour for its minimal angular resolution. However, this resolution is already 0.7′′ at this frequency, so that the continuum source would be partially resolved.
Acknowledgements.
We thank Pierre Hily-Blant for helping with the data reduction of the 30-m observations.References
- Andrews & Williams (2005) Andrews, S. M. & Williams, J. P. 2005, ApJ, 631, 1134
- Butner et al. (1995) Butner, H. M., Lada, E. A., & Loren, R. B. 1995, ApJ, 448, 207
- Ceccarelli et al. (2005) Ceccarelli, C., Dominik, C., Caux, E., Lefloch, B., & Caselli, P. 2005, ApJ, 631, L81
- Ceccarelli et al. (2004) Ceccarelli, C., Dominik, C., Lefloch, B., Caselli, P., & Caux, E. 2004, ApJ, 607, L51
- Dartois et al. (2003) Dartois, E., Dutrey, A., & Guilloteau, S. 2003, A&A, 399, 773
- DeLucia et al. (1971) DeLucia, F., Cook, R., Helminger, P., & Gordy, W. 1971, J. Chem. Phys., 55, 5334
- Dutrey et al. (1997) Dutrey, A., Guilloteau, S., & Guelin, M. 1997, A&A, 317, L55
- Dutrey et al. (1994) Dutrey, A., Guilloteau, S., & Simon, M. 1994, A&A, 286, 149
- Guilloteau & Dutrey (1994) Guilloteau, S. & Dutrey, A. 1994, A&A, 291, L23
- Guilloteau & Dutrey (1998) Guilloteau, S. & Dutrey, A. 1998, A&A, 339, 467
- Horne & Marsh (1986) Horne, K. & Marsh, T. R. 1986, MNRAS, 218, 761
- Pearson et al. (1988) Pearson, J. C., Gottlieb, C. A., Woodward, D. R., & Thaddeus, P. 1988, A&A, 189, L13
- Pickett et al. (1998) Pickett, H. M., Poynter, R. L., Cohen, E. A., et al. 1998, J. Quant. Spectrosc. & Rad. Transfer, 60, 883
- Piétu et al. (2006) Piétu, V., Guilloteau, S., & Dutrey, A. 2006, in prep.
- van Dishoeck et al. (2003) van Dishoeck, E. F., Thi, W.-F., & van Zadelhoff, G.-J. 2003, A&A, 400, L1
- Walterbos & Kennicutt (1988) Walterbos, R. A. M. & Kennicutt, R. C. 1988, A&A, 198, 61