VLA Observations of Carbon 91 Recombination Line Emission in W49 North
Abstract
We have detected C91 (8.5891 GHz) emission toward 4 ultra-compact H ii regions (UCHs; W49G, J, L & C) in the W49 North massive star forming region with the Very Large Array (VLA) at 3″ resolution. No carbon line emission was detected toward UCHs W49F, A, O, S and Q at this frequency to a 3 level of 2 mJy. We also observed the same region in the C75 line (15.3 GHz) with no detection at a 3 level of 6 mJy with a 1″.7 beam. Detection of line emission toward these sources add supporting data to the earlier result of Roshi et al. (2005a) that many UCHs have an associated photo-dissociation region (PDR). Similarity of the LSR velocities of carbon recombination lines and H2CO absorption toward UCHs in W49 North suggests that the PDRs reside in the dense interface zone surrounding these H ii regions. Combining the observed carbon line parameters at 8.6 GHz with the upper limits on line emission at 15.3 GHz, we obtain constraints on the physical properties of the PDRs associated with W49G and J. The upper limit on the number density of hydrogen molecule obtained from carbon line models is cm.
1 Introduction
Observations of molecular material in the vicinity of ultra-compact H ii regions (UCHs) have shown that the ambient molecular gas may have very high densities. For example, observations of high density molecular tracers in the W49 North molecular cloud core show that the molecular density is a few times 106 cm(Serabyn, Güsten & Schulz 1993; see also Churchwell 2002 and references therein). The presence of such high density gas surrounding the UCHs has other effects. In particular, the far-ultra violet (FUV; 6 – 13.6 eV) photons that escape the UCH produce photo-dissociation regions (PDRs) at the interface between the ionized and molecular material ( Hollenbach & Tielens 1997). In these PDRs, carbon will be ionized since it has a lower ionization potential (11.3 eV). The physical conditions in such PDRs are ideal to produce observable carbon radio recombination lines (RRLs).
A recent search for carbon RRLs toward UCHs have detected lines in a majority of directions (Roshi et al. 2005a). These observations were done near 9 GHz toward 17 UCHs and carbon RRLs were detected from 11 sources (65 % detection rate). The large detection rate indicates that most UCHs have an associated PDR. High-angular resolution, multi-frequency carbon RL observation from these PDRs are useful in addressing important issues related to UCHs and their evolution. For example, such a data set can be used : (1) to estimate the physical properties of the PDR (Roshi et al. 2005a, b; Garay et al. 1998, Natta, Walmsley & Teilens 1994) and (2) to address the ‘lifetime problem’ of UCHs (Wood & Churchwell 1989) by investigating whether some UCHs are pressure confined (De Pree, Rodríguez & Goss 1995; Roshi et al. 2005a).
In this paper, we report the detection of C91 (8.5891 GHz) emission toward several UCHs in W49 North. The W49 star forming region lies close to the Galactic plane ( = 43o.2, = 0o.00) and is embedded in a giant molecular cloud of size 100 pc (Simon et al. 2001), at a distance of 11.41.2 kpc (Gwinn, Moran & Reid 1992). Radio continuum observations have identified 45 UCHs within the molecular cloud (De Pree, Mehringher Goss 1997). The properties of these UCHs were well studied through radio continuum as well as hydrogen and helium RL observations (De Pree et al. 1997; De Pree et al. 2000). Here we present new carbon RL observations of W49 North with the Very Large Array (VLA). The details of the observations are given in §2. In §3, we provide the parameters of the observed carbon lines and present models for the line formation. A discussion of the results obtained is given in §4.
2 Observation and data reduction
The observations were carried out on 22 November 1998 using the Very Large Array of the National Radio Astronomy Observatory111The National Radio Astronomy Observatory is a facility of the National Science Foundation operated under a cooperative agreement by Associated Universities, Inc.. We used the C array for the observations. The helium and carbon RRLs at both 8.6 GHz ( He and C 91 ) and 15.3 GHz (He and C 75) were interleaved during the 8 hour period. The synthesized beam is 1″.8 1″.6 (PA: 18o) at 15.3 GHz and 3″.1 2″.9 (PA: 17o) at 8.6 GHz. The observations were centered at 25 km s-1(LSR) to center the recombination lines between the He and C lines ( the velocity difference between He and C is about 30 km s-1). The observed field was centered at the coordinates RA (J2000) = 19h10m13s.41 and (J2000) = 09o0116′′.1. We used a total bandwidth of 3.125 MHz with 127 channels spaced by 24.4 kHz (velocity resolution 1 km s-1) at 8.6 GHz and 6.25 MHz with 63 channels spaced by 97.7 kHz (velocity resolution 2 km s-1) at 15.3 GHz. Two orthogonal circular polarizations were observed. The source 3C286 was used as the absolute flux density calibration and phase calibration was carried out by frequent observations of the compact source B1920+154. The bandpass response was determined by observations of 3C84 and 3C273.
The images were made using natural weighting in order to improve the sensitivity to extended sources. The continuum was subtracted using UVLSF in AIPS based on the line free channels. The final line cubes have an RMS noise of 0.7 mJy /beam (Hanning smoothed) at 8.6 GHz and 1.9 mJy /beam at 15.3 GHz.
3 Results
3.1 Carbon recombination line emission
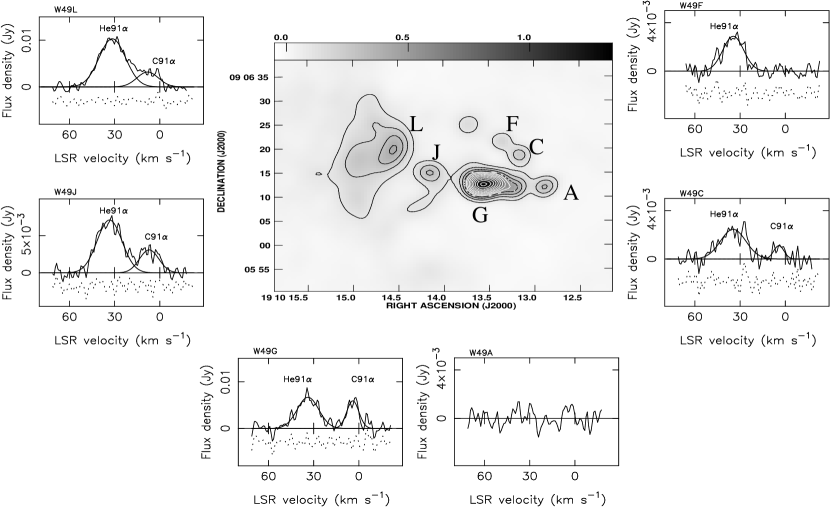
The central image in Fig 1 shows the 8.6 GHz continuum at 3″ resolution. The RMS noise in the continuum image is 7 mJy/beam. The spectra at 8.6 GHz obtained toward six sources are also shown in figure 1. The C91 line was detected toward four UCHs (W49G, J, C & L). The central coordinates and the extent of the region over which the data are averaged are listed in Table 1. Table 2 gives the parameters of both carbon and helium lines obtained from the six spectra. The strongest carbon line (flux density 6 mJy) is observed toward W49G. This result is expected since the carbon line emission is dominated by stimulated emission at these frequencies (Natta et al. 1994; Roshi et al. 2005a, b) and W49G is the strongest continuum source in the observed field. Weak carbon line emission is observed toward W49J, C and L. The parameters of carbon line emission toward W49L may be affected by the larger velocity extent of helium line emission. No carbon line emission is detected in our 15.3 GHz data to a 3 level of 6 mJy with a beam size of 1″.7.
3.2 Comparison with molecular line emission
We can compare carbon RRL emission with existing CS (Serabyn et al. 1993) and H2CO (Dickel & Goss 1990) observations. Multi-transitional observations of CS have provided information on the structure of molecular cloud in W49 North and its kinematics. The cloud core consists primarily of three molecular clumps, designated as CS-NE, CS-C and CS-SW, with sizes between 0.4 – 1 pc. Combining the CS observations with H2CO absorption studies, Serabyn et al. (1993) suggested that W49G, C and F are associated with the clump CS-C; W49A and L are probably associated with CS-SW and CS-NE, respectively. The association of W49J with any one of three molecular clumps is not certain. Here we focus on the associations of UCHs in W49 North which are relevant for the present discussion. The LSR velocity of CS lines from clump CS-C is 4.31.0 km s-1, similar to the velocity of the carbon RRLs (4.21.0 km s-1) in the direction of W49G and C. These two sources also exhibit H2CO absorption components with an average velocity of 5.20.8 km s-1. The carbon RRLs observed from W49L and J have velocities of 7.10.6 km s-1, different from the velocity of the CS line from the clump CS-NE (11.91.0 km s-1). The H2CO absorption components observed toward these sources have velocities 7.20.2 km s-1(Dickel & Goss 1990; We estimated approximate errors on the central velocity of H2CO absorption line from the data given in the reference). The similarity of the velocity of the H2CO absorption components and carbon RRL emission toward all four sources suggests that the PDR producing carbon lines reside in the gas responsible for H2CO absorption.
3.3 Models for carbon line emission
We present models for carbon line emission toward W49G and J. Constraints on the physical properties of the PDR could not be obtained toward W49C because the line emission is weak. The W49L data are excluded from modeling since the line parameters may be affected by the large velocity extent of the helium line emission. The detailed steps involved in modeling the carbon line emission are described by Roshi et al. 2005b. A homogeneous ‘slab’ of PDR material placed in front of the UCH is considered for modeling. The radiative transfer equation for non-LTE cases is solved to obtain the RL flux density. We used the computer code originally developed by Brocklehurst & Salem (1977) and later modified by Walmsley & Watson (1982) and Payne, Anantharamaiah & Erickson (1994) to calculate the non-LTE departure coefficients.
The abundance of carbon required for the calculation of departure coefficient is taken as 3 10-4, which implies a depletion factor of 25 % (Natta et al. 1994). The departure coefficients also depend on the background radiation field, assumed to be a thermal background from the UCH. The continuum emission at 8.6 and 15.3 GHz from the UCH (see Table 2) is used to estimate an average emission measure for an assumed temperature of 9000 K. The estimated emission measures for W49G and J are summarized in Table 3. For a given PDR gas temperature, we varied the PDR emission measure to obtain the carbon line flux densities which are consistent with the 8.6 GHz detection and 15.3 GHz upper limit. Fig 2 shows the results of modeling for W49G and J. The data at the two frequencies provide an upper limit on the PDR density and lower limit on the line of sight thickness of the PDR. These limits are obtained for assumed temperatures of 500 and 1000 K (Natta et al. 1994, Roshi et al. 2005b) and summarized in Table 3. The electron density obtained from modeling is converted to molecular density using the assumed abundance of gas phase carbon and by assuming that hydrogen is in molecular form in the PDR.
4 Discussion
The detection of carbon RRLs toward a number of sources in the star forming region W49 North confirm the conclusion (Roshi et al. 2005a) that most UCHs may well have an associated dense PDR. These PDRs are formed at the interface between the ionized and dense neutral material, perhaps a dusty zone separating the two region as in the case of OH maser sources W49B and G (Dickel & Goss 1990). These interface zones are dense with densities 105 cm. Observational evidence for the presence of such zones surrounding W49C and J exists; for W49L the existence of a distinct interface region is uncertain. Dickel & Goss (1990) suggest that the interface zone is responsible for the H2CO absorption. Carbon RRLs observed toward the UCHs in W49 North have LSR velocities similar to that of H2CO absorption components. This similarity suggests that the PDR responsible for carbon line emission resides in these interface zones surrounding UCHs. Modeling the carbon line emission has provided upper limits on densities, which is 5 106 cm. This upper limit is consistent with the densities inferred for the molecular gas in the interface zone from H2CO absorption studies (Dickel & Goss 1990).
References
- (1) Brocklehurst, M., Salem, M. 1977, Computer Phys. Commun., 13, 39
- (2) Churchwell, E., 2002, ARA&A, 40, 27
- (3) De Pree, C. G., Rodríguez, L. F., Goss, W. M., 1995, Rev. Mex. Astron. Astrofis, 31, 39
- (4) De Pree, C. G., Mehringer, D. M., Goss, W. M., 1997, ApJ, 482, 307
- (5) De Pree, C. G., Wilner, D. J., Goss, W. M., Welch, W. J., McGrath, E., 2000, ApJ, 540, 308
- (6) Dickel, H. R., Goss, W. M., 1990, ApJ, 351, 189
- (7) Garay, G., Lizano, S., Gomez, Y., Brown, R. L., 1998, ApJ, 501, 699
- (8) Gwinn, C. R., Moran, J. M., Reid, M. J., 1992, ApJ, 393, 149
- (9) Hollenbach, D. J., Tielens, A. G. G. M., 1997, ARA&A, 35, 179
- (10) Natta, A.; Walmsley, C. M.; Tielens, A. G. G. M. 1994, ApJ, 428, 209
- (11) Payne H. E., Anantharamaiah K. R., Erickson W. C., 1994, ApJ, 430, 690
- (12) Roshi, D. A., Goss, W. M., Anantharamaiah, K. R., Jeyakumar, S., 2005a, ApJ, 626, 253
- (13) Roshi, D. A., et al. 2005b, ApJ, 625, 181
- (14) Serabyn, E., Güsten R., Schulz, A., 1993, ApJ, 413, 571
- (15) Simon, R. et al. 2001, ApJ, 551, 747
- (16) Walmsley C. M., Watson W. D., 1982, ApJ, 260, 317
- (17) Wood, D. O. S., Churchwell, E., 1989, ApJ, 340, 265
| Source | RA(J2000)aaThe spectrum for each source in Fig. 1 and line parameters in Table. 2 are obtained by averaging the data over the area given here. The central coordinates of the area are also given. | DEC(J2000)aaThe spectrum for each source in Fig. 1 and line parameters in Table. 2 are obtained by averaging the data over the area given here. The central coordinates of the area are also given. | Avg. areaaaThe spectrum for each source in Fig. 1 and line parameters in Table. 2 are obtained by averaging the data over the area given here. The central coordinates of the area are also given. |
|---|---|---|---|
| (h m s) | (o ) | (arcsec2) | |
| W49G | 19 10 13.54 | 09 06 12.6 | 19 |
| W49J | 19 10 14.15 | 09 06 15.2 | 14 |
| W49L | 19 10 14.44 | 09 06 21.2 | 16 |
| W49C | 19 10 13.13 | 09 06 18.6 | 11 |
| W49F | 19 10 13.34 | 09 06 22.1 | 9 |
| W49A | 19 10 12.84 | 09 06 12.1 | 12 |
| W49O | 19 10 16.35 | 09 06 07.3 | 18 |
| W49S | 19 10 11.74 | 09 05 27.0 | 27 |
| W49Q | 19 10 10.56 | 09 05 13.9 | 50 |
| Source | aaContinuum flux density with 1 error obtained over the area given in Table 1. | Line | bbThe line parameters are obtained from the spectrum averaged over the area given in Table 1. The errors on the parameters are 1 values. | bbThe line parameters are obtained from the spectrum averaged over the area given in Table 1. The errors on the parameters are 1 values. | bbThe line parameters are obtained from the spectrum averaged over the area given in Table 1. The errors on the parameters are 1 values. | |
|---|---|---|---|---|---|---|
| (GHz) | (Jy) | (mJy) | (km s-1) | (km s-1) | ||
| W49G | 8.6 | 1.9(0.3) | C91 | 5.9 (0.4) | 9.5 (0.8) | 4.0(0.3) |
| He91 | 6.7 (0.3) | 16.8(0.9) | 6.4(0.4) | |||
| 15.3 | 2.4(0.3) | C75 | (6.4) | |||
| W49J | 8.6 | 0.3(0.1) | C91 | 3.1 (0.2) | 15.1(1.5) | 7.1(0.6) |
| He91 | 7.1 (0.2) | 19.3(0.8) | 6.0(0.3) | |||
| 15.3 | 0.3(0.1) | C75 | (3.5) | |||
| W49L | 8.6 | 0.5(0.1) | C91 | 3.2ccCarbon line parameters are affected by the large velocity extent of the helium line emission. (0.2) | 16.7(1.9) | 7.1(0.6) |
| He91 | 10.3(0.2) | 20.7(0.7) | 4.1(0.3) | |||
| W49C | 8.6 | 0.2(0.1) | C91 | 1.1ddTentative detection. (0.2) | 8.0 | 4.3(0.9) |
| He91 | 2.4(0.2) | 19.8(1.4) | 7.2(0.4) | |||
| W49F | 8.6 | 0.13(0.03) | C91 | (0.4) | ||
| He91 | 2.9(0.1) | 16.2(0.9) | 7.1(0.4) | |||
| W49A | 8.6 | 0.2(0.1) | (0.7) | |||
| W49O | 8.6 | 0.5(0.1) | C91 | (0.7) | ||
| He91 | 4.2(0.2) | 29.6(1.4) | 5.9(0.6) | |||
| W49S | 8.6 | 0.5(0.1) | C91 | (0.7) | ||
| He91 | 2.2ddTentative detection.(0.2) | 26.4(2.6) | 3.0(1.1) | |||
| W49Q | 8.6 | 0.5(0.1) | C91 | (1.3) | ||
| He91 | 7.5(0.2) | 17.4(1.1) | 8.7(0.5) |
| Source | aaEstimated emission measure of the UCH using the continuum data for an assumed electron temperature of 9000 K. | TPDR | n | ||
|---|---|---|---|---|---|
| (pc cm-6) | (K) | (cm-3) | ( 10-4 pc) | ( 106 cm-3) | |
| W49G | 6.5107 | 500 | 3000 | 0.7 | 5.0 |
| 1000 | 3500 | 1.9 | 6.0 | ||
| W49J | 1.2107 | 500 | 2800 | 3.6 | 4.5 |
| 1000 | 3000 | 10.1 | 5.0 |