AN EXPERIMENTAL SETUP TO DEVELOP RFI MITIGATION TECHNIQUES FOR RADIO ASTRONOMY
K. Jeeva Priya and D. Anish Roshi
Raman Research Institute, Bangalore 560080
Abstract
Increasing levels of Radio Frequency Interference (RFI) are a problem
for research in radio astronomy. Various techniques to suppress
RFI and extract astronomical signals from data
affected by interference are being tried out. However, extracting
weak astronomical signals in the spectral region affected
by RFI remains a technological
challenge. In this paper, we describe the construction
of an experimental setup at the Raman Research Institute (RRI),
Bangalore, India for research in RFI mitigation. We also present
some results of tests done on the data collected using this setup.
The experimental setup makes use of the 1.42 GHz receiver system
of the 10.4 m telescope at RRI. A new reference antenna, its receiver
system and a backend for recording digitized voltage together with
the 1.42 GHz receiver system form the experimental setup.
We present the results of the characterization of the experimental setup.
An off-line adaptive filter was successfully implemented and tested
using the data obtained with the experimental setup.
Introduction
Radio frequency interference (RFI) is a growing problem for research in radio astronomy. The ITU (International Telecommunication Union) has defined and regulated the usage of the radio spectrum by allocating various frequency bands for different services including radio astronomy. Since radio flux densities from cosmic sources are typically 40 to 100 dB below those due to other services, often the out-of-band emission from other services limits the sensitivity of astronomical observations. Moreover, several radio spectral emissions from cosmic sources are present in the frequency range outside the allocated band for radio astronomy. Thus mitigating interference and extracting radio signals from cosmic sources is essential for advancement of research in radio astronomy.
Several RFI mitigation techniques have been
developed and applied for radio astronomy application
[1], [see also 2], [3 and references therein].
For example, a blanking algorithm to excise short (a few sec wide) pulses
due to distance measuring equipment on astronomical data at frequencies
around 1 GHz was developed and applied to data taken using the Green Bank
telescope [4],[5]. A real-time adaptive cancellation technique to suppress
interference in the voltage domain was developed by [6], while [7]
developed a post-correlation technique, which essentially works on
the power domain (i.e. after detection). The deviation of the
probability distribution of the output of a
telescope from normal distribution in the presence of RFI was also used to
excise interference [8]. These techniques
are successful to a large extent, however, RFI rejection achieved
is not often sufficient for sensitive radio astronomy observations.
Thus research into developing new mitigation techniques is necessary.
In this paper, we describe the construction of an experimental
setup at the Raman Research Institute (RRI) for developing
new mitigation techniques for radio astronomy application and present
some results of the test done on the data obtained with the setup.
The Experimental Setup

A block diagram of the experimental setup is shown in Fig. 1. The 10.4 m telescope at RRI was originally built for operation in the mm-wave band. A few years ago, a 1.4 GHz receiver system was added to the telescope primarily for educational purposes. The 1.4 GHz frequency band of this telescope is contaminated with RFI and hence is an ideal system to develop and test interference mitigation algorithms. We used one of the polarizations of this receiver system as the ‘primary channel’ to receive the RFI contaminated astronomical signal. We constructed a ‘reference channel’ and used the second polarization of the 1.4 GHz receiver system to connect its output to the backend. The ‘reference channel’ consists of a pyramidal horn antenna, coupled to a low noise amplifier (LNA) using a single linearized probe. The horn antenna and the LNA operate near 1420.5 MHz. The signal from the horn antenna is band limited to 25 MHz using a cavity filter. Both primary and reference channel outputs are further amplified and down converted to 50 MHz in the interface unit. At this stage the bandwidth is limited to 10 MHz. We modified an existing Portable Pulsar receiver (PPR; [9]) to record the digitized voltage from the two channels to a Personal Computer (PC) hard disk. The PPR further limits the bandwidth of the signals to 1.3 MHz. The signals are bandpass sampled and digitized to 2 bits before recording.
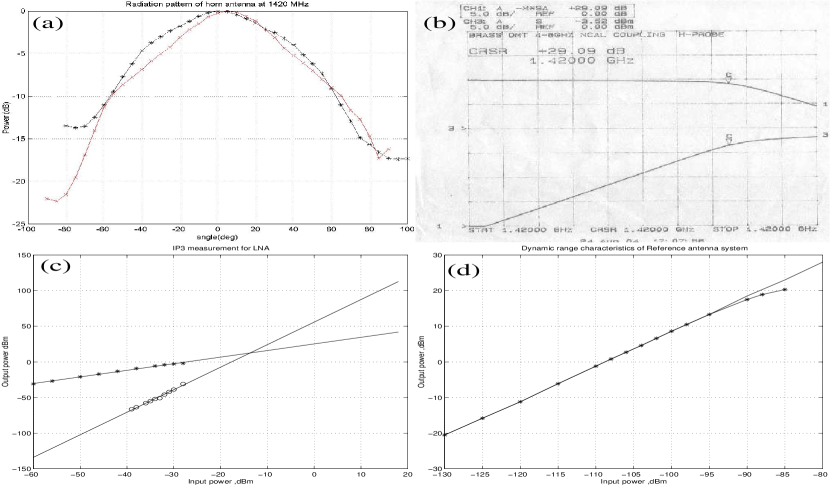
The characteristics of the components of the experimental setup
were measured. The measured E and H plane radiation patterns of the pyramidal
horn antenna are shown in Fig. 2. The half power beam
widths of the antenna in the E and H planes are 60o and 50o
respectively. The LNA used in the ‘reference channel’ is a
three stage HEMT amplifier [10], which has a measured gain of 30 dB,
noise temperature of 30 K and bandwidth of 500 MHz centered at 1.42 GHz.
The 1 dB compression point and the output IP3 (two-tone, third order
intercept point) of the LNA measured at 1.42 GHz are -3.5 dBm and
+12.5 dBm. We also measured the 1 dB compression point of the analog part
of the reference receiver system, which is +17 dBm.
Preliminary Results
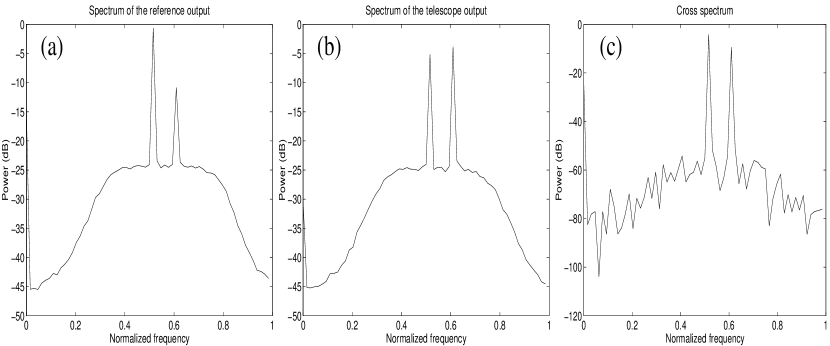

We recorded the data using the experimental system by pointing the telescope at different directions. Sample spectra obtained from the recorded data are shown in Fig. 3. The signals are sampled at a frequency slightly larger than the Nyquist rate (ie 1.3 2 MHz) for the purpose of producing Fig. 3. Two strong narrow band interferences near 0.5 and 0.6 normalized frequencies are present at the telescope and reference antenna outputs. The cross correlation of the two outputs confirms the common origin of both these interferences.
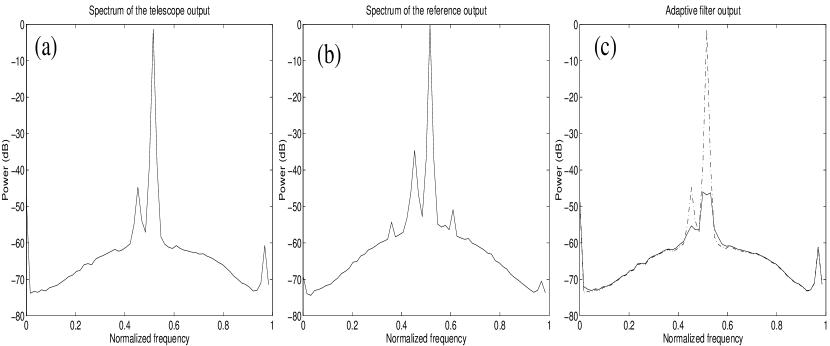
For testing the functioning of the experimental setup, we radiated
a single tone and recorded the data from both the reference and
telescope output. The recorded signals were passed through
an adaptive filter configuration similar to that developed
by [6]. The block diagram
of the adaptive filter, which was implemented using Matlab,
is shown in Fig. 4. A 60 tap FIR
filter along with least mean square (LMS) algorithm was
used for the implementation. The spectra of the input signals
to the adaptive filter and the spectrum of its output are
shown in Fig. 5. The spectra were integrated for
about 100 msec. The narrow band signal near the normalized frequency
0.5 is the radiated tone. The narrow band signal near normalized
frequency 0.45 is an RFI from unknown source. As seen in Fig. 5,
both the radiated tone and the RFI are attenuated by the adaptive
filter. The RFI rejection obtained for the radiated tone is about 45 dB.
Note also that the spectral shape away from the narrow band
interferences is not
affected by the filtering process.
Acknowledgment
We thank the staff of the radio astronomy laboratory and
mechanical workshop at RRI for their generous help during
the construction of the experimental setup. We
thank Prof. N. Udaya Shankar and Prof. C. R. Subrahmanya for
their support. The project described in this paper
is in partial fulfillment of KJP’s M.E (Master of Engineering)
degree requirement. KJP thanks RRI for providing a project
assistantship.
Reference
[1]W. A. Baan, P. A. Fridman, R. P. Millenaar, “Radio Frequency Interference Mitigation at the Westerbork Synthesis Radio Telescope: Algorithms, Test Observations, and System Implementation”, The Astronomical Journal, Volume 128, pp. 933-949, 2004.
[2]R. J. Fisher, “RFI and How to Deal with It”, NAIC-NRAO School on Single-Dish Radio Astronomy: Techniques and Applications, ASP conf. series, eds. S. Stanimirovic, D. R. Altschuler, P. F. Goldsmith, C. Salter, Vol. 278, p. 433-445, 2002.
[3]P. A. Fridman, W. A. Baan, “RFI mitigation methods in radio astronomy”, Astronomy and Astrophysics, v.378, p.327-344, 2001.
[4]J. R. Fisher, Q. Zhang, Y. Zheng, S. G. Wilson, R. F. Bradley, “Mitigation of Pulsed Interference to Redshifted H I and OH Observations between 960 and 1215 Megahertz”, The Astronomical Journal, Vol. 129, pp. 2940-2949, 2005.
[5]Q. Zhang, Y. Zheng, S. G. Wilson, J. R. Fisher, R. F. Bradley, “Excision of Distance Measuring Equipment Interference from Radio Astronomy Signals”, The Astronomical Journal, Vol. 129, pp. 2933-2939, 2005.
[6]C. Barnbaum, F. R. Bradley, “A New Approach to Interference Excision in Radio Astronomy: Real-Time Adaptive Cancellation”, The Astronomical Journal, Volume 116, pp. 2598-2614, 1998.
[7]F. H. Briggs, J. F. Bell, M. J. Kesteven,i “Removing Radio Interference from Contaminated Astronomical Spectra Using an Independent Reference Signal and Closure Relations” The Astronomical Journal, Volume 120, pp. 3351-3361, 2000.
[8]P. A. Fridman, “RFI excision using a higher order statistics analysis of the power spectrum”, Astronomy and Astrophysics, vol.368, pp. 369-376, 2001.
[9]A. A. Deshpande et al., “Portable Pulsar Receiver”, unpublished
[10]A. Raghunathan, “Building of the 21cm front end receiver for the giant metrewave radio telescope”, M.Sc. Engg. Thesis, Bangalore University, India, 2000