INTEGRAL observations of the blazar 3C 454.3 in outburst††thanks: Based on observations obtained with INTEGRAL, an ESA mission with instruments and science data center funded by ESA member states (especially the PI countries: Denmark, France, Germany, Italy, Switzerland, Spain, Czech Republic and Poland), and with the participation of Russia and the USA.
In Spring 2005, the blazar 3C 454.3 underwent a dramatic outburst at all wavelengths from mm to X-rays. This prompted INTEGRAL observations, accomplished in 15-18 May 2005. The source was detected by the INTEGRAL instruments from 3 to 200 keV in a bright state ( erg s-1 cm-2), at least a factor of 2-3 higher than previously observed. This is one of the brightest blazar detections achieved by INTEGRAL. During the 2.5 days of INTEGRAL monitoring, we detected a 20% decrease in the hard X-rays (20-40 keV), indicating that we have sampled the decaying part of the flare. The decrease is less apparent in the soft X-rays (5-15 keV). The simultaneous optical variations are weakly correlated with those at soft X-rays, and not clearly correlated with those at hard X-rays. The spectral energy distribution exhibits two components, as typically seen in blazars, which can be modeled with synchrotron radiation and inverse Compton scattering occurring in a region external to the broad line region.
Key Words.:
Galaxies: active — X-rays: observations1 Introduction
Blazars exhibit the largest luminosities and multiwavelength variability amplitudes among active galactic nuclei (AGN), due to the highly relativistic regimes present in their jets, nearly aligned with the observer line of sight, and to ensuing strong aberration effects (Urry & Padovani (1995), Ulrich et al. (1997)). Their broad-band spectra are typically non-thermal, and are produced most probably by synchrotron radiation at lower energies, and by inverse Compton (IC) scattering off synchrotron or external photons, at higher energies. The extreme conditions present in blazar jets make them bright and ideal targets for observations at high energies, from X-rays to the GeV range. The INTEGRAL satellite has so far provided an important contribution in this field by performing hard X-ray spectroscopy of a number of blazars, up to redshift 2 (3C 273, Courvoisier et al. 2003b; 3C 279, Collmar et al. 2004; PKS B1830-211, De Rosa et al. 2005; PKS 0716+714, S5 0836+710, Pian et al. 2005a; Beckmann et al. 2006).
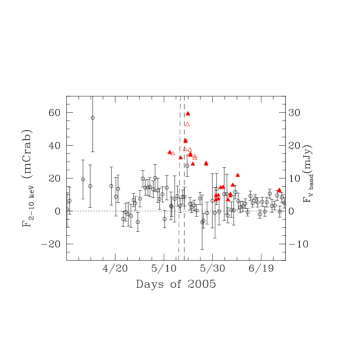
The Flat Spectrum Radio-Quasar (FSRQ) 3C 454.3 () is a known, variable blazar, exhibiting strong emission lines in UV (e.g., Pian, Falomo, & Treves 2005b), remarkable optical variability, radio superluminal motion and a radio and X-ray jet (Lobanov et al. 2000; Marshall et al. 2005), and keV (Worrall & Wilkes 1990; Comastri et al. 1997; Tavecchio et al. 2002), MeV (McNaron-Brown et al. 1995; Zhang, Collmar, & Schönfelder 2005) and GeV (Mukherjee et al. 1997; Hartman et al. 1999) radiation. Its spectral energy distribution (SED) has a synchrotron peak at FIR frequencies and an IC peak at MeV energies (Ghisellini et al. 1998). In April 2005, the source was reported to be in an exceptionally high state in all bands from mm to X-rays (Tornikoski, priv. comm.; Fuhrmann et al. 2006, and references therein; Remillard 2005). Fig. 1 shows the RXTE ASM light curve of 3C 454.3 from beginning of April to end of June 2005. Between the end of April and May 10 the blazar flared, becoming the brightest AGN in the X-ray sky. This triggered the activation of observations with Swift (24 April, 11, 17, 19 May, Giommi et al. 2006), RXTE (12 May), Chandra (19-20 May), and INTEGRAL (15-18 May). Here are presented the results of the INTEGRAL observation, preliminarily reported in Foschini et al. (2005).
2 Observations and data analysis
A Target-of-Opportunity observation of 3C 454.3 with INTEGRAL (Winkler et al. (2003)) started on May 15, 2005, at 18:40 and ended on May 18, 2005, at 09:46 UT. The on source time for IBIS/ISGRI (Ubertini et al. (2003); Lebrun et al. (2003)) and SPI (Vedrenne et al. (2003)) detectors was ks, and for IBIS/PICsIT (Ubertini et al. (2003); Di Cocco et al. (2003)) was ks. Using a searching radius of 3 degrees in the JEM-X (Lund et al. (2003)) data, the source is in the JEM-X field-of-view for a total of 59 ks.
The screening, reduction, and analysis of the INTEGRAL data have been performed using the INTEGRAL Offline Scientific Analysis (OSA) V. 5.1, publicly available through the INTEGRAL Science Data Center111http://isdc.unige.ch/index.cgi?Soft+download (ISDC, Courvoisier et al. 2003a ). The algorithms implemented in the software are described in Goldwurm et al. (2003) for IBIS, Westergaard et al. (2003) for JEM-X, and Diehl et al. (2003) for SPI. The IBIS/ISGRI, SPI and JEM-X data have been accumulated into final images. For the spectral analysis we used the most recent matrices available in OSA V. 5.0 and V. 5.1. The OMC (Mas-Hesse et al. (2003)) data, which have been acquired with a standard V-band Johnson filter, have been extracted with default settings, using a 3x3 pixels binning, which is appropriate for point-like sources. Since this corresponds to a box of size, the measurement of the V-band flux is contaminated by two stars, both located to the North-East, at 14′′ distance from the blazar. One has a brightness comparable to that of the blazar, the other is a factor of 13 fainter. Therefore, after having checked that both stars are not variable, we have corrected the blazar flux for their contributions, equivalent to a total magnitude of (see Raiteri et al. 1998).
Two days before the start of the INTEGRAL campaign and during four days following its end we observed 3C 454.3 with the 2.5m Nordic Optical Telescope (NOT) at the Canary Islands once almost every night with VRI filters (Fig. 1), and, during the maximum of the optical emission, occurred around May 19.5 UT, also with UBJHK filters. The reduction of these data followed standard procedures. The blazar is also a target of extensive mm monitoring at the Metsähovi radio research station.
3 Results
The blazar was detected with all INTEGRAL instruments, except IBIS/PICsIT, in the coadded images of the full observation. By adopting a conservative estimate for the IBIS/ISGRI background, significant signal (10 mCrab) is detected up to 200 keV. With the SPI instrument we detect 3C 454.3 up to the same energy. The source is not seen in individual pointings by JEM-X, therefore its position was fixed to allow spectral extraction. The detection is highly significant, at the level of 4 mCrab. The IBIS/PICsIT 3- upper limit is erg s-1 cm-2 in the 252-336 keV band (corresponding to 53 mCrab). During this observation, five other blazars were located in the IBIS field of view, but went undetected. Their 3 upper limits in the 20-40 keV band are 1.5 mCrab (PKS 2250+1926), 2 mCrab (CTA 102), 3 mCrab (PKS 2209+236), 7 mCrab (PKS 2356+196), and 14 mCrab (3C 445).
The IBIS/ISGRI (20-200 keV), SPI (20-200 keV) and JEM-X (3-15 keV) spectra have been combined and analyzed with XSPEC V. 11. A fit with a single power-law modified by Galactic absorption (fixed to N cm-2, Dickey & Lockman 1990, and consistent with that derived from the LAB survey, Kalberla et al. 2005) yields a photon index () with a for 137 degrees of freedom. The constants of intercalibration between IBIS/ISGRI and the JEM-X and SPI instruments are and , respectively, consistent with the expected values (Cadolle Bel et al. 2006; Lubiński, Dubath, & Paltani 2005). The observed flux in the 3-200 keV band is erg s-1 cm-2. The flux extrapolated to the band 252-336 keV is erg s-1 cm-2, consistent with the IBIS/PICsIT upper limit reported above.
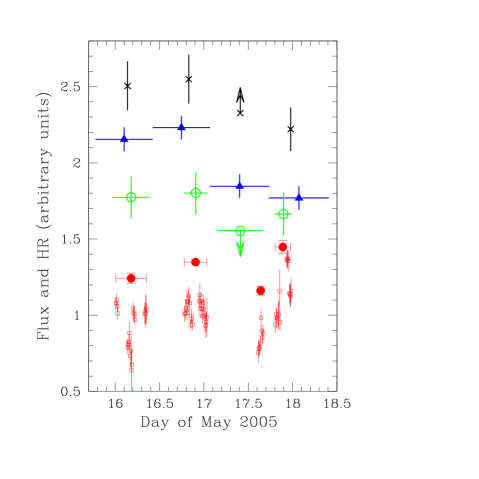
We have subdivided the observation in four intervals of 50 ks each and have evaluated the count rates in the 5-15 keV and 20-40 keV ranges from the JEM-X and IBIS/ISGRI data, respectively. The light curves and hardness ratios between the hard and soft X-ray fluxes are shown in Fig. 2. A decrease of 20% (considering the uncertainties) of the 20-40 keV flux is observed during the monitoring. The 5-15 keV flux is less variable, although a flux drop of at least 10-15% is observed in the third temporal bin. The hardness ratios suggest a marginally significant softening with time. We have also attempted power-law fits of the combined JEM-X and IBIS/ISGRI spectra in the individual temporal bins. Only the first two spectra have sufficient photon statistics for a meaningful fit. The photon indices are and , confirming the softening suggestion, but both formally consistent with the average photon index.
The OMC corrected flux is consistent with the simultaneous photometry taken from ground-based telescopes (e.g., Fuhrmann et al. 2006; Villata et al. 2006), including our own NOT measurements. The OMC light curve is shown in Fig. 2. Significant variations of up to 0.15 magnitudes in time scales of less than an hour are detected. The correlation between the optical and X-ray variations is difficult to assess, because of the limited number and large uncertainty of the high energy data points, and different temporal coverage. When compared to the high energy light curves on a time scale similar to their resolution, the OMC light curve appears not correlated with the hard X-ray emission and somewhat correlated with the soft X-rays.
4 Discussion
We have observed 3C 454.3 during the decaying phase of an outburst and have detected it with all INTEGRAL instruments, except PICsIT. The 3-10 keV flux, originating from IC scattering, is an order of magnitude larger than previously measured in this band (see Worrall & Wilkes 1990; Comastri et al. 1997; Tavecchio et al. 2002). Both the soft and hard X-ray emission is brighter than observed by INTEGRAL for any other blazar, with the exception of 3C 273 (Courvoisier et al. 2003b). The spectrum in the 3-200 keV range is well described by a single power-law of photon index 1.8, indicating that the spectral power output (in representation) rises in this band, and the peak of the IC component is located at the high energy limit of, or beyond the IBIS band, as seen in other FSRQs (e.g. S5 0836+710, Tavecchio et al. 2000; Pian et al. 2005a). The fluxes and spectrum measured by INTEGRAL compare well with those measured nearly simultaneously in the same bands by Swift (Giommi et al. 2006).
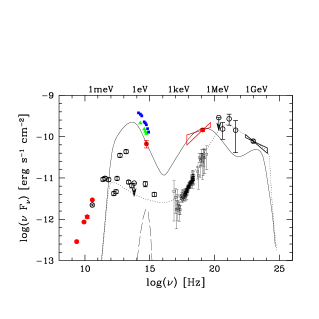
We have reported in Fig. 3 the INTEGRAL data together with radio observations taken in April 2005, nearly one month before our campaign and simultaneous (within few days) mm and optical/NIR observations. The optical/NIR data refer to 3 epochs corresponding to different emission states: we report the minimum flux recorded in optical by the OMC (May 16.18), the intermediate flux measured by REM during the INTEGRAL observation (May 16.9), and the high flux measured by NOT on May 19.7, i.e. 1.2 days after the end of the INTEGRAL monitoring, which is simultaneous with a rapid X-ray flare detected by the RXTE ASM (see Fig. 1). We also show previous non-simultaneous multiwavelength data. Since 3C 454.3 is a bright, frequently monitored CGRO source, we reported its MeV-GeV spectrum observed by COMPTEL and EGRET between 1991 and 1994 (Zhang et al. 2005; Hartman et al. 1999). The comparison between the INTEGRAL spectrum of May 2005 and the historical keV-to-MeV data suggests that the variability at the softer energies may be more pronounced than at the harder energies on a time scale of years. Since the optical flux exhibits a large variability amplitude on the same time scale, this may indicate that the optical and soft X-ray variations are better correlated than those at optical and hard X-ray frequencies. In our INTEGRAL observation we have noted this trend also on shorter time scales (Fig. 2). The historical SED has been fitted with synchrotron radiation in a homogeneous region, and IC scattering off synchrotron photons and external (broad line region) photons (Ghisellini, Celotti, & Costamante 2002). The parameters of this fit are similar to the ones of Tavecchio et al. (2002). The “external Compton” component dominates over the synchrotron self-Compton radiation, and keV-to-GeV rays are produced efficiently. Using the same model, the May 2005 SED is reproduced by a brighter synchrotron source at mm-to-UV frequencies, and by self-Compton scattering outside of the broad line region, at higher energies. This component exhibits two maxima, corresponding to the first (INTEGRAL band) and second order (predicted at 1 Gev) of IC scattering (Fig. 3). For the May 2005 state we assume a size of the emitting region of cm, injected luminosity of erg s-1, magnetic field of 3.4 G, bulk Lorentz factor of 15, jet viewing angle of , and a double power-law distribution of the relativistic electrons with a , , and indices -2 and -4.4 below and above , respectively. More details on this model solution, that represents an optimal guess of physical parameters based on the observations, rather than a best fit to the data, will be presented by Ghisellini (in prep.).
The INTEGRAL detection of 3C 454.3 is in line with the finding that all blazars detected so far by INTEGRAL are also EGRET sources. INTEGRAL and AGILE observations of EGRET blazars in outburst will allow us to locate accurately the peak energy of the IC component and to study in detail its variability and the interplay between the emission components.
Acknowledgements.
We thank the staff at the INTEGRAL Mission Operation Center, and particularly P. Kretschmar, for providing assistance in scheduling promptly these observations during non-standard satellite conditions; the staff at the INTEGRAL Science Data Center, particularly D. Eckert and N. Mowlavi, for data acquisition; A.D. Garau for advice in the OMC data analysis, and the referee, M. Gierlinski, for useful comments. We acknowledge the EU funding under contract HPRCN-CT-2002-00321 (ENIGMA network). LF acknowledges the Italian Space Agency for financial support. RH acknowledges the ESA PECS project 98023.References
- Beckmann et al. (2006) Beckmann, V., Gehrels, N., Shrader, C.R., & Soldi, S. 2006, ApJ, in press (astro-ph/0510530)
- Bersanelli et al. (1991) Bersanelli, M., Bouchet, P., & Falomo, R. 1991, A&A, 252, 854
- Cadolle Bel et al. (2006) Cadolle Bel, M., Sizun, P., Goldwurm, A., et al. 2006, A&A, 446, 591
- Cardelli, Clayton, & Mathis (1989) Cardelli, J. A., Clayton, G. C. & Mathis, J. S. 1989, ApJ, 345, 245
- Collmar et al. (2004) Collmar, W., Böttcher, M., Burwitz, V., et al. 2004, Proceedings of the 5th INTEGRAL Workshop, ESA Publication Division, SP-552, Ed. B. Battrick, p. 559 (astro-ph/0410302)
- Comastri et al. (1997) Comastri, A., Fossati, G., Ghisellini, G., & Molendi, S. 1997, ApJ, 480, 534
- (7) Courvoisier, T. J.-L., Walter, R., Beckmann, V., et al. 2003a, A&A, 411, L53
- (8) Courvoisier, T. J.-L., Beckmann, V., Bourban, G., et al. 2003b, A&A, 411, L343
- De Rosa et al. (2005) De Rosa, A., Piro, L., Tramacere, A., et al. 2005, A&A, 438, 121
- Di Cocco et al. (2003) Di Cocco, G., Caroli, E., Celesti, E., et al. 2003, A&A, 411, L189
- Dickey & Lockman (1990) Dickey, J.M., & Lockman, F.J. 1990, ARA&A, 28, 215
- Diehl et al. (2003) Diehl, R., Baby, N., Beckmann, V., et al. 2003, A&A, 411, L117
- Foschini et al. (2005) Foschini, L., Di Cocco, G., Malaguti, G., et al. 2005, ATel N. 497
- Fuhrmann al. (2006) Fuhrmann, L., Cucchiara, A., Marchili, N., et al. 2006, A&A, 445, L1
- Fukugita et al. (1995) Fukugita, M., Shimasaku, K., & Ichikawa, T. 1995, PASP, 107, 945
- Ghisellini et al. (1998) Ghisellini, G., Celotti, A., Fossati, G., Maraschi, L., & Comastri, A. 1998, MNRAS, 301, 451
- Ghisellini et al. (2002) Ghisellini, G., Celotti, A., Costamante, L. 2002, A&A, 386, 833
- Giommi et al. (2006) Giommi, P., Blustin, A.J., Capalbi, M., et al. 2006, A&A, submitted
- Goldwurm et al. (2003) Goldwurm, A., David, P., Foschini, L., et al., 2003, A&A 411, L223
- Haas et al. (2004) Haas, M., Müller, S.A.H., Bertoldi, F., et al. 2004, A&A, 424, 531
- Hartman et al. (1999) Hartman, R.C., Bertsch, D.L., Bloom, S.D., et al. 1999, ApJS, 123, 79
- Kalberla et al. (2005) Kalberla, P.M.W., Burton, W.B., Hartmann, D., Arnal, E.M., Bajaja, E., Morras, R., & Pöppel, W.G.L. 2005, A&A, 440, 775
- Lebrun et al. (2003) Lebrun, F., Leray, J.P., Lavocat, P., et al., 2003, A&A 411, L141
- Lobanov et al. (2000) Lobanov, A.P., Krichbaum, T.P., Graham, D.A., et al. 2000, A&A, 364, 391
- Lubiński et al. (2005) Lubiński, P., Dubath, P., & Paltani, S. 2005 INTEGRAL Cross-Calibration Status for OSA 5.1, http://isdc.unige.ch/?Support+documents
- Lund et al. (2003) Lund, N., Budtz-Jørgensen, G., Westergaard, N.J., et al. 2003, A&A, 411, L231
- Marshall et al. (2005) Marshall, H.L., Schwartz, D.A., Lovell, J.E.J., et al. 2005, ApJS, 156, 13
- Mas-Hesse et al. (2003) Mas-Hesse, J.M., Giménez, A., Culhane, L., et al. 2003, A&A, 411, L261
- McNaron-Brown et al. (1995) McNaron-Brown, K., Johnson, W.N., Jung, G.V., et al. 1995, ApJ, 451, 575
- Mukherjee et al. (1997) Mukherjee, R., Bertsch, D.L., Bloom, S.D., et al. 1997, ApJ, 490, 116
- (31) Pian, E., Foschini, L., Beckmann, V., et al. 2005a, A&A, 429, 427
- (32) Pian, E., Falomo, R., & Treves, A. 2005b, MNRAS, 361, 919
- Raiteri et al. (1998) Raiteri, C.M., Villata, M., Lanteri, L., Cavallone, M., & Sobrito, G. 1998, A&AS, 130, 495
- Remillard (2005) Remillard, R. 2005, ATel N. 484
- Schlegel et al. (1998) Schlegel, D.J., Finkbeiner, D.P., & Davis, M. 1998, ApJ, 500, 525
- Tavecchio et al. (2000) Tavecchio, F., Maraschi, L., Ghisellini, G., et al. 2000, ApJ, 543, 535
- Tavecchio et al. (2002) Tavecchio, F., Maraschi, L., Ghisellini, G., et al. 2002, ApJ, 575, 137
- Trushkin et al. (2005) Trushkin, S.A., Harinov, M.A., & Michailov, A.G. 2005, ATel N. 488
- Ubertini et al. (2003) Ubertini, P., Lebrun, F., Di Cocco, G., et al. 2003, A&A, 411, L131
- Ulrich et al. (1997) Ulrich, M.-H., Maraschi, L., Urry, C.M. 1997, ARA&A, 35, 445
- Urry & Padovani (1995) Urry, C.M., & Padovani, P. 1995, PASP, 107, 803
- Vedrenne et al. (2003) Vedrenne, G., Roques, J.-P., Schönfelder, V., et al. 2003, A&A, 411, L63
- Villata et al. (2006) Villata, M., Raiteri, C.M., Balonek, T.J., et al. 2006, A&A, submitted
- Westergaard et al. (2003) Westergaard, N.J, Kretschmar, P., Oxborrow, C.A., et al. 2003, A&A, 411, L257
- Winkler et al. (2003) Winkler, C., Courvoisier, T.J.-L., Di Cocco, G., et al. 2003, A&A, 411, L1
- Worrall & Wilkes (1990) Worrall, D.M., & Wilkes, B.J. 1990, ApJ, 360, 396
- Zhang et al. (2005) Zhang, S., Collmar, W., & Schönfelder, V. 2005, A&A, 444, 767