TeV Gamma-Ray Observations of the Perseus and Abell 2029 Galaxy Clusters
Abstract
Galaxy clusters might be sources of TeV gamma rays emitted by high-energy protons and electrons accelerated by large scale structure formation shocks, galactic winds, or active galactic nuclei. Furthermore, gamma rays may be produced in dark matter particle annihilation processes at the cluster cores. We report on observations of the galaxy clusters Perseus and Abell 2029 using the 10 m Whipple Cherenkov telescope during the 2003-2004 and 2004-2005 observing seasons. We apply a two-dimensional analysis technique to scrutinize the clusters for TeV emission. In this paper we first determine flux upper limits on TeV gamma-ray emission from point sources within the clusters. Second, we derive upper limits on the extended cluster emission. We subsequently compare the flux upper limits with EGRET upper limits at 100 MeV and theoretical models. Assuming that the gamma-ray surface brightness profile mimics that of the thermal X-ray emission and that the spectrum of cluster cosmic rays extends all the way from thermal energies to multi-TeV energies with a differential spectral index of -2.1, our results imply that the cosmic ray proton energy density is less than 7.9% of the thermal energy density for the Perseus cluster.
1 Introduction
As our Universe evolves and structure forms on increasingly larger scales, the gravitational energy of matter is constantly converted into random kinetic energy of cosmic gas. In galaxy clusters, collisionless structure formation shocks are thought to be the main agents responsible for heating the inter-cluster medium (ICM) to temperatures of T10 keV. Through this and other processes, gravitational energy is converted into the random kinetic energy of non-thermal baryons (protons) and leptons (electrons). Galactic winds (Völk & Atoyan, 1999) and re-acceleration of mildly relativistic particles injected into the ICM by powerful cluster members (Enßlin & Biermann, 1998) may accelerate additional particles to non-thermal energies. Using galactic cosmic rays (CR) as a yard stick, one expects that the energy density of cosmic ray protons (CRp) dominates over that of cosmic ray electrons (CRe) by approximately two orders of magnitude, and may be comparable to that of thermal particles and the ICM magnetic field. CRp can diffusively escape clusters only on time scales much longer than the Hubble time. Therefore they accumulate over the entire formation history (Völk & Atoyan, 1999). CRe lose their energy by emitting synchrotron, Bremsstrahlung, and inverse Compton emission on much shorter time scales. For ICM magnetic fields on the order of G, synchrotron and inverse Compton emission losses alone cool CRe of energy TeV on a timescale
| (1) |
where is the Thomson cross section, and G; for the clusters considered here, and years.
There is good observational evidence nonthermal electrons in galaxy clusters. For a number of clusters, diffuse synchrotron radio halos and/or radio relic sources have been detected (Giovannini et al., 1993, 1999; Giovannini & Feretti, 2000; Kempner & Sarazin, 2001; Feretti, 2003). For some clusters, an excess of Extreme Ultra-Violet (EUV) and/or hard X-ray radiation over that expected from the thermal X-ray emitting ICM has been observed (Bowyer & Berghöfer, 1998; Lieu et al., 1999; Rephaeli et al., 1999; Fusco-Femiano et al., 2004). The excess radiation originates most likely as inverse Compton emission from CRe scattering cosmic microwave background photons (Lieu et al., 1996; Enßlin & Biermann, 1998; Blasi & Colafrancesco, 1999; Fusco-Femiano et al., 1999).
The detection of gamma-ray emission from galaxy clusters would make it possible to measure the energy density of non-thermal particles. The density and energy density of the thermal ICM can be derived from imaging-spectroscopy observations made with such satellites as Chandra and XMM-Newton (Krawczynski, 2002; Markevitch et al., 1998; Donahue et al., 2004). The density and energy spectra of the non-thermal protons could be computed from the detected gamma-ray emission once the density of the thermal ICM is known (Pfrommer & Enßlin, 2004). Gamma rays can originate as inverse Compton and Bremsstrahlung emission from CRe and as emission from hadronic interactions of CRp with thermal target material. If successful measurements of the gamma-ray fluxes from several galaxy clusters were obtained, one could explore the correlation of the CRp luminosity with cluster mass, temperature, and redshift, and draw conclusions about how the clusters grew to their observed size. If CRp indeed contribute noticeably to the pressure of the ICM, the measurements of the CRp energy density would allow improvement on the estimates of the cluster mass based on X-ray data, and thus improve estimates of the universal baryon fraction. If CR provide pressure support to the ICM, they would inhibit star formation to some extent as they do not cool radiatively like the thermal X-ray emitting gas. Furthermore, low energy cosmic ray ions might provide a source of heating the thermal gas (Rephaeli, 1977).
In addition to a CR origin, annihilating dark matter may also emit gamma rays. The intensity of the radiation depends on the nature of dark matter, the annihilation cross sections, and the dark matter density profile close to the core of the cluster, e.g. Bergström et al. (1998). While MeV observations are ideally suited for detecting the emission from the bulk of the non-thermal particles, TeV gamma-ray observations of cluster energy spectra and radial emission profiles would allow us to disentangle the various components that contribute to the emission.
At MeV energies, various authors have searched for cluster emission based on the data from the EGRET (Energetic Gamma Ray Experiment Telescope) detector on board the Compton Gamma-Ray Observatory. Three studies revealed evidence at a significance level of approximately three standard deviations: Colafrancesco (2001) and Kawasaki & Totani (2002) reported an association between Abell clusters and unidentified gamma-ray point sources from the third catalog of the EGRET experiment; Scharf & Mukherjee (2002) found gamma-ray emission from Abell clusters by stacking the EGRET data of 447 galaxy clusters. However, analyzing the data from 58 galaxy clusters, Reimer et al. (2003) do not confirm a detection, and give an upper limit that is inconsistent with the mean flux reported by Scharf & Mukherjee (2002). In the TeV energy range, Fegan et al. (2005) reported marginal evidence for emission from Abell 1758 in the field of view of 3EG J1337 +5029.
In this paper we report on a search for TeV gamma-ray emission from the Perseus and Abell 2029 galaxy clusters with the Whipple 10 m Cherenkov telescope. We selected both clusters based on their proximity and high masses: Perseus ( 0.0179) is at a distance of 75 Mpc from us and has a total mass of 4 M⊙; Abell 2029 ( 0.0775) is 300 Mpc away from us and its total mass has been estimated to be 5 M⊙ (Girardi et al., 1998).
The search described below assumes that the high energy (HE) surface brightness mimics the X-ray surface brightness, and focuses on the detection of gamma rays from within 0.8 degrees from the cluster center. There are several possibilities relating the thermal and non-thermal particles within clusters. From general considerations, Völk & Atoyan (1999) assume that the non-thermal particles carry a certain fraction of the energy density of the ICM. One of the aims of VHE astronomy is to constrain this fraction. Indeed, we do know the CRp energy density in the Interstellar Medium (ISM) of the Milky Way galaxy. In this case it turns out that the CRp energy density is comparable to the energy density of the thermal ISM, the energy density of the interstellar magnetic field and the energy density of star light. If non-thermal particles in clusters indeed carry a certain fraction of the energy density of the ICM, the HE surface brightness would mimic that of the thermal X-ray emission. In another line of argument, one may assume that powerful cluster members (i.e. radio sources) are the dominant source of non-thermal particles in the ICM; also in this case we would expect that CRp accumulate at the cluster cores where usually the most powerful radio galaxies are found (Pfrommer & Enßlin, 2004). Ryu et al. (2003); Kang & Jones (2005) performed numerical calculations to estimate the energy density of CRp by large scale structure formation shocks. The simulations indicate that strong shocks form preferentially in the cluster periphery. Accordingly, most CRp would be accelerated in the outskirts of the clusters and would only slowly be transported to the cluster core by bulk plasma motion (e.g. following cluster merger). The main conclusion of this discussion is that the CRp distribution in galaxy clusters is uncertain as long as we have not mapped them in the light of HE photons. However, independent of the lateral profile of CRp acceleration, we expect that the emission profile will be centrally peaked, as the HE emission results from inelastic collisions of the CRps with the centrally peaked thermal target material.
The sensitivity of the Whipple 10 m telescopes drops for angular distances exceeding 0.8 degree from the center of the field of view. For the Perseus cluster, the temperature map of Churazov et al. (2003) shows a high-temperature region at about 0.25 degree from the cluster center. As the high-temperature region might be associated with shocks, this region might emit VHE emission. Our search for VHE emission does cover this region with high sensitivity. However, we did not perfom a specialized search for merger related emission.
In the case of the more distant cluster A2029, our search region of 0.8 degree radius covers a physical region of 4.2 Mpc radius. Thus, our search includes all the cluster emission, independent of where in the cluster it originates.
The rest of the paper is organized as follows: we describe the Whipple 10 m telescope, the observations, data cleaning procedures, and the data analysis methods in Section 2. The main results of this study are a search for point source emission from localized sources in the clusters and a search for diffuse emission from the ICM. We present these results in Section 3, and discuss them in Section 4. Reported uncertainties are one standard deviation and upper limits are given at the 90% confidence level, unless otherwise stated. In the rest of the paper, we assume Hubble’s constant km sec-1 Mpc-1, the dark energy density and the total matter density .
2 Data and Analysis
2.1 Instrumentation and Data Sets
TeV observations were taken on clear moonless nights with the Whipple 10 m Cherenkov telescope located on Mount Hopkins, Arizona at an altitude of 2300 meters above sea level. This telescope detects high energy photons by imaging the flashes of Cherenkov light emitted by secondary particles in gamma ray induced air showers. The Whipple 10 m segmented mirror focuses the faint UV/blue Cherenkov flashes onto a camera consisting of photomultiplier tube pixels. The Whipple telescope, including the current camera, have been described elsewhere (Finley et al., 2001).
We observed the Perseus cluster between August 16, 2004 and February 5, 2005 (UT). Data were taken as pairs of 28 minute runs. An ON run pointed at the source was followed by an OFF run at the same azimuth and elevation but offset 7.50∘ (30 minutes) in right ascension for background subtraction. Removing runs with low raw rates (indicative of poor sky conditions) and mismatched ON/OFF pairs (indicative of differing sky conditions between ON and OFF runs) resulted in 29 ON/OFF pairs for analysis. The cluster Abell 2029 was observed between March 7, 2003 and May 5, 2003 (UT) resulting in 14 ON/OFF pairs. A number of observations of the Crab Nebula (a “Standard Candle” in TeV gamma-ray astronomy) were taken to determine the detection efficiency and angular resolution for various points on the camera. Figure 1 illustrates the cosmic ray rates of each run versus the zenith angle for both the Perseus and Crab observations. In this analysis, we only use those runs that deviate by less than 10% from the expected rate. Table 1 details the duration and observing season of the various data sets.
2.2 Standard Analysis
The data were analyzed using the standard 2nd-moment-parameterization technique (Hillas, 1985). We identify gamma-ray events and suppress background cosmic ray events by applying gamma-ray selection criteria (EZCuts2004, see Kosack (2005)), designed to be independent of zenith angle and energy and well suited for the analysis of extended sources. The 2D arrival direction of each gamma-ray event was calculated from the orientation and elongation of the Cherenkov light distribution in the camera (Buckley et al., 1998). We estimate that the mean energy threshold for the Whipple 10 m to be approximately 400 GeV (Finley et al., 2001). More detailed descriptions of Whipple observing modes and analysis procedures have been given by Weekes (1996), Punch & Fegan (1991), and Reynolds et al. (1993).
2.3 Cluster Specific Analysis
In this section we describe the specific analysis techniques applied to the clusters, including the method used to search for point sources within each cluster. Based upon the expected lateral emission profiles, we then discuss the examination of the cluster for diffuse emission.
In order to search for point sources within the field-of-view, the resolution and detection efficiency need to be known to good accuracy at all locations on the camera. Every search for extended emission should be preceded by a search for point sources. If there are point sources, the corresponding sky regions should be excluded from the search for extended emission. We used an empirical method based upon data from the Crab Nebula that were taken during the same months as the Perseus and Abell 2029 data. The background-subtracted Crab data were binned by the square of the distance of the reconstructed shower direction from the location of the Crab Nebula (so as to eliminate any solid angle dependence) and fitted with an exponential. These fits gave us a direct measurement of the resolution of the camera for a point source at different locations within the field-of-view. From these same data we determined an optimal angular cut based on the integral number of excess and background counts as a function of angular distance from the source location. By calculating the gamma-ray rate at the different offsets, we also determined how the efficiency of the camera falls off towards the edges. This empirical method was compared to Monte Carlo simulations of centered and offset data. The Monte Carlo code111http://www.physics.utah.edu/gammaray/GrISU/ simulates atmospheric Cherenkov showers and calculates the response of the Whipple detector. The simulated data have the same format as the experimental data and were analyzed using the same methods as those applied to the real data. We produced a simulated shower set with a differential spectral index of -2.5 and fed this through the detector simulations for different source offsets and compared this with observations. Figure 2 shows the optimal angular cut at the three different offsets. The optimal cut was used to determine the total number of events originating from a specific point in the field-of-view. This cut increases from 0.2∘ at the camera center to 0.35∘ at a 0.8∘ source offset due to the poorer angular resolution towards the camera edge. Figure 3 shows the normalized gamma-ray rate for the source located at the various offsets using the cut from Figure 2. Compared to the center of the field-of-view, the rate decreases by 40% at 0.8∘ from the center due to the loss in detection efficiency. The simulated data rates and optimized cuts agree well with the experimental results. Since the efficiency of the detector falls off above a radius of 0.8∘, we only use the central 1.6∘ diameter region. If TeV emission mimics the thermal surface brightness we would see almost all of the emission expected. Unfortunately, our search has only very limited sensitivity beyond the central 0.8∘ from the center of the field of view.
We then searched over the central 0.8∘ radius region of the field-of-view of the camera for point sources within the clusters. At every point in the field-of-view, we applied the optimal cut as specified and calculated the excess or deficit of candidate gamma rays from the data. We normalized the excess or deficit counts to the experimentally measured Crab rates from the same observing season. We then used this flux and its error to calculate a Bayesian upper limit on the flux (Helene, 1983), taking into account the statistical error for the Crab event rate.
To search for extended emission from the Perseus cluster, we assumed that the TeV gamma-ray surface brightness mimics that of the thermal X-ray emission seen by Chandra (Sanders et al., 2005) and BeppoSAX (Nevalainen et al., 2004) which arises from interactions of the thermal protons in the cluster. The X-ray surface brightness can be modeled as a double- profile:
| (2) |
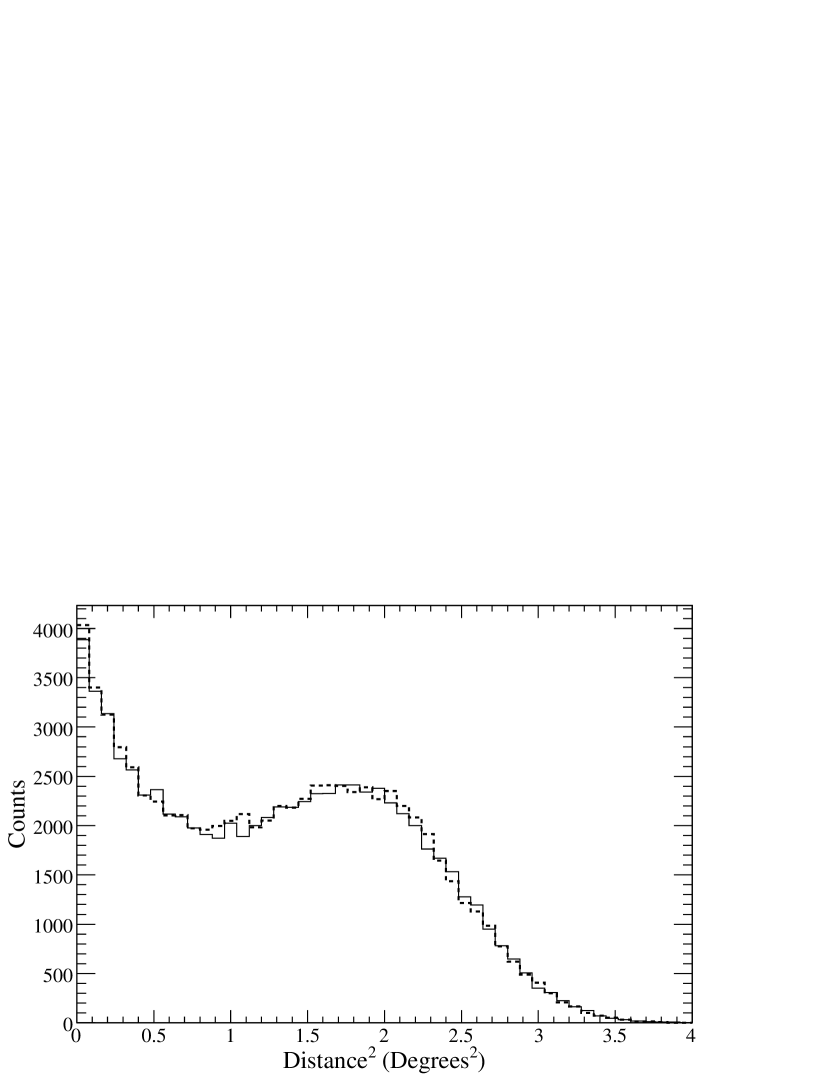
where is the surface brightness and and are isobaric model parameters (Pfrommer & Enßlin, 2004). The values of these parameters, based on results from Churazov et al. (2003) and Struble & Rood (1999), can be found in Table 2. The emission will continue out to the accretion shock which is expected to occur at 2.2∘ from the cluster center. Assuming the double- profile, we estimate that our angular cut of 0.3∘ from the cluster center optimizes the sensitivity of the search for cluster emission. A fraction of 95% of the total cluster emission comes from within 0.3∘ from the cluster. Figure 4 shows the ON and OFF data after analysis and cleaning plotted versus the distance from the center of the field-of-view squared. There is an excellent match between the ON and OFF data and no obvious excess out to the edge of the field-of-view.
The X-ray surface brightness is better modeled in the case of Abell 2029 by a single- King profile (King, 1972) given by
| (3) |
The model parameters are found in Table 2 and are from Jones & Forman (1984) based upon observations made with the Einstein observatory. We chose the Einstein observations over more recent observations by Chandra due to the larger field-of-view of Einstein. For this cluster, the X-ray emission continues out to 1.0∘ from the center of the cluster, and 96% of the emission comes from the central 0.3∘.
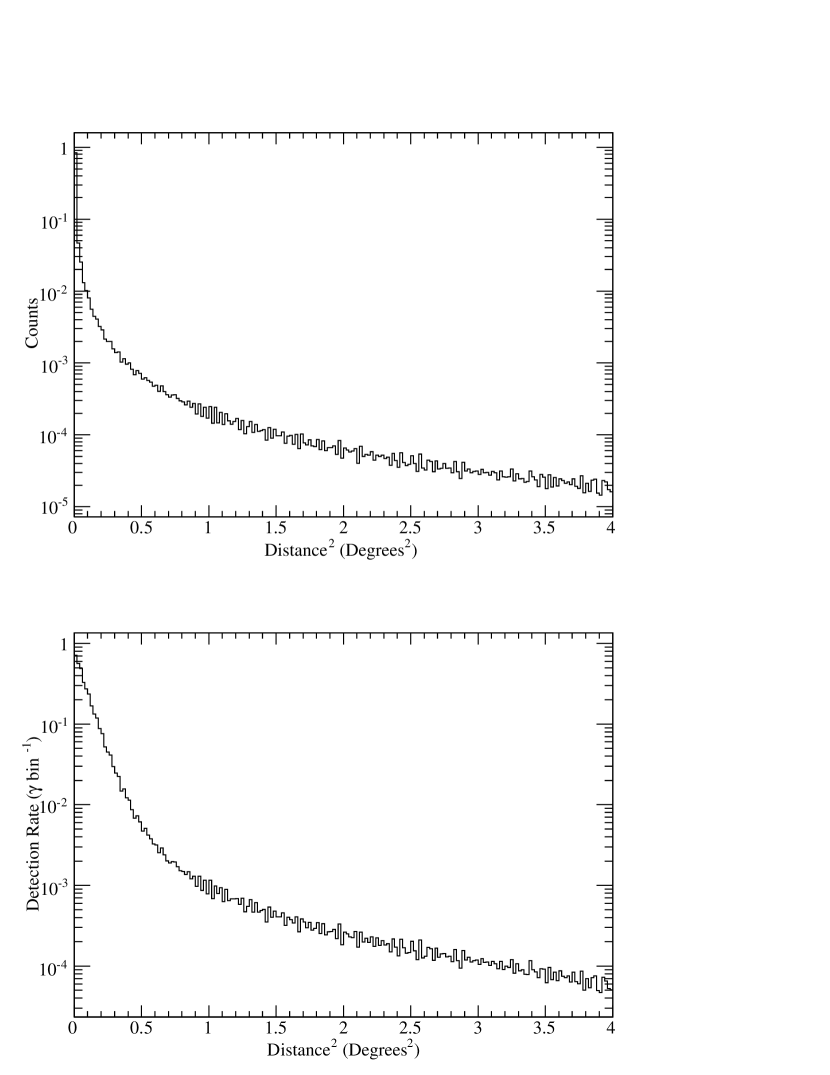
We derived quantitative upper limits by normalizing these profiles over the field-of-view of the camera. We then convolved the expected emission by the point spread function of the Whipple telescope, multiplied by the offset-dependent Crab detection rate. The method generates a map of the expected detection rate, assuming that the entire cluster produces the same TeV flux as the Crab Nebula. Figure 5 shows the expected emission based on the double- profile for the Perseus cluster at various stages in the analysis process. The rate map and actual excess were integrated over the inner 0.3∘ and these two values were used to determine the upper limit on the diffuse TeV flux from the entire cluster in units of the Crab flux. We also computed upper limits by integrating counts over the most sensitive 0.8∘ region of the camera.
3 Results
For the Perseus cluster, Figure 4 shows that there is no excess detected in the field-of-view of the camera. Using a radial cut of 0.3∘, our analysis results in a significance of -2.1 standard deviations and an upper limit on the diffuse emission of 13% of the Crab flux ( ergs cm-2 s-1). Figure 6 is a map of upper limits on the point source emission. All of the upper limits are below 0.45 Crab, and most (80%) are below 0.05 Crab. Table 3 lists the upper limits at the locations of the three radio galaxies associated with spectroscopically identified cluster galaxies. The upper limit on the TeV emission from the central galaxy, NGC 1275, is 4.0% of the Crab flux ( ergs cm-2 s-1).
Abell 2029 does not show any evidence for point source or extended emission. Figure 7 shows a map of upper limits on the point source emission. All of the upper limits are below 1.1 Crab with the majority (80%) below 0.1 Crab. Table 3 lists an upper limit of 13% of the Crab flux ( ergs cm-2 s-1) for the central radio galaxy. Within 0.3∘ from the camera center, we find a deficit of 13 counts with a statistical significance of -0.15 standard deviations. Assuming the emission profile of Abell 2029 follows Eq. (3), we compute an upper limit on the diffuse emission of 14% of the Crab flux ( ergs cm-2 s-1) . Table 4 gives a summary of the various upper limits for each cluster. All upper limits discussed in this paper have been computed for the gamma-ray emission from within 0.2∘, 0.3∘ and 0.8∘ angular distance from the cluster core. Flux upper limits have been scaled based upon the assumed spectral shape after absorption.
4 Interpretation and Discussion
Figure 8 shows our upper limits on TeV emission from the two clusters and compares them to previous upper limits from EGRET (Reimer et al., 2003), with the results of model calculations. The lines show models of the CRp induced gamma-ray emission normalized to the EGRET upper limits, assuming a CRp spectrum with differential spectral index of -2.1 (Pfrommer & Enßlin, 2004). This index is a reasonable choice of the source spectrum because galaxy clusters are not “leaky” and retain all CRp, unlike our Galaxy where leakage of high energy CRp is thought to steepen the source spectrum of -2.1 to the observed value of -2.7. If we assume a spectral index of -2.3, the Whipple and EGRET upper limits are equivalent. Also shown on this plot (as a thinner extension to the main lines) is a prediction of the emission modified by extragalactic extinction owing to pair production processes of TeV photons with photons of the cosmic infrared background (). The extinction calculation assumes the phenomenological background model (“P0.45”) of Aharonian et al. (2005). Extragalactic extinction has only a minor impact on the flux predictions for Perseus owing to its low redshift. However, Abell 2029 is significantly farther away and extinction does influence the observed spectrum which we take into consideration when calculating upper limits. The Whipple upper limits (this publication) lie by factors of 4.6 (Perseus) and 4.2 (Abell 2029) below the model extrapolations. If the CRp spectrum indeed follows a power law distribution with differential spectral index of -2.1 up to multi-TeV energies, the calculations of Pfrommer & Enßlin (2004) together with our results imply that the non-thermal CRp energy density is less than 7.9% of the thermal energy density for the Perseus cluster.
The lower lines in Figure 8 show the expected emission from dark matter annihilations derived under the optimistic assumption that the TeV emission from the galactic center (Aharonian et al., 2004; Kosack et al., 2004; Tsuchiya et al., 2004; Horns, 2005) originates entirely from such annihilations. We scale the gamma-ray flux from the galactic center by computing the expected annihilation signal for the Galactic Center, the Perseus cluster and Abell 2029 from a Navarro, Frenk and White (NFW) halo (Bergström et al., 1998) with , virial radius kpc, a halo mass of , a distance of 75 Mpc and an NFW concentration parameter of . We find that the best sensitivity (signal to background noise ratio) is obtained if we use the same radial cut, , as for the search for point sources (reducing background from misidentified CR air showers). The expected dark matter signal lies two orders of magnitude or more below our upper limits. We will not see dark matter emission even if all of the TeV galactic center emission is dark matter in origin. Thus, we do not provide any new constraints on TeV galactic center emission. Secondly, our calculations show that the most promising region to observe dark matter is the galactic center.
Though we did not detect significant TeV gamma rays from these two clusters of galaxies, we are able to determine two different types of upper limits on the emission: from point sources within the cluster and upper limits on the extended emission. Long duration observations with the more sensitive TeV telescopes VERITAS, HESS, MAGIC and CANGAROO III and the GeV telescope GLAST will be critical for determining whether cluster are emitters of high energy gamma rays.
Acknowledgments: This research is supported by grants from the U.S. Department of Energy, the U.S. National Science Foundation, the Smithsonian Institution, by NSERC in Canada, by Science Foundation Ireland, and by PPARC in the UK. H.K. acknowledges the support of the DOE in the framework of the Outstanding Junior Investigator Award. J.S.P. acknowledges the support by the Dean of the Arts and Sciences Graduate School of Washington University in St. Louis through a dissertation fellowship. We would also like to thank Jonathan Katz for his comments and suggestions.
References
- Aharonian et al. (2004) Aharonian, F., Akhperjanian, A. G., Aye, K.-M., Bazer-Bachi, A. R., Beilicke, M., Benbow, W., Berge, D., Berghaus, P., Bernlöhr, K., Bolz, O., Boisson, C., Borgmeier, C., Breitling, F., Brown, A. M., Bussons Gordo, J., Chadwick, P. M., Chitnis, V. R., Chounet, L.-M., Cornils, R., Costamante, L., Degrange, B., Djannati-Ataï, A., O’C. Drury, L., Ergin, T., Espigat, P., Feinstein, F., Fleury, P., Fontaine, G., Funk, S., Gallant, Y., Giebels, B., Gillessen, S., Goret, P., Guy, J., Hadjichristidis, C., Hauser, M., Heinzelmann, G., Henri, G., Hermann, G., Hinton, J. A., Hofmann, W., Holleran, M., Horns, D., de Jager, O. C., Jung, I., Khélifi, B., Komin, N., Konopelko, A., Latham, I. J., Le Gallou, R., Lemoine, M., Lemière, A., Leroy, N., Lohse, T., Marcowith, A., Masterson, C., McComb, T. J. L., de Naurois, M., Nolan, S. J., Noutsos, A., Orford, K. J., Osborne, J. L., Ouchrif, M., Panter, M., Pelletier, G., Pita, S., Pohl, M., Pühlhofer, G., Punch, M., Raubenheimer, B. C., Raue, M., Raux, J., Rayner, S. M., Redondo, I., Reimer, A., Reimer, O., Ripken, J., Rivoal, M., Rob, L., Rolland, L., Rowell, G., Sahakian, V., Saugé, L., Schlenker, S., Schlickeiser, R., Schuster, C., Schwanke, U., Siewert, M., Sol, H., Steenkamp, R., Stegmann, C., Tavernet, J.-P., Théoret, C. G., Tluczykont, M., van der Walt, D. J., Vasileiadis, G., Vincent, P., Visser, B., Völk, H. J., & Wagner, S. J. 2004, A&A, 425, L13
- Aharonian et al. (2005) Aharonian, F., Akhperjanian, A. G., Bazer-Bachi, A. R., Beilicke, M., Benbow, W., Berge, D., Bernlöhr, K., Boisson, C., Bolz, O., Borrel, V., Braun, I., Breitling, F., Brown, A. M., Chadwick, P. M., Chounet, L.-M., Cornils, R., Costamante, L., Degrange, B., Dickinson, H. J., Djannati-Ataï, A., O’C. Drury, L., Dubus, G., Emmanoulopoulos, D., Espigat, P., Feinstein, F., Fontaine, G., Fuchs, Y., Funk, S., Gallant, Y. A., Giebels, B., Gillessen, S., Glicenstein, J. F., Goret, P., Hadjichristidis, C., Hauser, M., Heinzelmann, G., Henri, G., Hermann, G., Hinton, J. A., Hofmann, W., Holleran, M., Horns, D., Jacholkowska, A., de Jager, O. C., Khélifi, B., Komin, N., Konopelko, A., Latham, I. J., Le Gallou, R., Lemière, A., Lemoine-Goumard, M., Leroy, N., Lohse, T., Martin, J. M., Martineau-Huynh, O., Marcowith, A., Masterson, C., McComb, T. J. L., de Naurois, M., Nolan, S. J., Noutsos, A., Orford, K. J., Osborne, J. L., Ouchrif, M., Panter, M., Pelletier, G., Pita, S., Pühlhofer, G., Punch, M., Raubenheimer, B. C., Raue, M., Raux, J., Rayner, S. M., Reimer, A., Reimer, O., Ripken, J., Rob, L., Rolland, L., Rowell, G., Sahakian, V., Saugé, L., Schlenker, S., Schlickeiser, R., Schuster, C., Schwanke, U., Siewert, M., Sol, H., Spangler, D., Steenkamp, R., Stegmann, C., Tavernet, J.-P., Terrier, R., Théoret, C. G., Tluczykont, M., Vasileiadis, G., Venter, C., Vincent, P., Völk, H. J., & Wagner, S. J. 2005, astro-ph/0508073
- Bergström et al. (1998) Bergström, L., Ullio, P., & Buckley, J. H. 1998, Astroparticle Physics, 9, 137
- Blasi & Colafrancesco (1999) Blasi, P. & Colafrancesco, S. 1999, Astroparticle Physics, 12, 169
- Bowyer & Berghöfer (1998) Bowyer, S. & Berghöfer, T. W. 1998, ApJ, 506, 502
- Buckley et al. (1998) Buckley, J. H., Akerlof, C. W., Carter-Lewis, D. A., Catanese, M., Cawley, M. F., Connaughton, V., Fegan, D. J., Finley, J. P., Gaidos, J. A., Hillas, A. M., Krennrich, F., Lamb, R. C., Lessard, R. W., McEnery, J. E., Mohanty, G., Quinn, J., Rodgers, A. J., Rose, H. J., Rovero, A. C., Schubnell, M. S., Sembroski, G., Srinivasan, R., Weekes, T. C., & Zweerink, J. 1998, A&A, 329, 639
- Churazov et al. (2003) Churazov, E., Forman, W., Jones, C., & Böhringer, H. 2003, ApJ, 590, 225
- Colafrancesco (2001) Colafrancesco, S. 2001, in AIP Conf. Proc. 587: Gamma 2001: Gamma-Ray Astrophysics, 427
- Condon et al. (1998) Condon, J. J., Cotton, W. D., Greisen, E. W., Yin, Q. F., Perley, R. A., Taylor, G. B., & Broderick, J. J. 1998, AJ, 115, 1693
- Donahue et al. (2004) Donahue, M. E., Voit, G. M., & Cavagnolo, K. 2004, American Astronomical Society Meeting Abstracts, 205
- Enßlin & Biermann (1998) Enßlin, T. A. & Biermann, P. L. 1998, A&A, 330, 90
- Fegan et al. (2005) Fegan, S. J., Badran, H. M., Bond, I. H., Boyle, P. J., Bradbury, S. M., Buckley, J. H., Carter-Lewis, D. A., Catanese, M., Celik, O., Cui, W., Daniel, M., D’Vali, M., de la Calle Perez, I., Duke, C., Falcone, A., Fegan, D. J., Finley, J. P., Fortson, L. F., Gaidos, J. A., Gammell, S., Gibbs, K., Gillanders, G. H., Grube, J., Hall, J., Hall, T. A., Hanna, D., Hillas, A. M., Holder, J., Horan, D., Jarvis, A., Jordan, M., Kenny, G. E., Kertzman, M., Kieda, D., Kildea, J., Knapp, J., Kosack, K., Krawczynski, H., Krennrich, F., Lang, M. J., Le Bohec, S., Lessard, R. W., Linton, E., Lloyd-Evans, J., Milovanovic, A., McEnery, J., Moriarty, P., Mukherjee, R., Muller, D., Nagai, T., Nolan, S., Ong, R. A., Pallassini, R., Petry, D., Power-Mooney, B., Quinn, J., Quinn, M., Ragan, K., Rebillot, P., Reynolds, P. T., Rose, H. J., Schroedter, M., Sembroski, G. H., Swordy, S. P., Syson, A., Vassiliev, V. V., Wakely, S. P., Walker, G., Weekes, T. C., & Zweerink, J. 2005, ApJ, 624, 638
- Feretti (2003) Feretti, L. 2003, in Texas in Tuscany. XXI Symposium on Relativistic Astrophysics, 209–220
- Finley et al. (2001) Finley, J. P., Krennrich, F., Badran, H. M., Bond, I. H., Bradbury, S. M., Buckley, J. H., Carter-Lewis, D. A., Catanese, M., Cui, W., Dunlea, S., Das, D., de la Calle Perez, I., Fegan, D. J., Fegan, S. J., Gaidos, J. A., Gibbs, K., Gillanders, G. H., Hall, T. A., Hillas, A. M., Holder, J., Horan, D., Jordan, M., Kertzman, M., Kieda, D., Kildea, J., Knapp, J., Kosack, K., Lang, M. J., LeBohec, S., McKernan, B., Moriarty, P., Müller, D., Ong, R., Pallassini, R., Petry, D., Quinn, J., Reay, N. W., Reynolds, P. T., Rose, H. J., Sembroski, G. H., Sidwell, R., Stanton, N., Swordy, S. P., Vassiliev, V. V., Wakely, S. P., & Weekes, T. C. 2001, in International Cosmic Ray Conference, 2827
- Fusco-Femiano et al. (1999) Fusco-Femiano, R., dal Fiume, D., Feretti, L., Giovannini, G., Grandi, P., Matt, G., Molendi, S., & Santangelo, A. 1999, ApJ, 513, L21
- Fusco-Femiano et al. (2004) Fusco-Femiano, R., Orlandini, M., Brunetti, G., Feretti, L., Giovannini, G., Grandi, P., & Setti, G. 2004, ApJ, 602, L73
- Giovannini & Feretti (2000) Giovannini, G. & Feretti, L. 2000, New Astronomy, 5, 335
- Giovannini et al. (1993) Giovannini, G., Feretti, L., Venturi, T., Kim, K.-T., & Kronberg, P. P. 1993, ApJ, 406, 399
- Giovannini et al. (1999) Giovannini, G., Tordi, M., & Feretti, L. 1999, New Astronomy, 4, 141
- Girardi et al. (1998) Girardi, M., Giuricin, G., Mardirossian, F., Mezzetti, M., & Boschin, W. 1998, ApJ, 505, 74
- Helene (1983) Helene, O. 1983, Nuclear Instruments and Methods in Physics Research, 212, 319
- Hillas (1985) Hillas, A. M. 1985, in International Cosmic Ray Conference, 445–448
- Horns (2005) Horns, D. 2005, Physics Letters B, 607, 225
- Jones & Forman (1984) Jones, C. & Forman, W. 1984, ApJ, 276, 38
- Kang & Jones (2005) Kang, H. & Jones, T. W. 2005, ApJ, 620, 44
- Kawasaki & Totani (2002) Kawasaki, W. & Totani, T. 2002, ApJ, 576, 679
- Kempner & Sarazin (2001) Kempner, J. C. & Sarazin, C. L. 2001, ApJ, 548, 639
- King (1972) King, I. R. 1972, ApJ, 174, L123
- Kosack (2005) Kosack, K. 2005, PhD thesis, Washington University in St. Louis
- Kosack et al. (2004) Kosack, K., Badran, H. M., Bond, I. H., Boyle, P. J., Bradbury, S. M., Buckley, J. H., Carter-Lewis, D. A., Celik, O., Connaughton, V., Cui, W., Daniel, M., D’Vali, M., de la Calle Perez, I., Duke, C., Falcone, A., Fegan, D. J., Fegan, S. J., Finley, J. P., Fortson, L. F., Gaidos, J. A., Gammell, S., Gibbs, K., Gillanders, G. H., Grube, J., Gutierrez, K., Hall, J., Hall, T. A., Hanna, D., Hillas, A. M., Holder, J., Horan, D., Jarvis, A., Jordan, M., Kenny, G. E., Kertzman, M., Kieda, D., Kildea, J., Knapp, J., Krawczynski, H., Krennrich, F., Lang, M. J., Le Bohec, S., Linton, E., Lloyd-Evans, J., Milovanovic, A., McEnery, J., Moriarty, P., Muller, D., Nagai, T., Nolan, S., Ong, R. A., Pallassini, R., Petry, D., Power-Mooney, B., Quinn, J., Quinn, M., Ragan, K., Rebillot, P., Reynolds, P. T., Rose, H. J., Schroedter, M., Sembroski, G. H., Swordy, S. P., Syson, A., Vassiliev, V. V., Wakely, S. P., Walker, G., Weekes, T. C., & Zweerink, J. 2004, ApJ, 608, L97
- Krawczynski (2002) Krawczynski, H. 2002, ApJ, 569, L27
- Lieu et al. (1999) Lieu, R., Ip, W.-H., Axford, W. I., & Bonamente, M. 1999, ApJ, 510, L25
- Lieu et al. (1996) Lieu, R., Mittaz, J. P. D., Bowyer, S., Breen, J. O., Lockman, F. J., Murphy, E. M., & Hwang, C.-Y. 1996, Science, 274, 1335
- Markevitch et al. (1998) Markevitch, M., Forman, W. R., Sarazin, C. L., & Vikhlinin, A. 1998, ApJ, 503, 77
- Nevalainen et al. (2004) Nevalainen, J., Oosterbroek, T., Bonamente, M., & Colafrancesco, S. 2004, ApJ, 608, 166
- Pfrommer & Enßlin (2004) Pfrommer, C. & Enßlin, T. A. 2004, A&A, 413, 17
- Punch & Fegan (1991) Punch, M. & Fegan, D. J. 1991, in AIP Conf. Proc. 220: High Energy Gamma Ray Astronomy, 321–328
- Reimer et al. (2003) Reimer, O., Pohl, M., Sreekumar, P., & Mattox, J. R. 2003, ApJ, 588, 155
- Rephaeli (1977) Rephaeli, Y. 1977, ApJ, 218, 323
- Rephaeli et al. (1999) Rephaeli, Y., Gruber, D., & Blanco, P. 1999, ApJ, 511, L21
- Reynolds et al. (1993) Reynolds, P. T., Akerlof, C. W., Cawley, M. F., Chantell, M., Fegan, D. J., Hillas, A. M., Lamb, R. C., Lang, M. J., Lawrence, M. A., Lewis, D. A., Macomb, D., Meyer, D. I., Mohanty, G., O’Flaherty, K. S., Punch, M., Schubnell, M. S., Vacanti, G., Weekes, T. C., & Whitaker, T. 1993, ApJ, 404, 206
- Ryu et al. (2003) Ryu, D., Kang, H., Hallman, E., & Jones, T. W. 2003, ApJ, 593, 599
- Sanders et al. (2005) Sanders, J. S., Fabian, A. C., & Dunn, R. J. H. 2005, MNRAS, 360, 133
- Scharf & Mukherjee (2002) Scharf, C. A. & Mukherjee, R. 2002, ApJ, 580, 154
- Struble & Rood (1999) Struble, M. F. & Rood, H. J. 1999, ApJS, 125, 35
- Tsuchiya et al. (2004) Tsuchiya, K., Enomoto, R., Ksenofontov, L. T., Mori, M., Naito, T., Asahara, A., Bicknell, G. V., Clay, R. W., Doi, Y., Edwards, P. G., Gunji, S., Hara, S., Hara, T., Hattori, T., Hayashi, S., Itoh, C., Kabuki, S., Kajino, F., Katagiri, H., Kawachi, A., Kifune, T., Kubo, H., Kurihara, T., Kurosaka, R., Kushida, J., Matsubara, Y., Miyashita, Y., Mizumoto, Y., Moro, H., Muraishi, H., Muraki, Y., Nakase, T., Nishida, D., Nishijima, K., Ohishi, M., Okumura, K., Patterson, J. R., Protheroe, R. J., Sakamoto, N., Sakurazawa, K., Swaby, D. L., Tanimori, T., Tanimura, H., Thornton, G., Tokanai, F., Uchida, T., Watanabe, S., Yamaoka, T., Yanagita, S., Yoshida, T., & Yoshikoshi, T. 2004, ApJ, 606, L115
- Völk & Atoyan (1999) Völk, H. J. & Atoyan, A. M. 1999, Astroparticle Physics, 11, 73
- Weekes (1996) Weekes, T. C. 1996, Space Science Reviews, 75, 1
| Source | Season | Number | ON | OFF |
|---|---|---|---|---|
| (MJD) | (Pairs) | (min) | (min) | |
| Perseus | 2004-2005 | 29 | 810.4 | 810.4 |
| Abell 2029 | 2003-2004 | 13 | 363.3 | 363.3 |
| Crab | 2003-2004 | 29 | 810.4 | 810.4 |
| Crab | 2004-2005 | 24 | 670.7 | 670.4 |
| Crab-0.5 | 2003-2005 | 6 | 167.7 | 167.6 |
| Crab-0.8 | 2003-2005 | 8 | 223.6 | 223.6 |
| Cluster | ||||||
|---|---|---|---|---|---|---|
| (kpc) | (kpc) | |||||
| Perseus | 1.0 | 0.104 | 57 | 200 | 1.2 | 0.58 |
| Abell 2029 | 1.0 | N/A | 212 | N/A | 0.83 | N/A |
| Cluster | Source | RA | DEC | 20 cm Flux | 400 GeV Flux Upper Limit | |
| (J2000) | (J2000) | (mJy) | (Crab) | (ergs cm-2 s-1) | ||
| Perseus | 3C 84.0 | 03 19 48 | +41 30 42 | 2829.2 | 0.047 | 0.29 |
| (NGC 1275) | ||||||
| Perseus | 3C 83.1 | 03 18 16 | +41 51 27 | 1305.5 | 0.086 | 0.53 |
| (NGC 1265) | ||||||
| Perseus | IC 310 | 03 16 43 | +41 19 29 | 168.1 | 0.13 | 0.80 |
| Abell 2029 | IC 1101 | 15 10 56 | +05 44 42 | 527.8 | 0.13 | 1.1 |
| Cluster | Angular Cut | Significance | 400 GeV Flux Upper Limit | Scaling Factor | |
|---|---|---|---|---|---|
| (Degrees) | (Sigma) | (Crab) | (ergs cm-2 s-1) | ||
| Perseus | 0.2 | -2.3 | 0.047 | 0.29 | 0.80 |
| Perseus | 0.3 | -2.1 | 0.13 | 0.80 | 0.80 |
| Perseus | 0.8 | -0.91 | 0.12 | 0.74 | 0.80 |
| Abell 2029 | 0.2 | -1.2 | 0.10 | 0.87 | 1.1 |
| Abell 2029 | 0.3 | -0.15 | 0.14 | 1.2 | 1.1 |
| Abell 2029 | 0.8 | -0.79 | 0.25 | 2.2 | 1.1 |