75282
G. De Zotti
A Physical Model for Co-evolution of QSOs and of their Spheroidal Hosts
Abstract
At variance with most semi-analytic models, in the Anti-hierarchical Baryon Collapse scenario (Granato et al. 2001, 2004) the main driver of the galaxy formation and evolution is not the merging sequence but are baryon processes. This approach emphasizes, still in the framework of the hierarchical clustering paradigm for dark matter halos, feedback processes from supernova explosions and from active nuclei, that tie together star formation in spheroidal galaxies and the growth of black holes at their centers. We review some recent results showing the remarkably successful predictive power of this scenario, which allows us to account for the evolution with cosmic time of a broad variety of properties of galaxies and active nuclei, which proved to be very challenging for competing models.
keywords:
Cosmology: theory – galaxies: formation – galaxies: evolution – quasars: general1 Introduction
The establishment in the 1990’s of the hierarchical clustering paradigm led to the development of various semi-analytic models for galaxy formation sharing the basic assumption that the main driver shaping the structure and morphology of galaxies is gravity. In this scenario, the gas cools and form stars following the collapse of dark matter halos. In a cold dark matter cosmology, small objects form first and merge together to make larger ones. This scenario then implies that large ellipticals form late, by the merger of disk/bulge systems made primarily of stars.
On the other hand, it has long been known that stellar populations in elliptical galaxies are old and essentially coeval (Sandage & Visvanathan 1978; Bernardi et al 1998; Trager et al. 2000; Terlevich & Forbes 2002). A color-magnitude relation is also well established: brighter spheroids are redder (Bower et al. 1992). The widely accepted interpretation is that brighter objects are richer in metals and the spread of their star formation epochs is small enough to avoid smearing of their colors. The slope of this relation does not change with redshift (Ellis et al. 1997; Kodama et al. 1998) supporting this interpretation. The star formation history of spheroidal galaxies is mirrored in the Fundamental Plane (Djorgovski & Davies 1987; Dressler et al. 1987) and in its evolution with redshift. Elliptical galaxies adhere to this plane with a surprisingly low orthogonal scatter (%), as expected for a homogeneous family of galaxies. Recent studies (e.g. Treu et al. 2002; van der Wel et al. 2004; Holden et al. 2004, 2005) suggest that ellipticals, both in the field and in clusters, follow this fundamental relation up to , consistent with the hypothesis that massive spheroids are old and quiescent.
Although these data have mostly to do with ages of stars and may leave open the issue of the epoch at which ellipticals were assembled to their present size and mass, they motivated our group to take a different view, i.e. to investigate the possibility that gas processes have a key role in driving the formation and evolution of large galaxies, still in the framework of hierarchical clustering of dark matter halos (Monaco et al. 2000; Granato et al. 2001). This new approach emphasized the role of feedbacks, first of all from supernovae, which release large amounts of mechanical energy, capable of unbinding the gas in weakly bound, low mass systems, but also from the active nuclei which were found to be ubiquitous in the centers of spheroidal galaxies (Kormendy & Richstone 1995; Magorrian et al. 1998). These feedbacks can actually reverse the order of formation of visible galaxies compared to that of dark halos: large galaxies form their stars first, while the star formation is delayed in smaller halos (Anti-hierarchical Baryon Collapse, or ABC, scenario; Granato et al. 2001, 2004). At the same time, processes associated to the star formation activity have a profound effect on the evolutionary history of nuclear activity.
In this paper we will briefly review some recent results obtained in the framework of the ABC scenario, focussing in particular on predictions for the evolution of nuclear activity. We adopt a spatially flat cold dark matter cosmology with cosmological constant, consistent with the Wilkinson Microwave Anisotropy Probe (WMAP) data (Bennett et al. 2003): , , and , , , and an index for the power spectrum of primordial density fluctuations.
2 Correlations between SMBHs and their host galaxies
In the last several years various empirical relationships between super-massive black hole (SMBH) masses and different properties of their host galaxies have been derived (but see Novak et al. 2006). These include correlations with the stellar velocity dispersion (Ferrarese & Merritt 2000; Gebhardt et al. 2000; Tremaine et al. 2002; Ferrarese & Ford 2005), with the mass in stars (Häring & Rix 2004), with the bulge luminosity (McLure & Dunlop 2002; Marconi & Hunt 2003; Bettoni et al. 2003), with light concentration (Graham et al. 2001), and with the dark halo mass (Ferrarese 2002; Baes et al. 2003). In all cases, BH masses are related to the (generally old) bulge stellar population, not to the younger disk (Kormendy & Gebhardt 2001; Kormendy & Ho 2000; Salucci et al. 2000).
Shankar et al. (2006) exploited updated estimates of the total and baryonic mass functions of galaxies, of their luminosity function, of their velocity dispersion function, and of the mass function of central black holes to derive relationships between halo masses and stellar masses, stellar velocity dispersions, and black hole masses (). Particularly relevant, in the present context are the relationship between and , both in solar units:
| (1) |
and between and :
| (2) |
3 Velocity Dispersion Function and Virial Velocity Function
As first pointed out by Loeb & Peebles (2003), a comparison of the local Velocity Dispersion Function (VDF) with the Virial Velocity Function (VVF) can provide interesting hints on the structure formation process. Accurate determinations of the VDF of early-type galaxies have been obtained by Sheth et al. (2003) and Shankar et al. (2004), based on a large sample ( E/S0 galaxies) drawn from the SDSS (Bernardi et al. 2003). As for dark matter halos, it is convenient to define a ’virial’ velocity, equal to the circular velocity at the virial radius (Navarro et al. 1997, NFW; Bullock et al. 2001):
| (3) |
Since, given the virialization redshift, depends only on () the VVF can be straightforwardly derived from the mass distribution function of spheroidal galaxies, integrated over the virialization redshifts.
Cirasuolo et al. (2005), assuming that all massive halos () virializing at yield spheroidal galaxies or bulges of later type galaxies, showed that the VVF accurately matches the VDF for a constant ratio of the velocity dispersion to the virial velocity, , close to the value expected at virialization if it typically occurred at . This is a remarkable result, since the VVF depends only on the evolution of dark matter halos, while the VDF is affected by the physics of baryons.
A substantial stability of the halo circular velocity after the fast accretion phase was found by Zhao et al. (2003) in high-resolution N-body simulations, even though the halo mass increases by a substantial factor. But the central velocity dispersion may be affected by merging events and dissipative baryon loading. This strongly suggests that dissipative processes and later merging events had little impact on the matter density profile, consistent with the dynamical attractor hypothesis (Loeb & Peebles 2003; Gao et al. 2004). It may also suggest that, for massive galaxies, the mass assembly is largely complete at substantial redshifts, as also indicated by the Spitzer Space Telescope observations by Papovich et al. (2006). Direct evidence that the galaxy stellar mass function does not evolve significantly since has been presented by Bundy et al. (2006).
These results may be relevant also for the interpretation of the – correlation, which probably originated at substantial redshifts, when the old stellar population formed. If so, both and should not have changed much since then.
4 Black hole growth
Another important ingredient of the evolutionary history of quasars is how the active nuclei acquired their mass. Although radiative accretion must play a role (Soltan 1982), it is not necessarily the main mechanism for the BH mass growth. In the hierarchical assembly scenario for massive galaxies a buildup of SMBHs by coalescence of BHs associated to merging subunits is naturally expected.
On the other hand, the analysis by Shankar et al. (2004; see also Marconi et al. 2004), exploiting up-to-date luminosity functions of hard X-ray and optically selected AGNs, has shown that the local SMBH mass function is fully accounted for by mass accreted by X-ray selected AGNs, with bolometric corrections indicated by current observations and a standard mass-to-light conversion efficiency . An unlikely fine tuning of the parameters would be required to account for the local SMBH mass function accomodating a dominant contribution from ‘dark’ BH growth (due, e.g., to BH coalescence). It may be noted that the local SMBH mass function can be rather accurately assessed. Estimates from either the velocity dispersion function of galaxies coupled with the – relation or from the galaxy luminosity function coupled with the – relation of McLure & Dunlop (2002) agree very well (cf. Fig. 11 of Shankar et al. 2004).
The visibility time, during which AGNs are luminous enough to be detected by the currently available X-ray surveys, is found to be of 0.1–0.3 Gyr for present day BH masses – .
5 The Granato et al. (2004) model
5.1 Overview of the model
While referring to the Granato et al. (2004) paper for a full account of the model assumptions and their physical justification, we provide here, for the reader’s convenience, a brief summary of its main features.
The model follows with simple, physically grounded recipes and a semi-analytic technique the evolution of the baryonic component of proto-spheroidal galaxies within massive dark matter (DM) halos forming at the rate predicted by the standard hierarchical clustering scenario within a CDM cosmology. The main novelty with respect to other semi-analytic models is the central role attributed to the mutual feedback between star formation and growth of a super massive black hole (SMBH) in the galaxy center.
The idea that SN and QSO feedback play an important role in the evolution of spheroidal galaxies has been pointed out by several authors (Dekel & Silk 1986; White & Frenk 1991; Haehnelt, Natarajan & Rees 1998; Silk & Rees 1998; Fabian 1999). Granato et al. (2004) worked out, for the first time, the symbiotic evolution of the host galaxy and the central black-hole (BH), including the feedback. In this model, the formation rate of massive halos () is approximated by the positive part of the time derivative of the halo mass function (Press & Schechter 1974, revised by Sheth & Tormen 2002). The gas, heated at virial temperature and moderately clumpy, cools to form stars, especially in the innermost regions where the density is the highest. The radiation drag due to starlight acts on the cold gas, decreasing its angular momentum and causing an inflow into a reservoir around the central BH, to be subsequently accreted into it, increasing its mass and powering the nuclear activity. In turn, the feedbacks from SN explosions and from the active nucleus regulate the star formation rate and the gas inflow, and eventually unbind the residual gas, thus halting both the star formation and the BH growth. Important parameters are the efficiency of SN energy transfer to the cold gas and the fraction of the QSO luminosity in winds.
The model prescriptions are assumed to apply to DM halos virializing at and . These cuts are meant to crudely single out galactic halos associated with spheroidal galaxies. Disk (and irregular) galaxies are envisaged as associated primarily to halos virializing at , some of which have incorporated most halos less massive than virializing at earlier times, that may become the bulges of late type galaxies.
The kinetic energy fed by supernovae is increasingly effective, with decreasing halo mass, in slowing down (and eventually halting) both the star formation and the gas accretion onto the central black hole. On the contrary, star formation and black hole growth proceed very effectively in the more massive halos, giving rise to the bright SCUBA phase, until the energy injected by the active nucleus in the surrounding interstellar gas unbinds it, thus halting both the star formation and the black hole growth (and establishing the observed relationship between black hole mass and stellar velocity dispersion or halo mass). Not only the black hole growth is faster in more massive halos, but also the feedback of the active nucleus on the interstellar medium is stronger, to the effect of sweeping out such medium earlier, thus causing a shorter duration of the active star-formation phase.
The basic yields of the model are the star-formation rate, , as a function of the galactic age, , (hence the evolution of the mass in stars, ), and the growth of the central BH mass, , for any given value of the halo mass, , and of the virialization redshift, . These quantities are obtained solving the system of differential equations given by Granato et al. (2004) and Cirasuolo et al. (2005).
5.2 Approximate analytic solutions
A simplified set of equations, still keeping the basic physics, is presented by Shankar et al. (2006), who derived an approximate analytic solution for the time evolution of the mass in stars, , which, at the present time , writes:
| (4) |
where is the fraction of stars still surviving at the present time ( for a Salpeter IMF after about 10 Gyr from a burst), is the initial gas mass ( being the cosmic baryon to dark matter ratio and being the halo mass). Further, , being the fraction of mass restituted by evolved stars ( for a Salpeter IMF), and
| (5) |
is effective efficiency for the removal of cold gas by the supernova feedback. Here is the number of SNe per unit solar mass of condensed stars, the energy per SN used to remove the cold gas, and the binding energy of the gas within the DM halo, per unit gas mass.
For Shankar et al. (2006) obtain:
| (6) | |||||
For large halo masses, where the stellar feedback is less efficient (), the quantity is a slowly decreasing function of the halo mass, so that is approximately proportional to . However, in this case, the fraction of gas turned into stars is controlled by the AGN feedback, which, as shown by the full treatment by Granato et al. (2004), for expels an approximately constant fraction of the initial gas, thus preserving the approximate proportionality between and , in agreement with eq. (1).
On the contrary, for , , and
| (7) |
quantifying the effect of SN in decreasing the ratio with decreasing .
In the Granato et al. (2004) model, the radiation drag dissipates the angular momentum of the cool gas present in the central regions (Kawakatu & Umemura 2002). The gas then falls into a reservoir around the central BH at a rate
| (8) |
where is the effective optical depth of the central star forming regions. If most of the mass in the reservoir is ultimately accreted onto the central BH, and if other contributions to the BH mass can be neglected, we have:
| (9) |
Granato et al. (2004) assumed that the effective optical depth depends on the cold gas metallicity and mass . The outcome of their numerical code yields, on average, in the mass range [cf. their Figs. (5) and (8)]. Since , one gets
| (10) |
In the mass range the optical depth is small (); from eqs. (9) and (10) we then obtain:
| (11) |
Thus this simple model predicts that the low mass slope of the – relation is steeper than that of the relation, because of the decrease of the optical depth with mass , entailing a lower capability of feeding the reservoir around the BH.
For large halo masses , and the model predicts . A roughly linear relationship between and () has been observationally derived by Häring & Rix (2004).
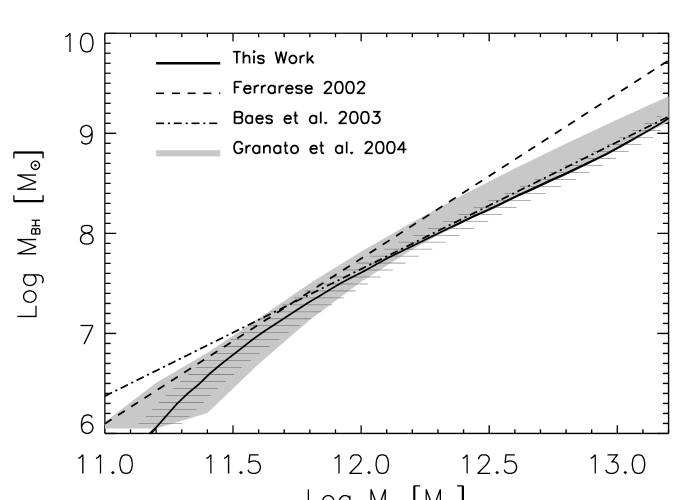
In Fig. 1 we compare the – relation derived by Shankar et al. (2006) with that of Ferrarese (2002), who first investigated this issue from an observational point of view. She derived a power-law relationship between the bulge velocity dispersion and the circular velocity, , for a sample of spiral and elliptical galaxies spanning the range km s-1, and combined it with an approximated relationship between and the virial velocity, , based on the numerical simulations by Bullock et al. (2001) and with the – relationship given by the CDM model of the latter authors for a virialization redshift , to obtain a – relation. Coupling it with one version of the observed BH mass vs. stellar velocity dispersion relationship () she obtained , with –1.82. Baes et al. (2003) with the same method, but assuming and with new velocity dispersion measurements of spiral galaxies with extended rotation curves, yielding a slightly different - relation, found .
As shown by Fig. 6 of Shankar et al. (2006), their relationships lie substantially below ours.111Both Ferrarese (2002) and Baes et al. (2003) adopted with , following Bullock et al. (2001), while the correct value is . This correction has, however, a minor effect. It should be noted, however, that the – relation depends on the virialization redshift. For , its coefficient would be a factor of lower than that used by Ferrarese (2002) and Baes et al. (2003) and the coefficients of the relations would be larger by a factor of in the case of eq. (6) of Ferrarese(2002) or of in the case of Baes et al. (2003), bringing them much closer to the results by Shankar et al. (2006; see Fig. 1), and to the predictions of the Granato et al. (2004) model.
5.3 The evolution of nuclear activity
According to the Granato et al. (2004) model the SMBH growth parallels the star formation in spheroidal galaxies. However, the BH growth is much faster than the increase of the mass in stars. In fact, the timescale for the former is roughly the -folding timescale for Eddington-limited accretion, (where is the Eddington time and is the BH mass to energy conversion efficiency). For , yr. The star formation timescale, which is the shorter between the cooling and the free-fall times, increases from the denser inner regions outwards (where most of the mass is); its effective values are typically of a few to several hundred million years. This means that the ratio increases rapidly until the AGN feedback sweeps out the residual gas.
The exponential growth of the active nucleus implies that its bolometric luminosity is very low except in the final several -folding times. Also the nucleus is surrounded by a dusty environment with a large column density, even if we ignore the contribution of the obscuring torus. For example, if we adopt for the gas distribution a King profile with core radius –kpc, we obtain, for galaxies with , column densities to the nucleus of to (Granato et al. 2006). Correspondingly, we expect large optical extinctions .
The nuclear activity then shows up first in hard X-rays. As noted in § 4, the X-ray visibility times are in the range 0.1–0.3 Gyr, corresponding to the last 2–6 -folding times of the BH growth. In this period, the ratio can be . The AGN feedback will then progressively sweep out the residual gas, decreasing the extinction until the AGN enters its optical visibility phase, whose duration is expected to be a substantial fraction of the last -folding time.
These expectations are fully borne out by the study of 20 SCUBA galaxies brighter than mJy at m, lying in the region of the 2Ms CDF-N Chandra observations (Alexander et al. 2003, 2005a,b). As shown by Granato et al. (2006), the data imply accretion rates and column densities fully compatible with the predictions of the Granato et al. (2004) model. Borys et al. (2005) estimate, for these objects, ratios one or two orders of magnitude smaller than local galaxies of comparable stellar mass, suggesting a subsequent growth lasting 2 to 5 -folding times, at the Eddington limit. The lack of objects with may suggest that in the last –3 -folding times the AGN feedback begins quenching the star formation rate so that the sub-mm emission decreases and galaxies slip below the m flux limit.
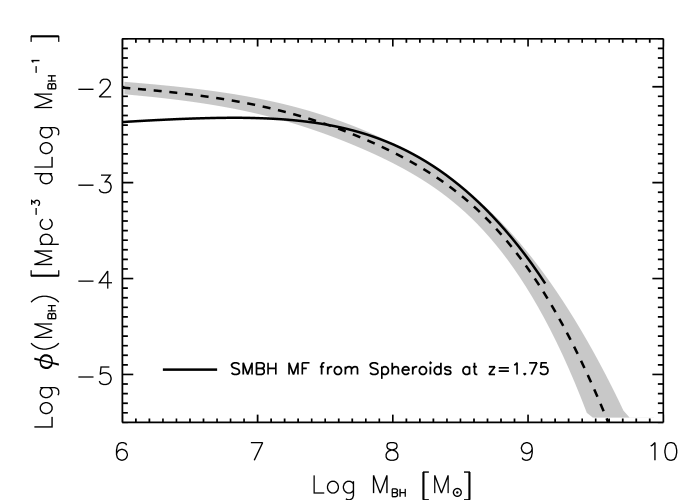
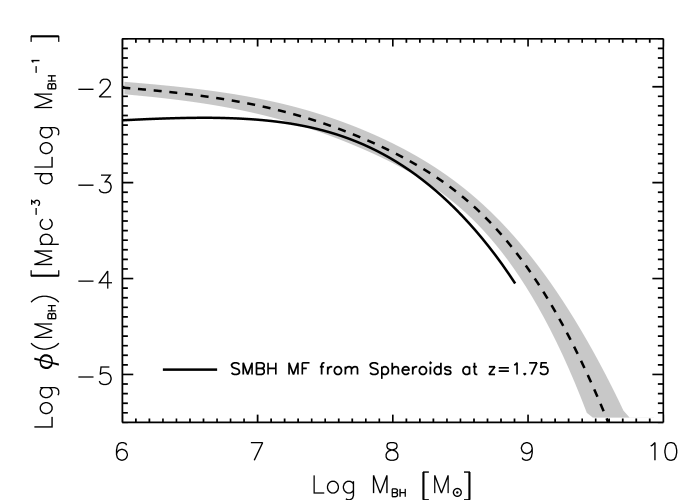
A different history of the coevolution of SMBHs and host galaxies is apparently implied by the study by Peng et al. (2006), who estimated the ratios for a sample of optical quasars at and found them to be 3–6 times larger than in the local universe. This conclusion however relies on a number of very uncertain assumptions, as discussed by the authors themselves. A further constraint come from the SMBH local mass function (see § 4). An estimate of the galaxy stellar mass function at has been obtained by Drory et al. (2005). Others can be obtained from the galaxy luminosity functions at a similar redshift derived by various groups (Saracco et al. 2006; Dahlen et al. 2005; Fontana et al. 2004; Caputi et al. 2005). As shown by Fig. 2, a ratio 3 times higher than in the local universe would imply that, at large SMBH masses, there is no room for growth at . The constraint is attenuated if the IMF flattens to a slope of below (see Romano et al. 2002 and Granato et al. 2004), decreasing the ratio in the -band to (this ratio is for a Salpeter IMF). Nevertheless, even in this case a rather large contribution to the local SMBH mass function is already in place at , and this is very difficult to reconcile with the optical and X-ray data on the evolution of the AGN luminosity function.
6 Conclusions
Huge amounts of data have been accumulating in recent years, providing rather detailed information on the mass-dependent evolution of galaxies and of active nuclei. Rather unexpectedly, it turned out that intense star formation shifts from massive galaxies at high redshifts to lower mass galaxies at later time, a pattern referred to as “downsizing” (Cowie et al. 1996). Granato et al. (2001, 2004) showed that this evolutionary behaviour, which apparently contradicts expectations from the hierarchical structure formation paradigm, can be reconciled with it if the main driver of evolution is not the merging sequence of dark matter halos, but are baryon processes, involving strong feedback effects from star formation (and supernova explosions) and from nuclear activity (Anti-hierarchical Baryon Collapse - ABC - scenario).
An implication of this scenario is that the luminosity function of massive galaxies underwent essentially passive evolution since , little affected even by the “dry mergers” advocated by several authors (e.g. Bell et al. 2005; Faber et al. 2006; van Dokkum 2005), but strongly constrained by the DEEP2 Galaxy Redshift Survey (Bundy et al. 2006). The ABC scenario also explains a broad variety of observational data, as shown by Granato et al. (2004), Silva et al. (2005), Cirasuolo et al. (2005), and Shankar et al. (2006). We have recalled here the close match of the virial velocity function with the velocity dispersion function of galaxies, and the – relation, both determined from data on local galaxies, but whose physical explanations trace their origin to substantial redshifts.
In this framework, also the AGN evolution is tightly connected with star formation, rather than with mergers (although star formation may be triggered by merging events), and the BH growth is dominated by radiative accretion, rather than, e.g., by coalescence of BH associated to merging sub-units. This implies that during the intense star-formation phases, characterizing sub-mm bright galaxies, the BH masses are still below, even by large factors, the present day values, consistent with the findings by Alexander et al. (2003, 2005a,b) and Borys et al. (2005). Also, the detectable QSO activity is delayed compared to the onset of vigorous star formation, since: a) the BH mass and its bolometric luminosity grow exponentially on a timescale yr and are therefore small except in the final few tenths of Gyr before reaching the final mass; b) the nuclear activity is highly obscured even in hard X-rays before the AGN feedback begins to push away the residual dusty medium.
Acknowledgements.
Work supported in part by ASI and MIUR.References
- Alexander et al. (2003) Alexander, D.M. et al. 2003, AJ, 125, 383
- Alexander et al. (2005) Alexander, D.M., Bauer, F.E., Chapman, S.C., Smail, I., Blain, A.W., Brandt, W.N., & Ivison, R.J. 2005, ApJ, 632, 736
- Alexander et al. (2005) Alexander, D.M., Smail, I., Bauer, F.E., Chapman, S.C., Blain, A.W., Brandt, W.N., & Ivison, R.J. 2005, Natur, 434, 738
- (4) Baes, M., Buyle, P., Hau, G.K.T., & Dejonghe, H. 2003, MNRAS, 341, L44
- Bell et al. (2005) Bell, E.F., et al. 2005, ApJ, 625, 23
- (6) Bennett, C.L., et al. 2003, ApJ, 583, 1
- (7) Bernardi, M. et al. 1998, ApJ, 508, 143
- (8) Bernardi, M., et al. 2003, AJ, 125, 1849
- Bettoni et al. (2003) Bettoni, D., Falomo, R., Fasano, G., & Govoni, F. 2003, A&A, 399, 869
- Borys et al. (2005) Borys, C., Smail, I., Chapman, S.C., Blain, A.W., Alexander, D.M., & Ivison, R.J. 2005, ApJ, 635, 853
- (11) Bower, R.G., Lucey, J.R., & Ellis R.S. 1992, MNRAS, 254, 601
- (12) Bullock, J.S., Kolatt, T.S., Sigad, Y., Somerville, R.S., Kravtsov, A.V., Klypin, A.A., Primack, J.R., & Dekel, A. 2001, MNRAS, 321, 559
- (13) Bundy, K., et al. 2006, ApJ, submitted (astro-ph/0512465)
- Caputi et al. (2005) Caputi, K.I., Dunlop, J.S., McLure, R.J., & Roche, N.D. 2005, MNRAS, 361, 607
- (15) Cirasuolo, M., Shankar, F., Granato, G.L., De Zotti, G., & Danese, L. 2005, ApJ, 629, 816
- Cowie et al. (1996) Cowie, L.L., Songaila, A., Hu, E.M., & Cohen, J.G. 1996, AJ, 112, 839
- Dahlen et al. (2005) Dahlen, T., Mobasher, B., Somerville, R.S., Moustakas, L.A., Dickinson, M., Ferguson, H.C., & Giavalisco, M. 2005, ApJ, 631, 126
- (18) Dekel, A., & Silk, J. 1986, ApJ, 303, 39
- (19) Djorgovski, S.G., & Davis, M. 1987, ApJ, 313, 59
- (20) Dressler, A., Lynden-Bell, D., Burstein, D., Davies, R.L., Faber, S.M., Terlevich, R., & Wegner, G. 1987, ApJ, 313, 42
- Drory et al. (2005) Drory, N., Salvato, M., Gabasch, A., Bender, R., Hopp, U., Feulner, G., & Pannella, M. 2005, ApJ, 619, L131
- (22) Ellis, R.S., Smail, I., Dressler, A., Couch, W.J., Oemler, A., Butcher, H., & Sharples, R.M. 1997, ApJ, 483, 582
- (23) Faber, S.M., et al. 2006, ApJ, submitted (astro-ph/0506044)
- (24) Fabian, A.C. 1999, MNRAS, 308, L39
- (25) Ferrarese, L., & Merritt, D. 2000, ApJ, 539, L9
- (26) Ferrarese, L. 2002, ApJ, 578, 90
- (27) Ferrarese, L., & Ford, H. 2005, Sp. Sci. Rev., 116, 523
- Fontana et al. (2004) Fontana, A., et al. 2004, A&A, 424, 23
- Gao et al. (2004) Gao, L., Loeb, A., Peebles, P.J.E., White, S.D.M., & Jenkins, A. 2004, ApJ, 614, 17
- (30) Gebhardt, K., et al. 2000, ApJ, 539, L13
- (31) Graham, A.W., Trujillo, I., & Caon, N. 2001, AJ, 122, 1707
- (32) Granato, G.L., De Zotti, G., Silva, L., Bressan, A., & Danese, L. 2004, ApJ, 600, 580
- (33) Granato, G.L., Silva, L., Lapi, A., Shankar, F., De Zotti, G., Danese, L., 2006, MNRAS, submitted
- (34) Granato, G.L., Silva, L., Monaco, P., Panuzzo, P., Salucci, P., De Zotti, G., & Danese, L. 2001, MNRAS, 324, 757
- (35) Haehnelt, M.G., Natarajan, P., & Rees, M.J. 1998, MNRAS, 300, 817
- (36) Häring, N., & Rix, H.-W. 2004, ApJ, 604, 89
- Holden et al. (2005) Holden, B.P., van der Wel, A., Franx, M., et al. 2005, ApJ, 620, L83
- Holden et al. (2004) Holden, B.P., Stanford, S.A., Eisenhardt, P., & Dickinson, M. 2004, AJ, 127, 2484
- (39) Kawakatu, N., & Umemura, M. 2002, MNRAS, 329, 572
- (40) Kodama, T., Arimoto, N., Barger, A.J., & Aragón-Salamanca, A. 1998, AA, 334, 99
- Kormendy & Gebhardt (2001) Kormendy, J., & Gebhardt, K. 2001, in AIP Conf. Proc. 586: 20th Texas Symposium on Relativistic Astrophysics, ed. J. C. Wheeler & H. Martel, 363
- (42) Kormendy, J., & Ho, L.C., 2000, in The Encyclopedia of Astronomy and Astrophysics, Inst. of Phy. Publ., astro-ph/0003268
- (43) Kormendy, J., & Richstone, D. 1995, ARA&A, 33, 581
- Loeb & Peebles (2003) Loeb, A., & Peebles, P.J.E. 2003, ApJ, 589, 29
- (45) Magorrian, J. et al. 1998, AJ, 115, 2295
- (46) Marconi, A., & Hunt, L. 2003, ApJL, 589, L21
- (47) Marconi, A., Risaliti, G., Gilli, R., Hunt, L.K., Maiolino, R., & Salvati, M. 2004, MNRAS, 351, 169
- (48) McLure, R.J., & Dunlop, J.S. 2002, MNRAS, 331,795
- (49) Monaco, P., Salucci, P., Danese, L.: 2000, MNRAS, 311 279.
- (50) Navarro, J.F., Frenk, C.S., & White, S.D.M. 1997, ApJ, 490, 493
- (51) Novak, G.S., Faber, S.M., & Dekel, A. 2006, ApJ, 637, 96
- (52) Papovich, C. et al. 2006, AJ, accepted (astro-ph/0511289)
- (53) Peng, C.Y., Impey, C.D., Ho, L.C., Barton, E.J., & Rix, H.-W., 2006, ApJ, accepted (astro-ph/0509155)
- (54) Press, W.H., & Schechter, P. 1974, ApJ, 187, 425
- (55) Romano, D., Silva, L., Matteucci, F., & Danese L. 2002, MNRAS, 334, 444
- Salucci et al. (2000) Salucci, P., Ratnam, C., Monaco, P., & Danese, L. 2000, MNRAS, 317, 488
- (57) Sandage, A., & Visvanathan, N. 1978, ApJ, 225, 742
- (58) Saracco, P., Fiano, A., Chincarini, G., Vanzella, E., Longhetti, M., Cristiani, S., Fontana, A., Giallongo, E., Nonino, M. 2006, MNRAS, accepted (astro-ph/0512147)
- (59) Shankar, F., Lapi, A., Salucci, P., De Zotti, G., & Danese, L. 2006, ApJ, submitted
- (60) Shankar, F., Salucci, P., Granato, G.L., De Zotti, G., & Danese, L. 2004, MNRAS, 354, 1020
- (61) Sheth, R.K., et al. 2003, ApJ, 594, 225
- (62) Sheth, R.K., & Tormen, G. 1999, MNRAS, 308, 119
- (63) Silk, J., & Rees, M.J. 1998, A&A, 331, L1
- Soltan (1982) Soltan, A. 1982, MNRAS, 200, 115
- Silva et al. (2005) Silva, L., De Zotti, G., Granato, G.L., Maiolino, R., & Danese, L. 2005, MNRAS, 357, 1295
- (66) Terlevich, A.I., & Forbes, D.A. 2002, MNRAS, 330, 547
- (67) Tremaine, S., et al. 2002, ApJ, 574, 740
- (68) Trager, S.C., Faber, S.M., Worthey, G., & González, J.J. 2000, AJ, 120, 165
- (69) Treu, T., Stiavelli, M., Bertin G., Casertano, C., & Møller, P. 2002, ApJ, 564, L13
- (70) van der Wel, A., Franx, M., van Dokkum, P.G., & Rix, H.-W. 2004, ApJ, 601, L5
- van Dokkum (2005) van Dokkum, P.G. 2005, AJ, 130, 2647
- (72) White, S.D.M., & Frenk, C.S. 1991, ApJ, 379, 52
- (73) Zhao, D.H., Mo, H.J., Jing, Y.P., & Börner, G. 2003, MNRAS, 339, 12