Late-Time Spectroscopy of SN 2002cx:
The Prototype of a New Subclass of Type Ia Supernovae
Abstract
We present Keck optical spectra of SN 2002cx, the most peculiar known Type Ia supernova (SN Ia), taken 227 and 277 days past maximum light. Astonishingly, the spectra are not dominated by the forbidden emission lines of iron that are a hallmark of thermonuclear supernovae in the nebular phase. Instead, we identify numerous P-Cygni profiles of Fe II at very low expansion velocities of 700 , which are without precedent in SNe Ia. We also report the tentative identification of low-velocity O I in these spectra, suggesting the presence of unburned material near the center of the exploding white dwarf. SN 2002cx is the prototype of a new subclass of SNe Ia, with spectral characteristics that may be consistent with recent pure deflagration models of Chandrasekhar-mass thermonuclear supernovae. These are distinct from the majority of SNe Ia, for which an alternative explosion mechanism, such as a delayed detonation, may be required.
1 Introduction
The utility of type Ia supernovae (SNe Ia) as excellent cosmological distance indicators has prompted significant effort into the observational and theoretical study of this class of cosmic explosions. While SNe Ia show remarkable homogeneity and quantifiable heterogeneity, some objects do not fit within the one-parameter framework that well describes the vast majority of SNe Ia. Perhaps the most extreme deviant known is SN 2002cx, described by Li et al. (2003a), who presented optical photometry and spectroscopy from 10 days before to about two months after maximum light. These data showed SN 2002cx had similar spectral features to the slowly declining, luminous SN 1991T (Filippenko et al., 1992b; Phillips et al., 1992) near maximum light, but with significantly lower expansion velocities (Branch et al., 2004a). Furthermore, SN 2002cx was subluminous by 2 mag in the optical relative to normal SNe Ia, even though it had a slow late-time decline rate, the opposite of other subluminous SNe Ia such as SN 1991bg (Filippenko et al., 1992a; Leibundgut et al., 1993).
Here we present late-time optical spectra of SN 2002cx taken about eight months after maximum light. At these epochs, all known SNe Ia are in their nebular phase, with spectra dominated by forbidden emission lines of iron and cobalt and an absence of the P-Cygni profiles of permitted lines that are seen at earlier times (see Filippenko, 1997; Branch et al., 2003a, for reviews of SN spectroscopy). The low expansion velocities in SN 2002cx allow for more secure line identifications than are usually possible in SN spectra because blending is mitigated. In particular, we anticipated these late-time observations might resolve the blended forbidden-line emission, allowing for a check on basic ideas about the structure of SNe Ia (Kirshner & Oke, 1975; Axelrod, 1980), but the results show that the peculiarities of SN 2002cx persist to these late epochs.
2 Observations
Late-time optical spectra of SN 2002cx were taken on 2003 January 7 and 2003 February 27-28 (UT dates are used throughout this paper), with both beams of the Low Resolution Imaging Spectrometer (LRIS; Oke et al., 1995) on the Keck I 10-m telescope. All observations used the 400/3400 grism on the blue side and the D560 dichroic beamsplitter. The January 7 and February 27 spectra were taken with the 400/8500 grating on the red side, while the February 28 spectrum used the 1200/7500 grating to better resolve the emission lines. A slit was oriented through the nucleus of the host galaxy for the January observation, but it was aligned with the parallactic angle (Filippenko, 1982) for the February observations. Further details of the observations are presented in Table 1. At these epochs SN 2002cx had an approximate magnitude of 21. This is only 3.5 mag below peak, an extraordinarily slow decline compared to normal SNe Ia which fade by 6 mag over the same time period (e.g., Milne et al., 2001).333The slow decline is still consistent with the radioactive decay of 56Co as the power source for the late-time light curve, but this question deserves a more detailed analysis with precise late-time photometry and calculation of the bolometric luminosity.
Basic image processing and optimal spectral extraction were performed in IRAF.444The Image Reduction and Analysis Facility (IRAF) is distributed by the National Optical Astronomy Observatories, which are operated by the Association of Universities for Research in Astronomy, Inc., under cooperative agreement with the National Science Foundation. We used our own IDL procedures to apply a flux calibration and correct for telluric absorption bands (Matheson et al., 2000). The blue and red halves of the Jan 7 spectrum were scaled and added together over the interval of wavelength overlap. The blue halves of the Feb 27 and Feb 28 spectra were taken with the same instrumental setup, so they were added together before concatenation with the red half of the Feb 27 spectrum. The red side of the Feb 28 spectrum has higher resolution than the others, so we have analyzed it separately.
| UT Date | Wavelength Range | Resolution | Exposure | PA | Parallactic | Airmass | Seeing |
|---|---|---|---|---|---|---|---|
| (Y-M-D) | (Å) | (Å) | (s) | (∘) | (∘) | () | |
| 2003-01-07.65 | 3300–9430 | 6 | 2 900 | 153.0 | 132.2 | 1.06 | 1.0 |
| 2003-02-27.66 | 3160–9420 | 6 | 800 | 66.0 | 67.3 | 1.28 | 0.7 |
| 2003-02-28.63 | 3160–5770 | 6 | 2 2200 | 240.0 | 242.6 | 1.18 | 0.8 |
| 2003-02-28.63 | 6260–7540 | 2 | 2 2200 | 240.0 | 242.6 | 1.18 | 0.8 |
3 Analysis and Results
The late-time spectra of SN 2002cx, corrected to rest-frame wavelengths (with for the host galaxy, CGCG 044-035; Falco et al. 1999), are shown in Figure 1.555Throughout this paper, we employ a logarithmic wavelength axis to facilitate comparison of line widths. Narrow, unresolved emission lines of H and [O II] 3727 from a superimposed H II region in the host galaxy are shown in light gray; they have been excised in subsequent figures. The January 7 and February 27/28 observations correspond to 227 and 277 days past maximum light in the SN rest frame (Li et al., 2003a). We additionally show the latest SN 2002cx spectrum from the previous observing season, at an epoch of 56 days, presented by Li et al. (2003a) and analyzed in more detail by Branch et al. (2004a). For comparison we also display spectra of normal SNe Ia at similar epochs, including SN 1998aq (52 days) and SN 1998bu (236 days) from our spectral database, and SN 1990N (280 days) from Gómez & López (1998) via the online SUSPECT database666http://suspect.nhn.ou.edu/$∼$suspect/. We further show our archive spectrum of the subluminous SN 1999by (182 days) which had an intrinsic peak brightness similar to SN 2002cx, but with a much faster declining light curve and a very different early-time spectrum (Garnavich et al., 2004).
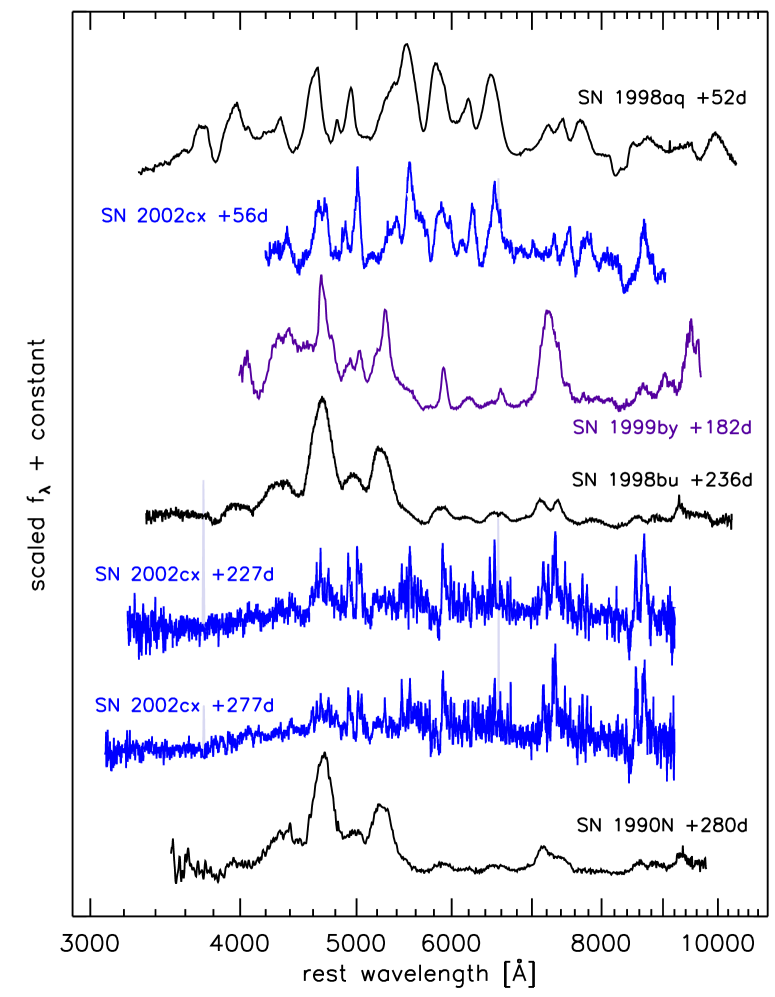
Despite the clearly peculiar nature of SN 2002cx at early times (Li et al., 2003a; Branch et al., 2004a), the day spectrum does not show gross differences compared to the normal SN 1998aq, apart from lower expansion velocities in the lines. However, the late-time spectra below appear very different from normal SN Ia counterparts such as SN 1998bu and SN 1990N, whose flux in the optical is dominated by broad, blended emission lines of [Fe II] and [Fe III] (e.g., Ruiz-Lapuente et al., 1995; Mazzali et al., 1998). Much of the high-frequency structure in the SN 2002cx observations is due to real features, and in general, these narrow lines do not correspond to resolved versions of the features seen in SN 1998bu and SN 1990N.
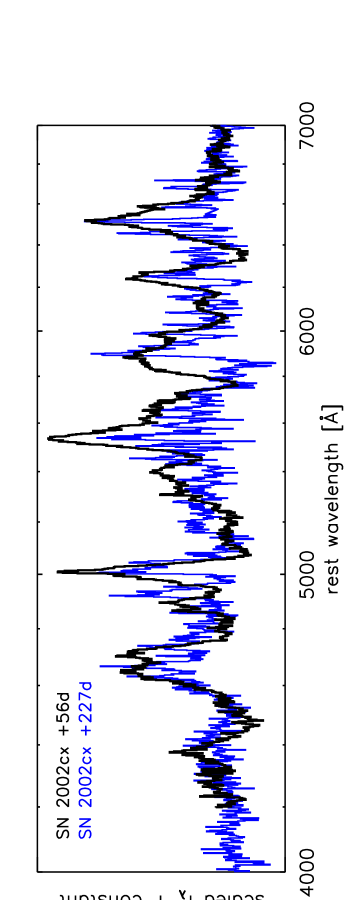
The late-time SN 2002cx spectra do show a relatively broad feature coincident with the strong [Fe III] 4700 Å feature seen in the SN 1998bu and SN 1990N spectra. However, unlike normal SNe Ia whose spectra change dramatically between 2 months and 8-9 months past maximum (compare SN 1998aq with SN 1998bu and SN 1990N in Figure 1), the late-time spectra of SN 2002cx bear a resemblance to its day 56 spectrum, as shown in Figure 2. Over this wavelength range, the day 227 spectrum merely shows more resolved lines with less blueshifted absorption. So rather than forbidden iron emission, the broad 4700 Å feature seen at late times in SN 2002cx may be the same species as in the day 56 spectrum, which can be modeled with P-Cygni profiles of permitted lines of intermediate-mass elements (IMEs), Cr II, Fe II, and Co II (Branch et al., 2004a).
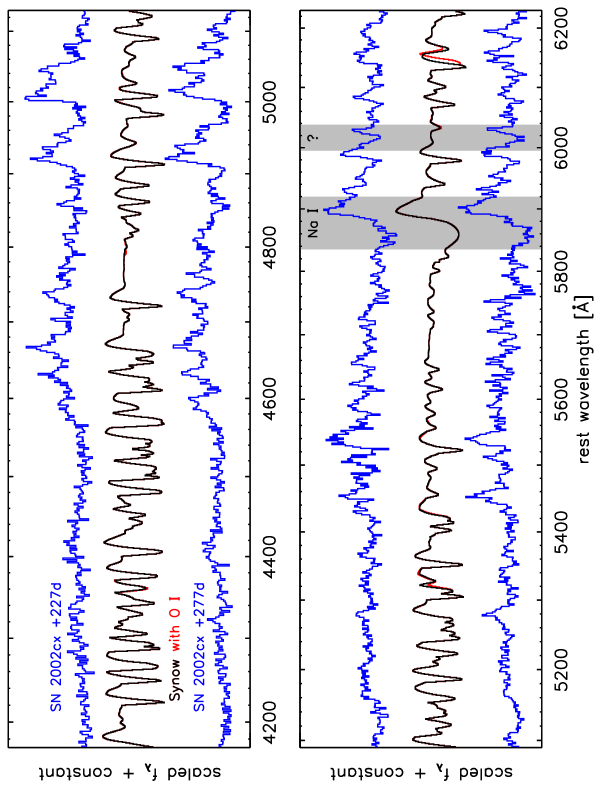
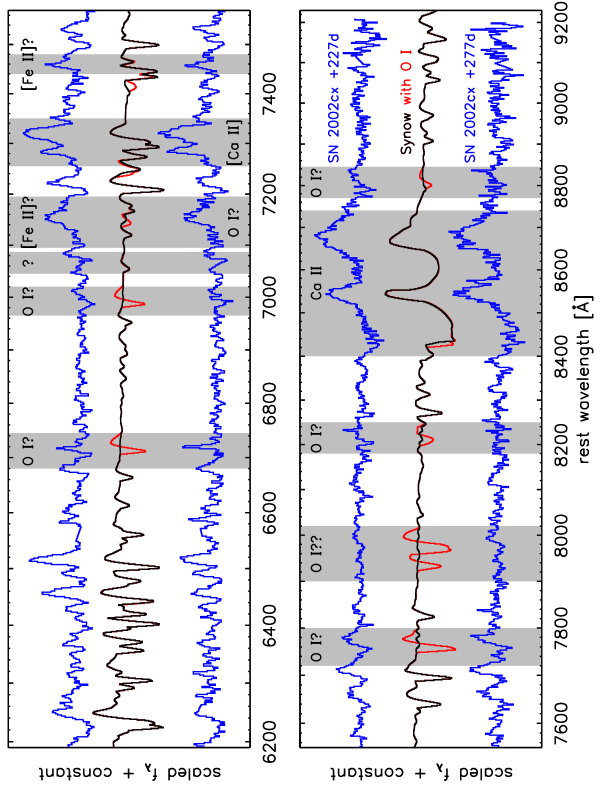
To study the relatively narrow features in the and day spectra, we need a closer look, provided in the four panels of Figure 3. We also present the higher-resolution red spectrum from February 28 overplotted on the other spectra (shifted and scaled to match) in Figure 4, showing that the SN lines are resolved in both the low and high-resolution data (unlike the narrow emission lines of H, [N II], and [S II] from the H II region).
We adopted two approaches to identifying the narrow lines in the SN 2002cx spectra. First we attempted to match them with expected forbidden lines of Co and Fe, but these efforts were largely unsuccessful. Our calculations assumed simple local thermodynamic equilibrium (LTE), and though better models of the expected forbidden-line emission are surely warranted, most of the wavelengths of the observed narrow lines in SN 2002cx do not correspond well to strong lines of [Fe I], [Fe II], [Fe III], [Co I], [Co II], or [Co III].
Our second approach was prompted by the similarity of the late-time spectra to the day spectrum, and we explored the idea that the same permitted lines seen at earlier times, but now at lower velocities, could explain the observed late-time spectra. To this end we employed the fast synthetic spectrum code Synow (Branch et al., 2003b, 2004a, 2004b), continuing the analysis of Branch et al. (2004a) to these later spectra. In Figure 3 we display a Synow synthetic spectrum designed to match the day spectrum. The model spectrum (in black) consists of only three ions: Fe II, Na I, and Ca II, with a photospheric velocity of 650 . For each ion Table 2 lists the wavelength of the reference line, the optical depth at the photosphere, the e–folding velocity for the exponentially declining optical–depth distribution, and the excitation temperature.
| Species | ||||
|---|---|---|---|---|
| (Å) | () | (K) | ||
| Fe II | 5018 | 500 | 1000 | 5000 |
| Ca II | 3934 | 300 | 3000 | 5000 |
| Na I | 5890 | 4 | 1000 | 5000 |
| O I | 7773 | 100 | 1000 | 7000 |
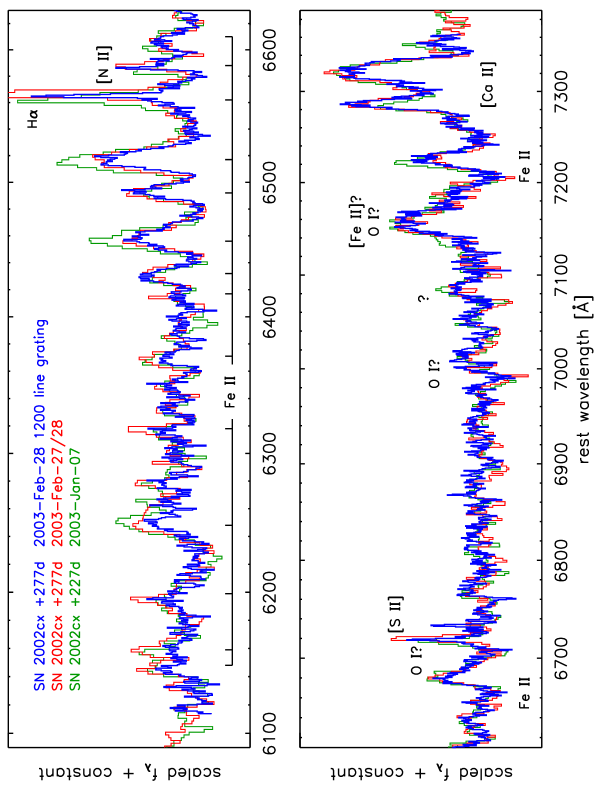
Below 5800 Å, the model spectrum consists almost entirely of P-Cygni profiles of Fe II resonance-scattering features, which can be matched (in wavelength, if not always in relative intensity) to the SN 2002cx spectra starting at approximately 4600 Å. Blueward of this the observed spectra may be affected by line blanketing from neutral species that are not included in the model spectrum. Fe II features are also prominent and well-accounted for in the model between 6200 and 6600 Å, which can be seen most clearly in the top panel of Figure 4, with the synthetic spectrum lines marked below. The iron expansion velocities (measured from peak to trough) are generally consistent over both epochs, but differ slightly for different lines, with for Fe II 5535 and for Fe II 6517. The full-width at half-maximum (FWHM) of the emission part of Fe II 6517 is 650 , measured using the high-resolution spectrum.777The corresponding value in the low-resolution data is 720 , showing the effect of instrumental broadening in the low-resolution data is modest, amounting to 300 in quadrature. This is consistent with the expected broadening based on the instrumental resolution listed in Table 1. We also note that the broader feature underlying the narrow H emission is likely to be Fe II 6562, rather than a detection of hydrogen associated with the supernova. The lines seen here are the narrowest ever detected from a SN Ia; previously the narrowest lines seen were in objects like SN 1991bg at late times, (Mazzali et al., 1997), but those spectra are quite different from SN 2002cx at all epochs (as shown by the spectrum of SN 1999by in Figure 1).
The observed and model spectra also contain features of IMEs, from Na I D and Ca II, which are shown in shaded regions of Figure 3. The profile of Na I 5892 is broader than the iron lines, with a peak to trough velocity of 2200 . The blueward absorption extends to at least 4000 , and may be present all the way to 8000 , but this flux deficit between 5740 and 5820 Å may be caused by Fe II lines. The Ca II IR triplet is seen in emission, in concert with [Ca II] 7291,7324. The forbidden lines have differing measured FWHM of 450 and 900 , but this is likely due to the strong Fe II feature seen in the Synow model spectrum that cuts into the 7291 line profile and makes it seem narrower. The emission components of Ca II 8542 and 8662 have FWHM of 1100 and 2000 .
The SN 2002cx spectra also show tentative evidence for low-velocity O I, which would be the first such detection in a SN Ia. The Synow model spectrum including O I in addition to the three species above is shown in red in Figure 3. The strongest observed features of the putative O I are 7002 (mostly in absorption, with a velocity at the trough of 500-600 , and most clearly visible in Figure 4) and 7773 (with a similar velocity). The low velocities seen in SN 2002cx at these epochs significantly constrains line identifications, and O I seems the most plausible match for these two observed features. Another indication of O I is 6726 absorption, particularly in the day spectrum (the P-Cygni like appearance of the line is probably mostly due to contamination of [S II] 6718 from the H II region). However, the model predicts strong O I 7948 and 7987, which are not clearly observed. Similarly, identifications of O I 8225 and 8820 are dubious at best. While unmodeled non-LTE effects may play a role in the line strengths, on the whole we describe the evidence for O I in SN 2002cx at late times as marginal. As we discuss below, however, its presence at these extremely low velocities would have significant implications for explosion models.
One possibly important feature is the narrow emission near 7160 Å (with FWHM of 950 ); this could be O I 7157, but it would contrast with the other potential O I lines, which are mostly in absorption. A more plausible identification of the emission is [Fe II] 7155, which may be corroborated by the observed [Fe II] 7453 emission (a weaker transition from the same upper level). If correct, the presence of these forbidden iron lines in the red, coupled with their absence in the blue (specifically, missing strong lines such as [Fe II] 4289 and 5160) attests to how radically different SN 2002cx is from normal SNe Ia.
It is remarkable that many of the features in the observed SN 2002cx spectra can be well-matched to a synthetic spectrum with only four species. Nonetheless, there are still observed lines for which there is no very plausible identification as Fe II, Na I, Ca II, or O I. The strongest of these are the P-Cygni profiles with emission peaks near 6030 and 7080 Å, denoted with a question mark in Figures 3 and 4, and there are many more differences in detail between the observed and Synow model spectra.
While more sophisticated modeling of these late-time spectra is clearly necessary, we can make some initial attempts at discerning physical conditions in SN 2002cx. The mere presence of P-Cygni profiles of resonance lines implies the ejecta must still be producing a continuum or pseudo-continuum, at odds with the optically thin models of normal SNe Ia at these epochs. The best-guess Synow model starts with a relatively hot thermal continuum (15,000 K) in attempting to match the observed spectra, but this overpredicts the flux below 4600 Å and above 7500 Å. Moreover, the observations likely suffer from contamination in the blue from an underlying star cluster, further confounding attempts at identifying a continuum from SN 2002cx.
The observed forbidden lines also provide temperature and density diagnostics: for example, the [Ca II] emission strength is on the same order as the IR triplet emission, typical of gas with an electron number density cm-3 (Ferland & Persson, 1989; Fransson & Chevalier, 1989). Such a high density could explain the lack of other forbidden lines that might otherwise be expected, such as [O I] 6300. This high density would also imply a high mass at low velocity: a naive calculation based on a constant velocity expansion of 700 over 300 days after the explosion yields a mass of 0.4 to 1.0 , assuming a filling factor of 0.3 and a mean atomic weight = 20 to 50. However, this estimate is uncertain because of clumping or otherwise more complicated emission regions. The data do suggest a gradient in conditions; for example, the IR triplet lines are broader than the forbidden emission. Additionally, if the feature near 7160 Å is [Fe II] 7155, the presence of both forbidden and permitted iron lines suggests a lower density, cm-3 (e.g., Verner et al., 2002). In this case, the lack of [Fe II] emission in the blue may indicate a relatively low excitation temperature 3000 K, which would suppress otherwise strong lines like 4289 and 5160 that originate from a higher energy level than 7155. We reiterate, however, that a more detailed analysis including non-LTE effects is required for a definitive interpretation of the spectra.
4 Discussion
The standard model for a thermonuclear supernova is the explosion of a C/O white dwarf, but the details of this process that lead to the observed general homogeneity and correlated differences (in luminosity, light-curve shape, and spectral features) among SNe Ia are not fully understood. Open questions at the forefront of current research include (for a review, see Hillebrandt & Niemeyer, 2000) the nature of the nuclear burning front, and in particular, whether it remains a subsonic deflagration or if a transition to a detonation is required (pure detonations are ruled out due to overproduction of iron-peak elements at the expense of IMEs); the site and number of ignition points; and even more basic unsettled issues such as the mass of the white dwarf (Chandrasekhar or sub-Chandra) and the nature of the companion star (single degenerate vs. double degenerate systems).
Peculiar objects like SN 2002cx hold the promise of defining the fringes of the distribution, and from their differences, may indirectly help to explain the properties of normal SNe Ia as well. Under the assumption that the explosion leads to homologous expansion, so that expansion velocities can be used as a proxy for radius, the important characteristics of SN 2002cx, based on its light curve (Li et al., 2003a), early-time spectra (Branch et al., 2004a), and late-time spectra are as follows:
1. Low expansion velocities at all epochs, with iron features at 7000 near maximum, 2000 in the day spectrum, and 700 in the late-time spectra. This implies the presence of fully burned (i.e., to the iron peak) material in all layers, and low kinetic energy in the ejecta.
2. Very low peak luminosity (similar to SN 1991bg-like objects), implying the production of only a small amount of 56Ni that powers the light curve (Arnett, 1982; Pinto & Eastman, 2000).
3. Moderate post-maximum decline rate in ( mag), but a much slower decline and broader light curve in , and a very slow late-time decline compared to all other SNe Ia.
4. SN 1991T-like Fe III features dominating the early time spectrum, implying the outer layers were relatively hot (Nugent et al., 1995).
5. Intermediate-mass elements present in all layers: Na, Si, S, and Ca seen at early times (); Na (700–4000 ) and Ca (700–2000 ) seen at late times.
6. Permitted Fe II lines and continuum or pseudo-continuum flux at late times (when normal SNe Ia are in the nebular phase), suggesting a relatively high density and large mass at low velocity.
7. Possible presence of O I at low velocity (500–1000 ) in the late-time spectra, implying unburned material in the inner layers.
Li et al. (2003a) concluded that no published one-dimensional SN Ia explosion model could reproduce all of the observed properties of SN 2002cx. Indeed, the late-time spectra further suggest that iron-peak and intermediate-mass elements are mixed throughout the ejecta, with unburned material possibly detected close to the center. This all points away from a fully stratified radial structure, and suggests three-dimensional models may be required. Branch et al. (2004a) noted that recent three-dimensional models of pure deflagrations in a Chandrasekhar-mass C/O white dwarf may hold promise for explaining observations of SN 2002cx.
The results of Reinecke, Hillebrandt, & Niemeyer (2002) and Gamezo et al. (2003) suggest that the convoluted structure of the turbulent flame in pure deflagrations generically predict ejecta of mixed composition, and the presence of partially burned (IMEs) and unburned material (C and O) near the white dwarf center. This latter point is generally considered a shortcoming of the model since low-velocity oxygen or carbon is not seen in typical SNe Ia. It may be hidden at early times (Baron, Lentz, & Hauschildt, 2003), but if present, should be detectable at late times in nebular spectra of normal SNe Ia (Kozma et al., 2005). Gamezo, Khokhlov, & Oran (2004, 2005) show that artificially introducing a transition to a delayed detonation into their deflagration model causes a new burning front to sweep through the unburned and partially burned central material, leaving only iron-peak elements in the core, and bringing the model in accord with observations.
In this framework, the strong evidence for partially burned material (intermediate mass elements) and tentative evidence for unburned material (oxygen) near the center of SN 2002cx can naturally be explained by a pure deflagration (or otherwise stopping the detonation wave from reaching the center). Furthermore, Gamezo et al. (2005) find their deflagration model produces about 40% of the total energy and 56Ni mass of their delayed detonation model, which could explain both the low ejecta velocities and the subluminosity of SN 2002cx relative to normal SNe Ia. However, the SN 2002cx spectra presented here do not match the deflagration model spectra of Kozma et al. (2005), which predict a forbidden-line dominated spectrum, including very strong [O I] 6300. While the lack of this emission in the observed spectra is qualitatively consistent with the high density inferred from the forbidden-line density diagnostics, it may be a difficult challenge for deflagration models to maintain such high densities and large mass at low velocities. Moreover, it will be important to explore whether the other peculiar properties of SN 2002cx (its early-time SN 1991T-like spectrum and its distinct light curve) are natural predictions of a pure-deflagration model. If future deflagration models prove successful at explaining SN 2002cx, this could help establish the tantalizing possibility that normal SNe Ia require a transition to a delayed detonation or something similar, lest they all look like SN 2002cx.
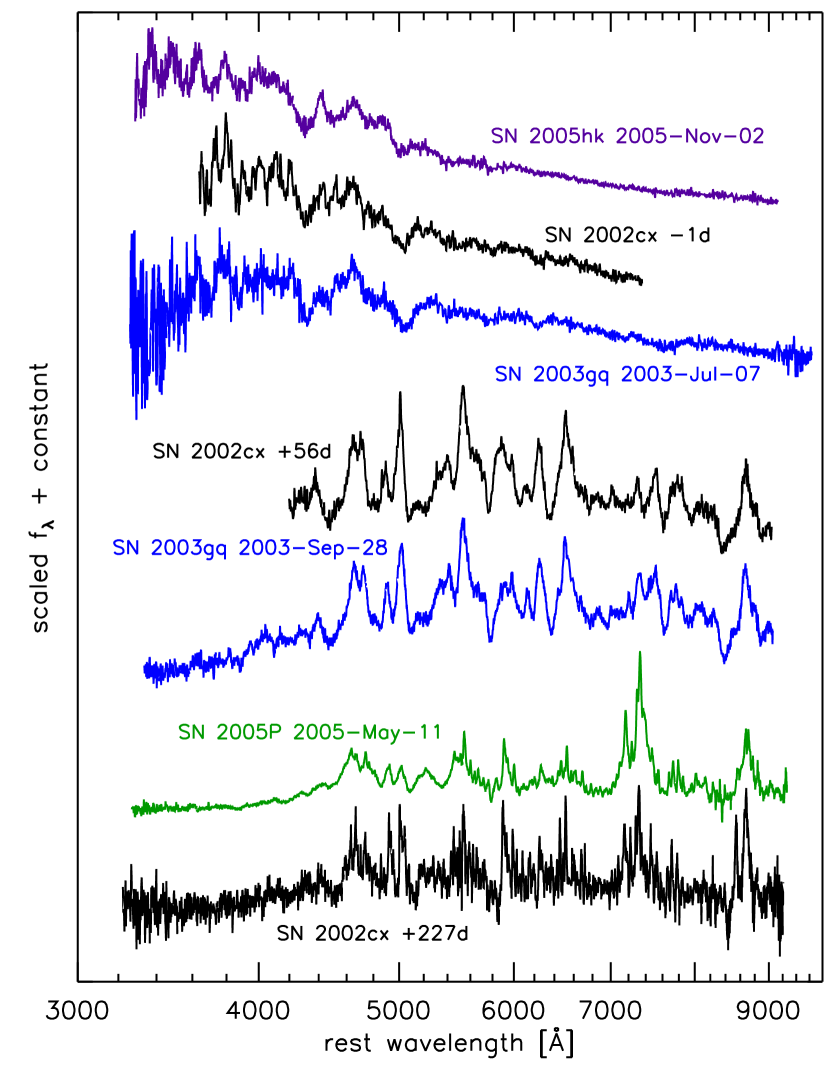
Furthermore, recent observations have shown that SN 2002cx is no longer a unique object. In Figure 5, we present a comparison of SN 2002cx with three other SNe Ia in our spectral database, showing remarkable similarities. SN 2003gq (Puckett & Langoussis, 2003; Graham, Weisz, & Li, 2003) was classified as a 1991T-like SN Ia from its early-time spectrum (2003 July 7) shown in Figure 5, with Fe III features and weak Ca II and Si II (Filippenko, Foley, & Desroches, 2003), but it developed SN 2002cx-like features at later times (Filippenko & Chornock, 2003); the spectrum of SN 2003gq on 2003 September 28 is nearly identical (amazingly so) to the day spectrum of SN 2002cx. In addition, a spectrum of SN 2005P (Burket & Li, 2005b), obtained on 2005 January 23 by P. Wood and B. Schmidt (priv. communication), was identified by one of us (RC) as an analogue of SN 2002cx. We obtained a spectrum of SN 2005P on 2005 May 11, shown in Figure 5, which seems to be at an intermediate epoch between the day and spectra of SN 2002cx. A third object, SN 2005cc (Puckett & Langoussis, 2005), has also been shown to have SN 2002cx-like features, and may have been observed a week before maximum light (Antilogus et al., 2005). Finally, SN 2005hk (Burket & Li, 2005a; Barentine et al., 2005) was classified as a SN 1991T-like object based on an spectrum taken a week before maximum light (Serduke et al., 2005). This spectrum is also shown in Figure 5; subsequent photometry and spectroscopy of SN 2005hk reveal it to be similar to SN 2002cx (Chornock et al. 2006; Phillips et al. 2006, in preparation).
SN 2002cx is thus the prototype of a new class of peculiar SNe Ia. The striking spectral homogeneity within this subclass suggests these objects should share a common explanation. As discussed by Li et al. (2003b), SN 2002cx-like objects are certainly SNe Ia: their maximum-light spectra show the same features as SNe Ia like SN 1991T, and these similarities persist for a significant time (compare, for example, SN 2002cx and the normal SN Ia 1998aq at two months past maximum in Figure 1). Though these features are at lower velocities in the SN 2002cx subclass, this in itself is not a compelling reason to exclude them as SNe Ia as traditionally (spectroscopically) defined. Nonetheless, the large differences between this subclass and other SNe Ia may require a radically different model for these objects, perhaps much more significant than just a pure deflagration. Still more speculative models, such as “failed” SNe Ia in which the white dwarf is not completely disrupted (e.g., Livne, Asida, & Höflich, 2005, and references therein), or perhaps even core-collapse scenarios, may be necessary. Note, however, that normal stripped-envelope supernovae exhibit very strong [O I] 6300 emission at late times; hence, a successful core-collapse model for SN 2002cx-like objects would have to differ substantially from typical SNe Ib/Ic.
Additional observations will test these speculations. Because SN 2005P (host NGC 5468; 2842 ; Koribalski et al. 2004), SN 2005cc (NGC 5383; 2270 ; van Driel et al. 2001), and SN 2005hk (UGC 272; 3912 ; Abazajian et al. 2003) are relatively nearby, they provide promising opportunities to study members of the SN 2002cx subclass at even later epochs and over a wider wavelength region than the data presented here. It will be especially important to confirm the low-velocity unburned material suggested by the SN 2002cx spectra, through a definitive identification of oxygen or carbon lines at late times. The properties of this subclass are just beginning to be explored, but already their spectral similarities will significantly constrain models; for instance a pure deflagration or other successful model of this subclass should generically produce a hot outer layer with Fe III features in spectra near maximum light. In addition, all five of these SN 2002cx-like objects occurred in blue, star-forming spiral galaxies, further connecting them to SN 1991T-like objects (Hamuy et al., 2000), and making the subluminosity of SN 2002cx and its analogues all the more puzzling. The existence of this class may also disfavor tuned or potentially “rare” models, depending on the homogeneity among these objects and their frequency relative to normal SNe Ia. For example, the identification of several such SNe (and their location in late-type hosts) disfavors a suggested model of Kasen et al. (2004), who hypothesized that SN 2002cx was an intrinsically subluminous explosion like SN 1991bg, viewed from a special geometry through a hole in the ejecta to produce a hotter spectrum at lower velocities. While the application of conclusions based on SN 2002cx-like objects may not directly answer all of the outstanding questions regarding the vast majority of normal SNe Ia, further observations of these examples on the fringe are certain to be illuminating.
References
- Abazajian et al. (2003) Abazajian, K. et al. 2003, AJ, 126, 2081
- Antilogus et al. (2005) Antilogus, P. et al. 2005, The Astronomer’s Telegram, 502, 1
- Arnett (1982) Arnett, W. D. 1982, ApJ, 253, 785
- Axelrod (1980) Axelrod, T. S. 1980, Ph.D. Thesis, University of California, Santa Cruz
- Barentine et al. (2005) Barentine, J. et al. 2005, Central Bureau Electronic Telegrams, 268, 1
- Baron et al. (2003) Baron, E., Lentz, E. J., & Hauschildt, P. H. 2003, ApJ, 588, L29
- Branch et al. (2003a) Branch, D., Baron, E., & Jeffery, D. J. 2003a, LNP Vol. 598: Supernovae and Gamma-Ray Bursters, 598, 47
- Branch et al. (2004a) Branch, D., Baron, E., Thomas, R. C., Kasen, D., Li, W., & Filippenko, A. V. 2004a, PASP, 116, 903
- Branch et al. (2003b) Branch, D. et al. 2003b, AJ, 126, 1489
- Branch et al. (2004b) —. 2004b, ApJ, 606, 413
- Burket & Li (2005a) Burket, J., & Li, W. 2005a, IAU Circ., 8625, 2
- Burket & Li (2005b) —. 2005b, IAU Circ., 8472, 1
- Chornock et al. (2006) Chornock, R., Filippenko, A. V., Branch, D., Foley, R. J., Jha, S., & Li, W. 2006, PASP, in press (astro-ph/0603083)
- Falco et al. (1999) Falco, E. E. et al. 1999, PASP, 111, 438
- Ferland & Persson (1989) Ferland, G. J., & Persson, S. E. 1989, ApJ, 347, 656
- Filippenko (1982) Filippenko, A. V. 1982, PASP, 94, 715
- Filippenko (1997) —. 1997, ARA&A, 35, 309
- Filippenko & Chornock (2003) Filippenko, A. V., & Chornock, R. 2003, IAU Circ., 8211, 2
- Filippenko et al. (2003) Filippenko, A. V., Foley, R. J., & Desroches, L. 2003, IAU Circ., 8170, 2
- Filippenko et al. (1992a) Filippenko, A. V. et al. 1992a, AJ, 104, 1543
- Filippenko et al. (1992b) —. 1992b, ApJ, 384, L15
- Fransson & Chevalier (1989) Fransson, C., & Chevalier, R. A. 1989, ApJ, 343, 323
- Gamezo et al. (2004) Gamezo, V. N., Khokhlov, A. M., & Oran, E. S. 2004, Physical Review Letters, 92, 211102
- Gamezo et al. (2005) —. 2005, ApJ, 623, 337
- Gamezo et al. (2003) Gamezo, V. N., Khokhlov, A. M., Oran, E. S., Chtchelkanova, A. Y., & Rosenberg, R. O. 2003, Science, 299, 77
- Garnavich et al. (2004) Garnavich, P. M. et al. 2004, ApJ, 613, 1120
- Gómez & López (1998) Gómez, G., & López, R. 1998, AJ, 115, 1096
- Graham et al. (2003) Graham, J., Weisz, D., & Li, W. 2003, IAU Circ., 8168, 1
- Hamuy et al. (2000) Hamuy, M., Trager, S. C., Pinto, P. A., Phillips, M. M., Schommer, R. A., Ivanov, V., & Suntzeff, N. B. 2000, AJ, 120, 1479
- Hillebrandt & Niemeyer (2000) Hillebrandt, W., & Niemeyer, J. C. 2000, ARA&A, 38, 191
- Kasen et al. (2004) Kasen, D., Nugent, P., Thomas, R. C., & Wang, L. 2004, ApJ, 610, 876
- Kirshner & Oke (1975) Kirshner, R. P., & Oke, J. B. 1975, ApJ, 200, 574
- Koribalski et al. (2004) Koribalski, B. S. et al. 2004, AJ, 128, 16
- Kozma et al. (2005) Kozma, C., Fransson, C., Hillebrandt, W., Travaglio, C., Sollerman, J., Reinecke, M., Röpke, F. K., & Spyromilio, J. 2005, A&A, 437, 983
- Leibundgut et al. (1993) Leibundgut, B. et al. 1993, AJ, 105, 301
- Li et al. (2003a) Li, W. et al. 2003a, PASP, 115, 453
- Li et al. (2003b) Li, W., Filippenko, A. V., Chornock, R., & Jha, S. 2003b, ApJ, 586, L9
- Livne et al. (2005) Livne, E., Asida, S. M., & Höflich, P. 2005, ApJ, 632, 443
- Matheson et al. (2000) Matheson, T. et al. 2000, AJ, 120, 1487
- Mazzali et al. (1998) Mazzali, P. A., Cappellaro, E., Danziger, I. J., Turatto, M., & Benetti, S. 1998, ApJ, 499, L49
- Mazzali et al. (1997) Mazzali, P. A., Chugai, N., Turatto, M., Lucy, L. B., Danziger, I. J., Cappellaro, E., della Valle, M., & Benetti, S. 1997, MNRAS, 284, 151
- Milne et al. (2001) Milne, P. A., The, L.-S., & Leising, M. D. 2001, ApJ, 559, 1019
- Nugent et al. (1995) Nugent, P., Phillips, M., Baron, E., Branch, D., & Hauschildt, P. 1995, ApJ, 455, L147
- Oke et al. (1995) Oke, J. B. et al. 1995, PASP, 107, 375
- Phillips et al. (1992) Phillips, M. M., Wells, L. A., Suntzeff, N. B., Hamuy, M., Leibundgut, B., Kirshner, R. P., & Foltz, C. B. 1992, AJ, 103, 1632
- Pinto & Eastman (2000) Pinto, P. A., & Eastman, R. G. 2000, ApJ, 530, 744
- Puckett & Langoussis (2003) Puckett, T., & Langoussis, A. 2003, IAU Circ., 8168, 1
- Puckett & Langoussis (2005) —. 2005, IAU Circ., 8534, 1
- Reinecke et al. (2002) Reinecke, M., Hillebrandt, W., & Niemeyer, J. C. 2002, A&A, 391, 1167
- Ruiz-Lapuente et al. (1995) Ruiz-Lapuente, P., Kirshner, R. P., Phillips, M. M., Challis, P. M., Schmidt, B. P., Filippenko, A. V., & Wheeler, J. C. 1995, ApJ, 439, 60
- Serduke et al. (2005) Serduke, F. J. D., Wong, D. S., & Filippenko, A. V. 2005, Central Bureau Electronic Telegrams, 269, 1
- van Driel et al. (2001) van Driel, W., Marcum, P., Gallagher, J. S., Wilcots, E., Guidoux, C., & Monnier Ragaigne, D. 2001, A&A, 378, 370
- Verner et al. (2002) Verner, E. M., Gull, T. R., Bruhweiler, F., Johansson, S., Ishibashi, K., & Davidson, K. 2002, ApJ, 581, 1154