Infrared Dark Clouds: precursors to star clusters
Abstract
Infrared Dark Clouds (IRDCs) are dense molecular clouds seen as extinction features against the bright mid-infrared Galactic background. Millimeter continuum maps toward 38 IRDCs reveal extended cold dust emission to be associated with each of the IRDCs. IRDCs range in morphology from filamentary to compact and have masses of 120 to 16,000 , with a median mass of 940 . Each IRDC contains at least one compact (0.5 pc) dust core and most show multiple cores. We find 140 cold millimeter cores unassociated with MSX 8 m emission. The core masses range from 10 to 2,100 , with a median mass of 120 . The slope of the IRDC core mass spectrum ( 2.1 0.4) is similar to that of the stellar IMF. Assuming that each core will form a single star, the majority of the cores will form OB stars. IRDC cores have similar sizes, masses, and densities as hot cores associated with individual, young high-mass stars, but they are much colder. We therefore suggest that IRDC represent an earlier evolutionary phase in high-mass star formation. In addition, because IRDCs contain many compact cores, and have the same sizes and masses as molecular clumps associated with young clusters, we suggest that IRDCs are the cold precursors to star clusters. Indeed, an estimate of the star formation rate within molecular clumps with similar properties to IRDCs ( 2 yr-1) is comparable to the global star formation rate in the Galaxy, supporting the idea that all stars may form in such clumps.
1 Introduction
Although high-mass stars (6 ) have a profound effect on the Galactic environment and are responsible for recycling and enriching interstellar matter, their early evolutionary phases are not well known. Because they evolve rapidly, high-mass stars have a short lifetime. In addition, high-mass stars emit copious amounts of UV photons, which quickly heat, ionize, and disrupt their natal molecular clouds. Thus, direct observations of their earliest stages are difficult.
Because high-mass stars invariably form in star clusters, to understand high-mass star formation it is important to study the earliest stages in the formation of star clusters. Molecular line, infrared (IR), and millimeter continuum studies of young, embedded clusters show that star clusters form from small (0.5–1 pc), massive (100–1000 ), and dense (104–106 ) molecular clumps within a giant molecular cloud (see Table 1; Lada & Lada, 2003; Motte et al., 2003). Cluster-forming clumps have star-formation efficiencies of 10–30% and a highly fragmented sub-structure (Lada et al., 1997). Within these clumps, the densest, most compact sub-structures, called “cores”, give rise to individual stars.
The emerging picture of star formation begins with the fragmentation of a molecular cloud (e.g. Shu et al., 1987). Observational evidence suggests that molecular clouds are fragmented on all size scales (Williams et al., 2000). The cloud eventually condenses into cold, gravitationally bound starless cores. As the core becomes centrally concentrated and begins to collapse gravitationally, a protostar and disk system is formed as material is accreted from its surroundings. Soon thereafter, bipolar outflows and jets are formed as a consequence of the accretion process. The central star then emerges from the molecular cloud to be an optically visible main-sequence star.
For low-mass stars, the theory is well developed (e.g. Shu, 1991), and all of these evolutionary stages are observed (e.g. Lada, 1999). The earliest stage in the formation of low-mass stars are identified as Bok globules. These are isolated, well-defined patches of optical obscuration (Av=1–25 mag) viewed against background stars (Bok & Reilly, 1947). Because of their isolation and uncomplicated environments, Bok globules have been studied extensively and have provided an excellent observational perspective of the initial conditions within low-mass star-forming molecular clouds. Many studies of Bok globules have used optical and IR star counts to trace their visual extinctions and, hence, have measured their column densities, masses, and internal structure (e.g. Lada et al., 1994; Alves et al., 2001; Lombardi & Alves, 2001). Bok globules have small sizes (0.1–2 pc), characteristic masses of 1–100 , and a simple morphology (see Table 1; Leung, 1985; Clemens & Barvainis, 1988; Bourke et al., 1995).
Within Bok globules, the dense, compact pre-cursors to the individual protostars are found. These so-called “pre-protostellar cores” have low temperatures ( 10 K), compact sizes (0.05 pc), low masses (0.5–5 ), and high densities (105–106 ; see Table 1; e.g. Myers & Benson, 1983; Ward-Thompson et al., 1994). Once the embedded protostar begins to evolve toward the main-sequence, it emits strongly in the IR (e.g. Lada & Wilking, 1984; Adams et al., 1987) and reveals molecular outflows, jets, and Herbig-Haro objects (e.g. Snell et al., 1980; Bally & Lada, 1983; Fukui et al., 1993).
In contrast, the early evolution of high-mass stars is not as well understood. Observationally, the earliest known, well-characterized phase of high-mass star formation is associated with a special class of molecular cores called “hot cores.” Hot cores are internally heated (50–250 K), small (0.1 pc), massive (100–300 ), and dense (105–108 ; see Table 1; Garay & Lizano, 1999; Kurtz et al., 2000; Churchwell, 2002). In the later stage of the hot core phase, molecular outflows and maser emission appear, both of which are signatures of an accretion disk (Garay & Lizano, 1999; Kurtz et al., 2000). This stage marks the appearance of ultra-compact regions, the small, dense regions of ionized gas which surround the embedded high-mass main-sequence star.
These observed early evolutionary stages of high-mass stars represent a phase after the central protostar has already formed. A complete understanding of the formation of high-mass stars, however, must begin with an earlier phase, before the formation of the protostar. Presumably, high-mass stars will also proceed through stages analogous to the Bok globules and pre-protostellar cores found in the case of low-mass star formation. So far, however, observational examples of these phases for high-mass stars have remained elusive.
By analogy, we expect the high-mass equivalents of Bok globules and high-mass starless cores also to be cold. However, because they are the precursors to high-mass stars, they should have larger sizes, masses, column densities, and volume densities. Because the high-mass Bok globule analogs are likely to be cold and very dense, one might expect to detect them as extinction features and to trace their internal structure through millimeter/submillimeter continuum imaging.
We suggest that the earliest stage of high-mass star formation occurs within infrared dark clouds (IRDCs). IRDCs are defined as regions of high extinction viewed against the bright, diffuse mid-IR Galactic background. IRDCs, first detected by ISO and then by MSX (Perault et al., 1996; Egan et al., 1998; Hennebelle et al., 2001), are ubiquitous throughout the Galaxy (Simon et al., 2006a). Previous studies show that their molecular material has low temperatures ( 25K), high column densities ( 1023–1025 ), and high volume densities (105 ; Egan et al., 1998; Carey et al., 1998, 2000). A recent molecular line study of a large sample of IRDCs establishes their kinematic distances and shows that their Galactic distribution is enhanced towards the Galaxy’s most massive star forming structure, the so-called 5 kpc ring (Simon et al., 2006b). Millimeter/submillimeter studies of a few IRDCs show that they harbor compact cores (Lis & Carlstrom, 1994; Carey et al., 2000; Redman et al., 2003; Garay et al., 2004; Ormel et al., 2005; Rathborne et al., 2005).
We have developed an algorithm (Simon et al., 2006a) to identify IRDCs as regions within the MSX 8 m Galactic Plane Survey (Price et al., 2001) that have a significant decremental contrast111Defined as contrast=(background-image)/background. against a modelled background. IRDCs were identified from contrast images if they met two conditions; (1) they must be regions of contiguous pixels whose measured contrast lies at least 2 above the instrumental noise, and (2) they must have solid angles 1,200 square arcsec. Because the Galactic background is highly variable, the signal-to-noise, and hence the significance level, is non-uniform for this sample. Simon et al. (2006a) find 10,961 IRDCs meeting these criteria222IRDCs from this catalog are called “MSXDC G” followed by their Galactic coordinates. For simplicity we will drop the “MSXDC” labels in the text..
Because IRDCs are extinction features seen against the Galactic mid-IR background, their identification is strongly biased toward nearby clouds and clouds that lie in front of bright mid-IR background emission. Almost certainly, clouds with identical temperatures, sizes, masses, column densities, and volume densities as known IRDCs have escaped detection. These undetected clouds will preferentially lie on the far side of the Galaxy, behind the bulk of the Galaxy’s diffuse mid-IR emission, or in the outer Galaxy, where the Galactic mid-IR background is faint.
Because IRDCs are cold, their thermal dust emission peaks at millimeter/submillimeter wavelengths. Consequently, we can best study their internal structure by imaging at these wavelengths. A further advantage is that the dust emission at millimeter wavelengths is optically thin. Thus, unlike optically thick molecular line emission, the millimeter dust continuum is a more accurate tracer of column density and mass.
In this paper, we show that IRDCs are cold molecular clumps with sizes and masses identical to those of the warmer cluster-forming clumps. Moreover, we find that IRDCs contain compact cores with sizes, masses, and densities comparable to high-mass star-forming hot cores, the only obvious difference being that IRDC cores are colder. We therefore suggest that IRDCs are the cluster-forming, high-mass analogs to Bok globules, and their embedded cores the precursors to individual high-mass protostars.
2 Observations
For this study, we selected the 38 darkest IRDCs with known kinematic distances from the sample of Simon et al. (2006b). The local standard of rest (LSR) velocity for each IRDC was determined from a morphological match of the mid-IR extinction to 13CO emission from the Boston University–Five College Radio Astronomy Observatory Galactic Ring Survey (Simon et al., 2001; Jackson et al., 2006). Velocities were converted to a Galactocentric radius and kinematic distance using the Clemens (1985) rotation curve333For the portion of the Galaxy sampled, the use of the more recent Brand & Blitz (1993) rotation curve does not significantly alter the derived distances and therefore will not affect any of our conclusions. scaled to R0=8.5 kpc and =220 km s-1. Because IRDCs are extinction features, they are assumed to lie at the near kinematic distance. The IRDCs within our sample show the highest peak contrast relative to the extended mid-IR background ( 36%) and span a broad range in distance and Galactic location.
The 1.2 mm continuum data toward the IRDCs were obtained at the Institut de Radioastronomie Millimétrique (IRAM) 30 m telescope using the 117 element bolometer array MAMBO II in 2003 December and 2004 January–March. The FWHM angular resolution of each element in the array is 11″. The angular separation between array elements is 20″. Because the morphology of the IRDCs ranged from compact to filamentary, we mapped each of the IRDCs using the on-the-fly mapping mode with a size large enough to cover the extent of the mid-IR extinction. The map sizes ranged from 3 to 9. The scanning speed was 6 arcsec s-1 for maps 6 or smaller, and 8 arcsec s-1 for larger maps. To sample the emission fully, all maps were obtained in the ‘sweeping’ mode, where the spacing between sub-scans was set to 22. Pointing and sky-dip calibrations were performed regularly.
All data reduction was achieved within the MOPSI package444MOPSI was developed by Robert Zylka.. All maps were reduced by applying the atmospheric opacity corrections, fitting and subtracting a baseline, and removing the correlated sky noise. Maps were flux calibrated using the conversion factor obtained from the counts detected in observations of Uranus. The rms noise level in each of the final maps is 10 mJy beam-1.
3 Results
3.1 Global Millimeter Emission Characteristics
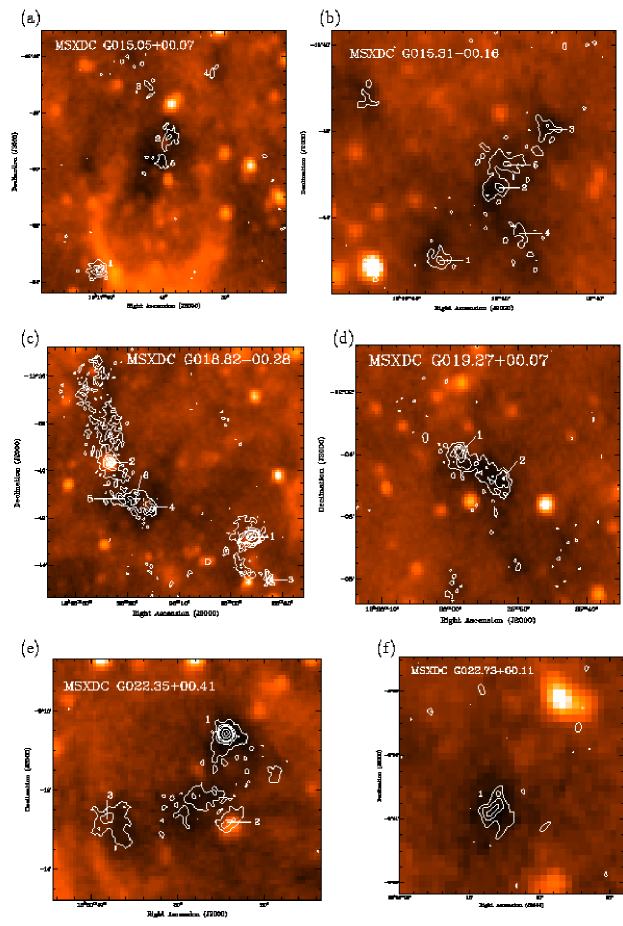
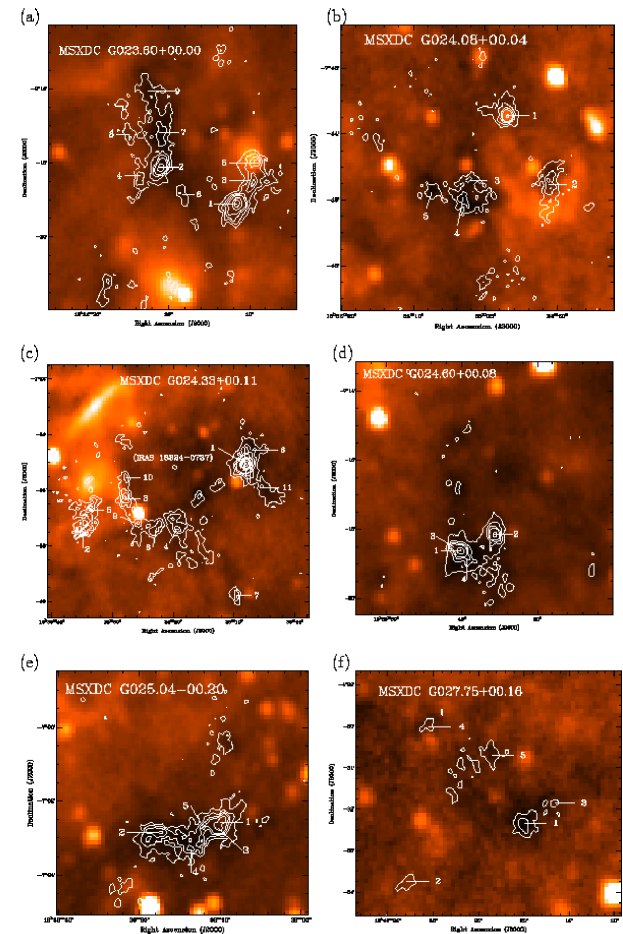
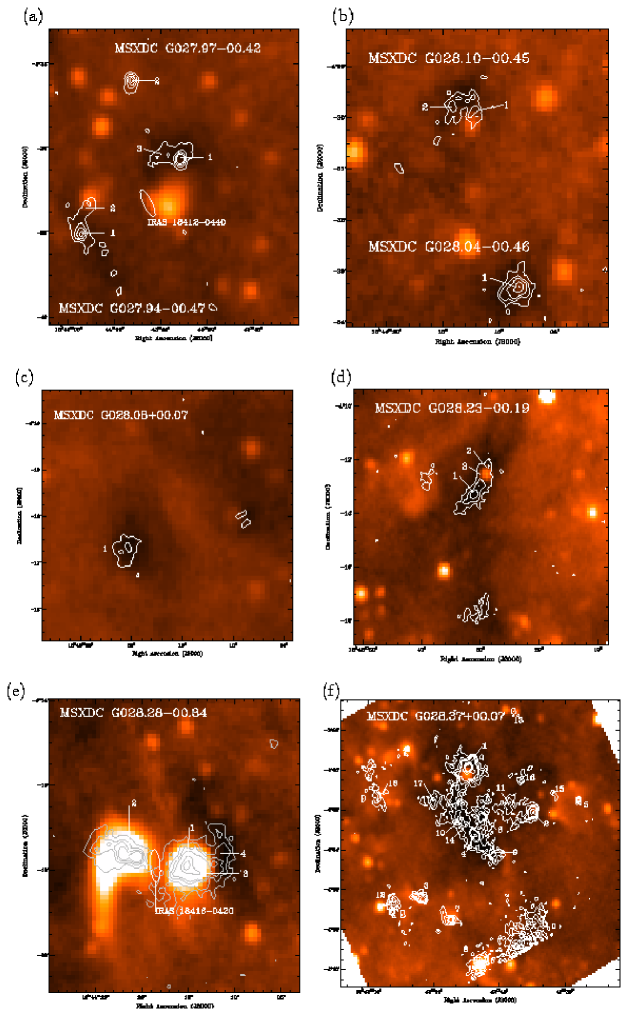
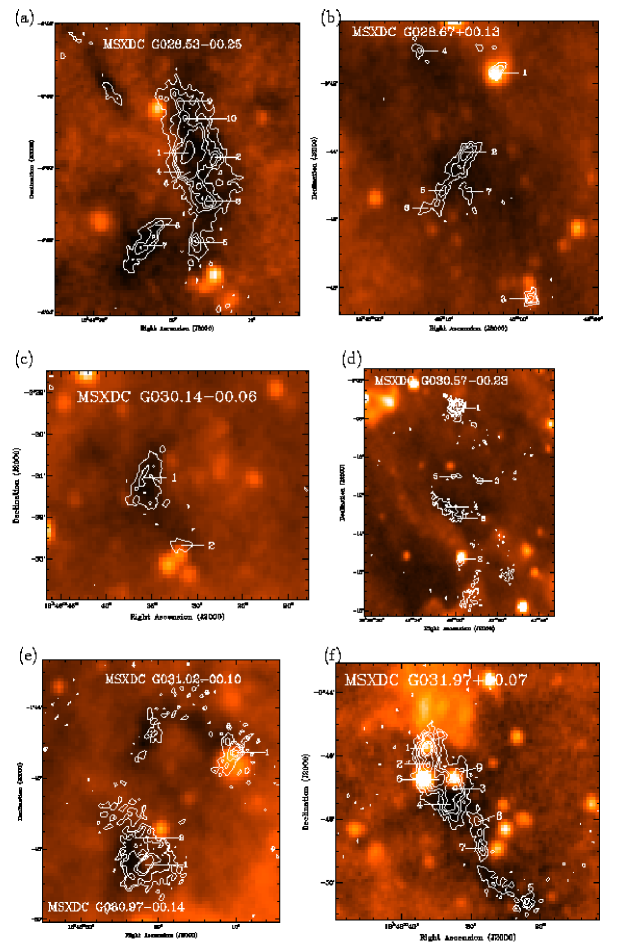
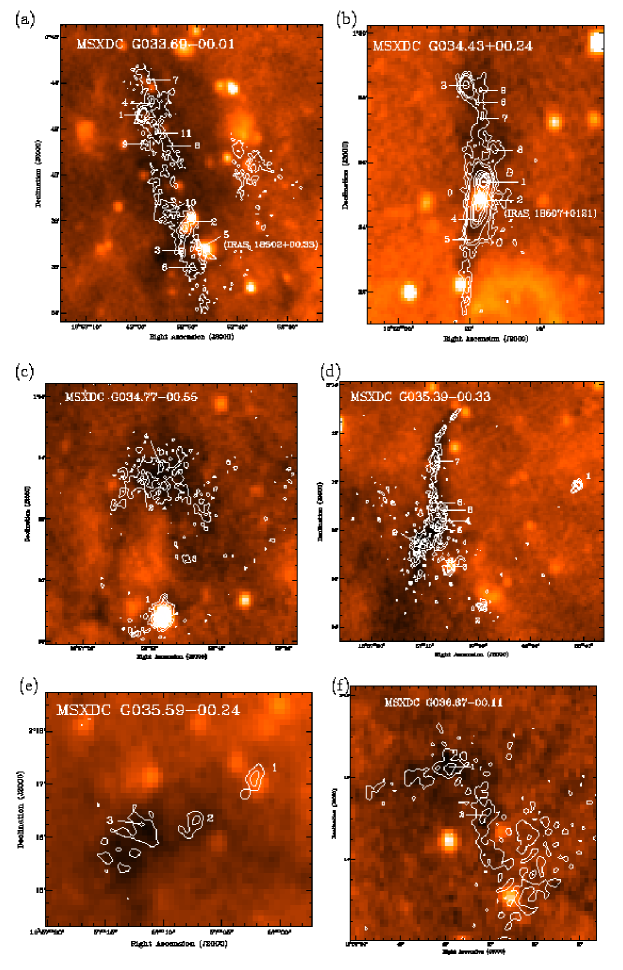
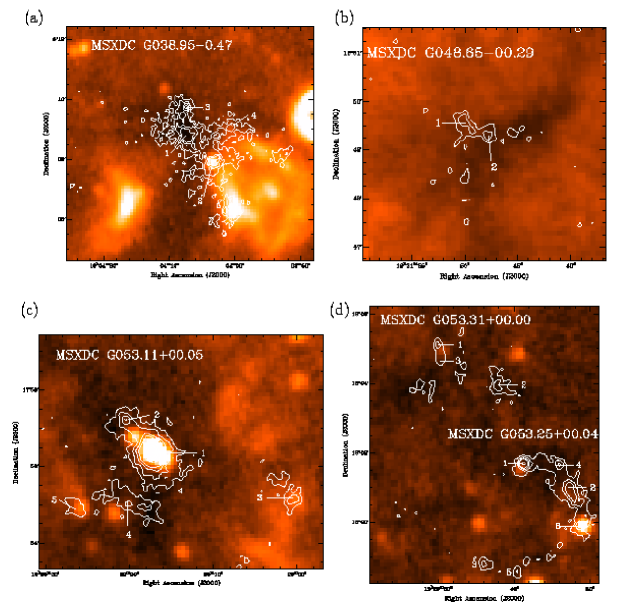
Millimeter continuum emission was detected toward all 38 of the IRDCs observed. Figures 1–6 show the 1.2 mm continuum emission toward each IRDC overlaid on the MSX 8 m image. In all cases, the morphology of the millimeter continuum emission matches the mid-IR extinction extremely well.In addition, all IRDCs have at least one bright, compact millimeter source; most show multiple, compact sources superimposed on fainter, extended emission.
Although IRDCs all exhibit extinction in the mid-IR, their morphologies vary considerably. Their shapes can be simple and unstructured on the one hand, and complex and filamentary on the other. For example, the IRDCs G028.08+00.07 (Fig. 3[c]) and G035.59-00.24 (Fig. 5[e]) show little sub-structure, whereas G034.43+00.24 (Fig. 5[b]) and G035.3900.33 (Fig. 5[d]) are highly filamentary. Some IRDCs also show a complicated internal sub-structure with 10 or more compact cores, for example, G024.33+00.11 (Fig. 2[c]), G028.37+00.07 (Fig. 3[f]), G028.5300.25 (Fig. 4[a]), and G033.6900.01 (Fig. 5[a]).
By eye we have catergorized each IRDC as either “compact” or “filamentary” based on the morphology of the millimeter continuum emission. We find 22 IRDCs are compact, while 16 are filamentary. We find a slight trend for higher mass cores to be found within the filamentary clouds. For compact IRDCs the average mass of the most massive core is 210 . For filamentary IRDCs, however, the average mass of the most massive core is 660 , about a factor of 3 higher.
The degree to which IRDCs are associated with mid-IR continuum emission sources is highly variable. For example, G015.3100.16 (Fig. 1[b]), G022.73+00.11 (Fig. 1[f]), and G024.60+00.08 (Fig. 2[d]) show no obvious association with any mid-IR continuum emission source in MSX 8 m images (to a sensitivity limit of 1.3 MJy sr-1; Price et al., 2001). On the other hand, G028.2800.34 (Fig. 3[e]) and G053.11+00.05 (Fig. 6[c]) appear to be associated with very bright, resolved mid-IR emission sources. There is no obvious correlation between the presence of a bright mid-IR emission source with any millimeter continuum observational characteristic of the IRDC.
3.2 IRDC Masses
Reliable mass estimates of IRDCs using molecular lines are problematic because the lines are often highly opaque and thus do not trace their embedded interiors. In addition, because IRDCs are so cold, molecules are frozen onto dust grains in their centers. Because dust is optically thin and not depleted, it is a better mass tracer. We use the 1.2 mm continuum emission to estimate the cloud mass using the expression
| (1) |
(Hildebrand, 1983), where is the observed integrated source flux density, is the distance, is the dust opacity per gram of dust, and is the Planck function at the dust temperature. We adopt for a value of 1.0 cm2 g-1 (Ossenkopf & Henning, 1994) and assume a gas-to-dust mass ratio of 100. We assume graybody emission with an emissivity index of 2 (Carey et al., 2000; Rathborne et al., 2005). We also assume a dust temperature of 15 K, which is consistent with temperature estimates from molecular line emission (Teyssier et al., 2002), previous observations of a few IRDCs at submillimeter wavelengths (Carey et al., 2000), and the fact that some IRDCs are seen as extinction features up to 100 m (Egan et al., 1998).
The derived masses will be underestimated if the value for is lower than the assumed value of 2 (e.g., of 1 will increase the IRDC masses by about 10%) and overestimated if the temperature is higher than the assumed value of 15 K (e.g., a dust temperature of 30 K will reduce the IRDC masses by 40%). The derived masses are proportional to the assumed value of .
Table 2 lists, in order of increasing Galactic longitude, each of the IRDCs, the coordinates of the peak contrast (Simon et al., 2006a), the LSR velocity (), line width () and kinematic distance (; Simon et al., 2006b), the peak and integrated 1.2 mm flux, and the mass. The integrated 1.2 mm fluxes were obtained by summing the 1.2 mm continuum emission above a 3 level (30 mJy beam-1) over the extent of the mid-IR extinction feature. The total mass of the IRDCs were calculated using the integrated flux and were found to range from 120 to 16,000 , with a median mass of 940 and an average mass of 3,000 . Figures 1–6 show that the millimeter emission associated with each IRDC typically extends a few arcmins, or a few parsecs given their distances.
3.3 Compact Cores
Compact cores were identified by fitting two-dimensional gaussians to the peaks (8) within the 1.2 mm continuum images. Each Gaussian was subtracted before the next was fit until the image contained only extended emission. The number of cores found within each IRDC ranged from 1 to 18. Toward the 38 IRDCs, we detected a total of 188 compact cores, increasing the sample of known cores within IRDCs from 10 (Carey et al., 2000; Redman et al., 2003; Garay et al., 2004).
Table Infrared Dark Clouds: precursors to star clusters lists the properties of the cores, including: their designation, coordinates, peak and integrated 1.2 mm flux, average angular and physical sizes, and mass. The cores are named in order of decreasing peak 1.2 mm flux with the designation “MM” (e.g., MM1, MM2, etc). Because the 1.2 mm images extend beyond the IRDC, they often include nearby, bright millimeter cores that are associated with strong 8 m emission sources (and in some cases IRAS sources). We find 48 of the cores are associated with MSX 8 m emission. These “warm” cores are included within our list, but are marked as being associated with 8 m emission and not an extinction feature (an “em” in the comment column of Table Infrared Dark Clouds: precursors to star clusters). These cores are not included in the following analyses. Thus, removing these “warm” cores from our sample, we find 140 “cold” millimeter cores associated with the 38 IRDCs.
Masses for these compact 1.2 mm cores were calculated from the integrated flux from the two-dimensional Gaussian fit to the core. A histogram of the derived masses for the “cold” compact cores is shown in Figure 7. These cores range in mass from 10 to 2100 , with a median value of 120 . We find that 67% of our sample lies in the mass range 30 to 300 . For masses 100 the distribution is roughly a power law with an index (N/M M-α) of 2.1 0.4. The apparent peak near M45 reflects our completeness limit. Because the cores lie at different distances, the mass detection limit varies from cloud to cloud. At the median distance of our sample of 4.0 kpc, the 8 core detection limit corresponds to a mass of 30 . Hence, below 45 , our “cold” core sample is incomplete.
For three active star-forming cores within G034.43+00.24, Rathborne et al. (2005) find that greybody fits to their IR to millimeter continuum spectral energy distributions reveal temperatures of 30K. Thus, these masses will be overestimates if any of the cores have a higher temperature than 15 K (e.g., a dust temperature of 30 K will reduce the core mass by 40%).
The cores have diameters in the range 0.04 to 1.6 pc, with a median diameter of 0.5 pc. All cores are resolved in the 11″ IRAM beam. Figure 8 plots the size versus mass for the millimeter cores. The majority of cores have masses 200 and sizes 0.8 pc. We find no correlation between either the mass or size and kinematic distance (Fig. 9). Indeed, we detect low-mass cores at all distances.
Figure 10 plots the histogram of the core densities. The densities were calculated using
| (2) |
where is the 1.2 mm mass and is the radius (half the size given in Table Infrared Dark Clouds: precursors to star clusters). The densities range from 103 to 107 , with a median value of 3.3 104 .
4 Discussion
The combination of low optical depth and good angular resolution of these millimeter images allow us to probe the internal structure of IRDCs and to elucidate their role in the star formation process.
The sizes and masses of IRDCs as a whole are larger than those of Bok globules and hot cores, but smaller than those of giant molecular clouds. Instead, IRDCs more closely resemble cluster-forming molecular clumps. Indeed, IRDC sizes ( 2 pc) and masses (102–104 ) are comparable to those of cluster-forming clumps (see Table 1). Moreover they both exhibit a highly fragmented sub-structure. A significant difference, however, is that IRDCs are much colder.
4.1 A Proposed Evolutionary Sequence for IRDCs
Because the masses and sizes of IRDCs and cluster forming clumps are so similar, we suggest that IRDCs are the high-mass analogs to Bok globules. As such, they are the precursors to star clusters. Their lower temperatures would then result purely from an evolutionary effect. IRDCs may be colder because they represent an early stage of a cluster-forming molecular clump before the stars have formed and heated the surrounding gas and dust.
If this scenario is correct, clusters begin their lives as cold, pristine IRDCs (in this discussion, we will refer to all molecular clumps with similar temperatures [ 15 K], sizes [ 2 pc], masses [102–104 ], and densities [102–104 ] as the MSX dark clouds as “IRDCs”, whether or not they are actually observed as extinction features). As cores begin to collapse within the clump, protostars form and begin to heat their local environment. If high-mass protostars are present, they eventually will form zero-age main-sequence OB stars which will rapidly heat, ionize, and disrupt their surroundings.
We thus expect an evolutionary sequence for IRDCs as follows. The youngest IRDCs will be isolated IR dark clouds, unassociated with any bright, extended mid-IR or radio continuum emission. As protostars form, the IRDC cores will be bright, compact far-IR sources but the IRDC itself will remain dark. In the later stages, the IRDC will have formed OB stars which will illuminate and ionize significant portions of the cloud. Such IRDCs will contain very bright, extended mid-IR emission and compact regions. Eventually, the IRDC will lose its ‘darkness’ and become an IR bright star forming region.
We suggest that the degree to which IRDCs are associated with mid-IR continuum emission sources is precisely due to this evolutionary sequence. IRDCs with no associated mid-IR emission sources such as G015.3100.16 (Fig. 1[a]) and G028.5300.25 (Fig. 4[a]) represent the very earliest stage before high-mass protostars have formed. The intermediate stage might be represented by G034.43+00.24 (Fig. 5[b]). Rathborne et al. (2005) demonstrate that this IRDC is the site of recent, active high-mass star formation. Examples of the later evolutionary stage are G028.2800.34 (Fig. 3[e]) and G053.11+00.05 (Fig. 6[c]). Toward both of these IRDCs we see bright, extended mid-IR emission. These bright sources appear to be regions breaking out of the dense cloud.
4.2 IRDC Cores: Precursors to Hot Cores
Whereas cluster formation takes place over size scales of several parsecs and involves 103 of molecular gas, individual stars form from smaller, less massive sub-structures. Individual low-mass stars form within Bok globules from pre-protostellar cores with characteristic sizes of 0.05 pc, masses of 0.5–5 , and densities of 105–106 (see Table 1). High-mass stars should form from similar cold, compact cores, but with higher masses and densities. However, the earliest well characterized stage of high-mass star formation is the hot core phase, well after the formation of the central protostar.
Just as IRDCs have similar sizes and masses compared to cluster-forming clumps, the IRDC cores also share some of the properties of hot cores that are associated with individual high-mass stars. Both the IRDC cores ( 0.3 pc) and hot cores ( 0.1 pc) are compact. In our sample, IRDC cores have a median mass of 120 . We find that 67% have masses in the range 30–300 (see Fig. 7), which is comparable to the measured mass for hot cores 100–300 (Garay & Lizano, 1999). Their densities are also comparable; IRDC cores in our sample range from 103–107 while hot cores, have slightly larger densities ranging from 105–108 (see Table 1).
These similarities suggest that IRDC cores may be the cold precursors to hot cores and the high-mass analogs of pre-protostellar cores within Bok globules. If true, then hot cores collapse from IRDC cores, and therefore we should expect the IRDC cores to be somewhat larger and less dense. Indeed, the observations show that the IRDC cores are factors of several larger and factors of 30 less dense than hot cores.
The mass of the star that forms within an IRDC core depends on fragmentation and the molecular core’s star formation efficiency. In the simplest scenario, a single core forms a single star. Unfortunately, the core star formation efficiency is not well known. Lada et al. (1997) find efficiencies ranging from 10-30% in cluster-forming clumps. If we adopt a value of 20% as a typical core star formation efficiency, the majority of our cores will form stars with masses ranging from 6 to 60 corresponding to OB stars. We conclude therefore that IRDC cores are the precursors to high-mass protostars. In fact, Rathborne et al. (2005) find three high-mass protostars associated with IRDC cores in G034.43+00.24.
We cannot yet exclude, however, the possibility that some IRDC cores may instead further fragment to form several low- to intermediate-mass stars. Indeed, the most massive (500 ) cores with compact (0.5 pc) sizes will likely further fragment into several protostellar objects. Because the central protostar is directly revealed by its millimeter through mid-IR emission, the number of detected millimeter to mid-IR sources within these cores will trace the degree of fragmentation, and more importantly, reveal the luminosities of the individual protostars. Thus, higher angular resolution studies, in the millimeter/submillimeter and mid-IR, are necessary to distinguish between single and multiple protostars. In addition, such observations would also reveal the luminosities and, hence, masses of the individual protostars.
Because high-mass IRDC cores are brighter at millimeter wavelengths than low-mass cores, the lack of detected low-mass cores may result from our limited sensitivity. Because the number of cores as a function of mass N(M) is well characterized by a power law for masses 100 , one might expect the number of low-mass cores to follow this trend. It is possible therefore that low-mass cores exist in large numbers within IRDCs but are simply fainter than our detection limit. Toward the nearby clouds, we do detect a few low-mass cores (10 ); it is likely these will only give rise to low-mass stars.
4.3 Implications for the Role of IRDCs in Galactic Star Formation
The discovery of a large number of IRDCs and cores has important implications for their role in global star formation in the Galaxy. If IRDCs spawn star clusters, and stars form predominantly in clusters (Lada & Lada, 2003), then every star in the Galaxy may very well form within molecular clumps with identical temperatures, sizes, masses, column densities, and volume densities as IRDCs. These clumps would only appear as an IRDC if they happened to be nearby, with a strong mid-IR background.
A very rough estimate of the star formation rate within IRDC-like molecular clumps can be made as follows. The total mass in the form of IRDCs, , can be estimated using
| (3) |
where is the total number of known IRDCs in the Galaxy, is the characteristic mass of an individual IRDC, and is the fraction of all IRDCs that can be detected as extinction features. Although our sample comes from the MSX database, new and future surveys will no doubt improve our understanding of IRDCs due to improved sensitivity and angular resolution. For example, the Spitzer 3–8 m Galactic Legacy Infrared Mid-Plane Survey Extraordinaire (GLIMPSE; Benjamin et al., 2003), improves the angular resolution by an order of magnitude over MSX and therefore reveals new IRDCs. MSX, however, does detect the largest, most massive IRDCs that presumably dominate Galactic star-formation.
From the MSX database, roughly 10,000 IRDCs have been identified (Simon et al., 2006a). If the IRDCs in our sample are typical, then we can choose their average mass as a characteristic mass for IRDCs, and so 3,000 . The total number of IRDCs in the Galaxy is not yet known. Because of strong observational bias only a fraction, , of all IRDCs are actually detected as extinction features. Toward the inner Galaxy, IRDCs at the far kinematic distance will lie behind most of the diffuse IR emission and would be impossible to detect as extinction features. From geometrical arguments, sources within the solar circle at the near kinematic distance occupy 1/3 of the area of sources at the far kinematic distance. Since we preferentially detect IRDCs at the near kinematic distance we estimate . With these estimates, the total Galactic mass contained in IRDCs is , or about 5% of the total molecular gas content of the Milky Way.
The rate of star formation occurring within IRDCs can now be estimated using
| (4) |
where is the star formation efficiency, and is the timescale for star formation to occur within an IRDC. If we choose an efficiency of (typical for cluster forming clumps) and a conservative star formation timescale of yr, we arrive at a total star formation within IRDCs of yr-1. This star formation rate is quite close to estimates of the global star formation of the Galaxy, 3–5 yr-1 (Prantzos & Aubert, 1995). While this estimate is only approximate, it does support the plausibility of the idea that IRDC-like molecular clumps are the birthplaces of all stars.
4.4 Comparison to the Stellar IMF
If stars form within IRDC cores, then it is also interesting to compare the mass spectrum of IRDC cores with the stellar initial mass function (IMF). If these high-mass cores spawn single high-mass stars with a constant star formation efficiency, one might expect the power law index to match that of the IMF for high-mass stars. Indeed, recent studies suggest that the stellar initial mass function is determined by the fragmentation of a cloud into cores, well before any stars have formed (Motte et al., 1998; Testi & Sargent, 1998; Blitz & Williams, 1999; Williams et al., 2000; Churchwell, 2002).
Above , we find the IRDC core mass spectrum is approximately a power law with an index of . Within the errors, this power-law index is the same as that for the stellar IMF for high-mass stars (; Salpeter, 1955) and also to that of the clump mass spectrum for molecular clouds ( 1.8; Kramer et al., 1998; Simon et al., 2001).
5 Conclusions
We used MAMBO II on the IRAM 30 m telescope to image the 1.2 mm continuum emission toward a sample of 38 IRDCs with known kinematic distance. We find 1.2 mm continuum emission to be associated with each of the IRDCs observed. The morphology of the 1.2 mm continuum emission matches the mid-IR extinction features extremely well; some IRDCs are extended and filamentary, while others are compact and smooth. Every IRDC contains at least one compact ( 0.5 pc) core, with most IRDCs containing multiple cores.
IRDCs have masses in the range 120 to 16,000 (with a median mass of 940 ) and, in some cases, are associated with bright mid-IR emission sources. We suggest that the degree to which IRDCs are associated with bright mid-IR emission sources is related to their evolutionary phase; IRDCs with no associated mid-IR emission sources are in the earliest phase, while IRDCs with several bright mid-IR emission sources are in the later stages. The colder temperatures, fragmented sub-structure, and similar sizes and masses of IRDCs and cluster-forming molecular clumps, support our idea that IRDCs may be the precursors to cluster-forming molecular clumps and the high-mass analogs to Bok globules.
Toward the 38 IRDCs, we detected a total of 140 millimeter cores unassociated with MSX 8 m emission. The core masses range from 10 to 2,100 and have a median mass of 120 . We find that IRDC cores have similar sizes, masses, and densities to hot cores associated with individual high-mass stars, the only obvious difference being that IRDC cores are colder. Assuming typical star formation efficiencies ( 20%), the simplest interpretation is that the majority of the cores will form high-mass stars in the range 6 to 60 . We suggest therefore that IRDC cores are in an earlier evolutionary phase than hot cores and that they are the higher-mass analog to the pre-protostellar cores within Bok globules.
Given the limited angular resolution and sensitivity of the 1.2 mm continuum images, we cannot yet exclude the possibility that many of the cores will further fragment to form low- to intermediate-mass stars or that many low-mass cores exist within IRDCs but are below our detection limit. However, an estimate of the star formation rate within IRDC-like molecular clumps ( 2 yr-1) is comparable to the global star formation rate in the Galaxy, which supports the idea that such molecular clumps may be the birthplaces of all stars. We also find the slope of the IRDC core mass spectrum ( 2.1 0.4) is similar to that of the stellar IMF.
Future high-resolution studies of IRDCs may help solve several outstanding problems in cluster formation. For example, the location of cores of various masses within IRDCs will test the idea that the observed stellar mass segregation (the tendency for higher mass stars to be located nearer to the center of a cluster) in evolved clusters results from an earlier mass segregation of the proto-stellar cores (Gouliermis et al., 2004). In addition, emission from the extended regions of IRDCs will trace the initial conditions and cloud density structure just prior to fragmentation. IRDCs, therefore, represent excellent laboratories to study the core mass spectrum, its relation to the stellar initial mass function, and the observed mass segregation within star clusters.
References
- Adams et al. (1987) Adams, F. C., Lada, C. J., & Shu, F. H. 1987, ApJ, 312, 788
- Alves et al. (2001) Alves, J. F., Lada, C. J., & Lada, E. A. 2001, Nature, 409, 159
- Bally & Lada (1983) Bally, J., & Lada, C. J. 1983, ApJ, 265, 824
- Benjamin et al. (2003) Benjamin, R. A., et al. 2003, PASP, 115, 953
- Blitz & Williams (1999) Blitz, L. & Williams, J. P. 1999, in NATO ASIC Proc. 540: The Origin of Stars and Planetary Systems, 3
- Bok & Reilly (1947) Bok, B. J., & Reilly, E. F. 1947, ApJ, 105, 255
- Bourke et al. (1995) Bourke, T. L., Hyland, A. R., & Robinson, G. 1995, MNRAS, 276, 1052
- Brand & Blitz (1993) Brand, J., & Blitz, L. 1993, A&A, 275, 67
- Carey et al. (1998) Carey, S. J., Clark, F. O., Egan, M. P., Price, S. D., Shipman, R. F., & Kuchar, T. A. 1998, ApJ, 508, 721
- Carey et al. (2000) Carey, S. J., Feldman, P. A., Redman, R. O., Egan, M. P., MacLeod, J. M., & Price, S. D. 2000, ApJ, 543, L157
- Churchwell (2002) Churchwell, E. 2002, ARA&A, 40, 27
- Clemens (1985) Clemens, D. P. 1985, ApJ, 295, 422
- Clemens & Barvainis (1988) Clemens, D. P., & Barvainis, R. 1988, ApJS, 68, 257
- Egan et al. (1998) Egan, M. P., Shipman, R. F., Price, S. D., Carey, S. J., Clark, F. O., & Cohen, M. 1998, ApJ, 494, L199
- Emerson et al. (1979) Emerson, D. T., Klein, U., & Haslam, C. G. T. 1979, A&A, 76, 92
- Fukui et al. (1993) Fukui, Y., Iwata, T., Mizuno, A., Bally, J., & Lane, A. P. 1993, Protostars and Planets III, 603
- Garay et al. (2004) Garay, G., Faúndez, S., Mardones, D., Bronfman, L., Chini, R., & Nyman, L.-Å. 2004, ApJ, 610, 313
- Garay & Lizano (1999) Garay, G. & Lizano, S. 1999, PASP, 111, 1049
- Goldsmith (1987) Goldsmith, P. F. 1987, ASSL Vol. 134: Interstellar Processes, 51
- Gouliermis et al. (2004) Gouliermis, D., Keller, S. C., Kontizas, M., Kontizas, E., & Bellas-Velidis, I. 2004, A&A, 416, 137
- Hennebelle et al. (2001) Hennebelle, P., Pérault, M., Teyssier, D., & Ganesh, S. 2001, A&A, 365, 598
- Hildebrand (1983) Hildebrand, R. H. 1983, QJRAS, 24, 267
- Jackson et al. (2006) Jackson, J. M., Rathborne, J. M., Shah, R. Y., Simon, R., Bania, T. M., Clemens, D. P., Chambers, E. T., Johnson, A. M., Dormody, M., Lavoie, R., & Heyer, M. 2006, ApJ, accepted
- Kramer et al. (1998) Kramer, C., Stutzki, J., Rohrig, R., & Corneliussen, U. 1998, A&A, 329, 249
- Kurtz et al. (2000) Kurtz, S., Cesaroni, R., Churchwell, E., Hofner, P., & Walmsley, C. M. 2000, Protostars and Planets IV, 299
- Lada & Wilking (1984) Lada, C. J., & Wilking, B. A. 1984, ApJ, 287, 610
- Lada et al. (1994) Lada, C. J., Lada, E. A., Clemens, D. P., & Bally, J. 1994, ApJ, 429, 694
- Lada (1999) Lada, C. J. 1999, NATO ASIC Proc. 540: The Origin of Stars and Planetary Systems, 143
- Lada & Lada (2003) Lada, C. J. & Lada, E. A. 2003, ARA&A, 41, 57
- Lada et al. (1997) Lada, E. A., Evans, N. J., & Falgarone, E. 1997, ApJ, 488, 286
- Leung (1985) Leung, C. M. 1985, Protostars and Planets II, 104
- Lis & Carlstrom (1994) Lis, D. C. & Carlstrom, J. E. 1994, ApJ, 424, 189
- Lombardi & Alves (2001) Lombardi, M., & Alves, J. 2001, A&A, 377, 1023
- Motte et al. (1998) Motte, F., Andre, P., & Neri, R. 1998, A&A, 336, 150
- Motte et al. (2003) Motte, F., Schilke, P., & Lis, D. C. 2003, ApJ, 582, 277
- Myers & Benson (1983) Myers, P. C., & Benson, P. J. 1983, ApJ, 266, 309
- Ormel et al. (2005) Ormel, C. W., Shipman, R. F., Ossenkopf, V., & Helmich, F. P. 2005, A&A, 439, 613
- Ossenkopf & Henning (1994) Ossenkopf, V. & Henning, T. 1994, A&A, 291, 943
- Perault et al. (1996) Perault, M., Omont, A., Simon, G., Seguin, P., Ojha, D., Blommaert, J., Felli, M., Gilmore, G., Guglielmo, F., Habing, H., Price, S., Robin, A., de Batz, B., Cesarsky, C., Elbaz, D., Epchtein, N., Fouque, P., Guest, S., Levine, D., Pollock, A., Prusti, T., Siebenmorgen, R., Testi, L., & Tiphene, D. 1996, A&A, 315, L165
- Prantzos & Aubert (1995) Prantzos, N. & Aubert, O. 1995, A&A, 302, 69
- Price et al. (2001) Price, S. D., Egan, M. P., Carey, S. J., Mizuno, D., & Kuchar, T. 2001, AJ, 121, 2819
- Rathborne et al. (2005) Rathborne, J. M., Jackson, J. M., Chambers, E. T., Simon, R., Shipman, R., & Frieswijk, W. 2005, ApJ, 630, L181
- Redman et al. (2003) Redman, R. O., Feldman, P. A., Wyrowski, F., Côté, S., Carey, S. J., & Egan, M. P. 2003, ApJ, 586, 1127
- Salpeter (1955) Salpeter, E. E. 1955, ApJ, 121, 161
- Shu et al. (1987) Shu, F. H., Adams, F. C., & Lizano, S. 1987, ARA&A, 25, 23
- Shu (1991) Shu, F. H. 1991, NATO ASIC Proc. 342: The Physics of Star Formation and Early Stellar Evolution, 365
- Simon et al. (2001) Simon, R., Jackson, J. M., Clemens, D. P., Bania, T. M., & Heyer, M. H. 2001, ApJ, 551, 747
- Simon et al. (2006a) Simon, R., Jackson, J. M., Rathborne, J. M., & Chambers, E. T. 2006a, ApJ, accepted
- Simon et al. (2006b) Simon, R., Rathborne, J. M., Shah, R. Y., Jackson, J. M., & Chambers, E. T. 2006b, ApJ, submitted
- Snell et al. (1980) Snell, R. L., Loren, R. B., & Plambeck, R. L. 1980, ApJ, 239, L17
- Testi & Sargent (1998) Testi, L. & Sargent, A. I. 1998, ApJ, 508, L91
- Teyssier et al. (2002) Teyssier, D., Hennebelle, P., & Pérault, M. 2002, A&A, 382, 624
- van Dishoeck & Hogerheijde (1999) van Dishoeck, E. F., & Hogerheijde, M. R. 1999, NATO ASIC Proc. 540: The Origin of Stars and Planetary Systems, 97
- Ward-Thompson et al. (1994) Ward-Thompson, D., Scott, P. F., Hills, R. E., & Andre, P. 1994, MNRAS, 268, 276
- Williams et al. (2000) Williams, J. P., Blitz, L., & McKee, C. F. 2000, Protostars and Planets IV, 97


| Properties | Bok | Cluster-forming | IRDCs | Cores | |||
|---|---|---|---|---|---|---|---|
| globules | clumps | pre-protostellar | Hot | IRDC | |||
| Radius (pc) | 0.1–2 | 0.5–1 | 1–3 | 0.05 | 0.1 | 0.02–0.8 | |
| Mass ( ) | 1–102 | 102–103 | 102–104 | 0.5–5 | 102 | 10–103 | |
| Density () | 103–104 | 104–107 | 102–104 | 105–106 | 105–108 | 103–107 | |
| Temperature (K) | 10–20 | 50–200 | 10-20 | 10 | 50–250 | 15–30 | |
| References | 1,2,3 | 4,5 | 6 | 7,8 | 9,10,11 | 12,13 | |
| Name | Coordinates | 1.2 mm Flux | Mass | |||||
| Peak | Integrated | |||||||
| MSXDC | (J2000) | (J2000) | ( km s-1) | ( km s-1) | (kpc) | (mJy) | (Jy) | |
| G015.05+00.07 | 18 17 41.8 | -15 49 38.7 | 30.9 | 6.8 | 3.2 | 115 | 0.71 | 158 |
| G015.3100.16 | 18 18 51.4 | -15 43 27.7 | 31.1 | 3.3 | 3.2 | 41 | 1.67 | 370 |
| G018.8200.28 | 18 26 19.8 | -12 41 29.7 | 65.8 | 5.5 | 4.8 | 80 | 6.36 | 3168 |
| G019.27+00.07 | 18 25 54.0 | -12 04 56.3 | 26.2 | 4.5 | 2.4 | 150 | 3.25 | 405 |
| G022.35+00.41 | 18 30 24.7 | -09 10 47.4 | 60.5 | 2.2 | 4.3 | 349 | 3.71 | 1483 |
| G022.73+00.11 | 18 32 13.4 | -09 00 58.5 | 77.8 | 7.0 | 5.1 | 38 | 0.72 | 405 |
| G023.60+00.00 | 18 34 21.0 | -08 17 31.1 | 53.9 | 5.8 | 3.9 | 272 | 8.83 | 2903 |
| G024.08+00.04 | 18 35 02.9 | -07 46 11.8 | 52.5 | 5.8 | 3.8 | 68 | 3.04 | 949 |
| G024.33+00.11 | 18 35 16.3 | -07 36 09.3 | 52.9 | 6.5 | 3.8 | 1199 | 8.34 | 2603 |
| G024.60+00.08 | 18 35 39.4 | -07 18 50.9 | 51.7 | 3.9 | 3.7 | 263 | 4.22 | 1249 |
| G025.0400.20 | 18 37 26.6 | -07 09 14.2 | 46.9 | 4.2 | 3.4 | 92 | 6.07 | 1517 |
| G027.75+00.16 | 18 41 20.4 | -04 32 25.1 | 79.1 | 6.9 | 5.3 | 75 | 0.99 | 599 |
| G027.9400.47 | 18 44 01.5 | -04 38 41.6 | 45.7 | 3.1 | 3.2 | 103 | 1.55 | 343 |
| G027.9700.42 | 18 43 52.8 | -04 36 13.6 | 45.9 | 3.5 | 3.2 | 143 | 1.61 | 356 |
| G028.0400.46 | 18 44 10.3 | -04 33 37.1 | 45.5 | 3.0 | 3.2 | 84 | 0.64 | 142 |
| G028.08+00.07 | 18 42 20.4 | -04 16 50.3 | 75.8 | 5.4 | 4.9 | 63 | 0.72 | 374 |
| G028.1000.45 | 18 44 13.6 | -04 29 47.4 | 46.2 | 2.5 | 3.2 | 33 | 1.80 | 398 |
| G028.2300.19 | 18 43 31.3 | -04 13 18.4 | 79.6 | 6.5 | 5.1 | 83 | 2.80 | 1574 |
| G028.2800.34 | 18 44 11.0 | -04 17 39.2 | 47.4 | 4.5 | 3.3 | 64 | 6.19 | 1457 |
| G028.37+00.07 | 18 42 50.6 | -04 03 30.4 | 78.6 | 8.3 | 5.0 | 199 | 29.41 | 15895 |
| G028.5300.25 | 18 44 17.1 | -03 59 36.6 | 87.0 | 4.7 | 5.7 | 227 | 15.96 | 11210 |
| G028.67+00.13 | 18 43 07.9 | -03 44 28.5 | 79.5 | 8.0 | 5.1 | 70 | 1.67 | 939 |
| G030.1400.06 | 18 46 36.4 | -02 31 22.1 | 86.7 | 4.0 | 5.5 | 53 | 1.22 | 798 |
| G030.5700.23 | 18 48 02.0 | -02 12 40.1 | 86.2 | 4.0 | 5.5 | 55 | 2.47 | 1615 |
| G030.9700.14 | 18 48 24.2 | -01 48 24.7 | 78.8 | 6.1 | 5.1 | 27 | 5.08 | 2856 |
| G031.0200.10 | 18 48 22.2 | -01 45 03.2 | 78.0 | 5.9 | 5.0 | 45 | 0.30 | 157 |
| G031.97+00.07 | 18 49 33.7 | -00 47 48.3 | 96.7 | 6.2 | 6.9 | 311 | 16.32 | 14797 |
| G033.6900.01 | 18 52 57.6 | 00 42 58.9 | 105.9 | 6.1 | 7.1 | 205 | 12.14 | 13230 |
| G034.43+00.24 | 18 53 18.9 | 01 26 38.6 | 57.1 | 5.8 | 3.7 | 2228 | 36.88 | 10914 |
| G034.7700.55 | 18 56 48.8 | 01 23 21.0 | 43.5 | 5.0 | 2.9 | 59 | 4.85 | 882 |
| G035.3900.33 | 18 57 09.0 | 02 07 45.7 | 44.7 | 3.6 | 2.9 | 76 | 8.40 | 1527 |
| G035.5900.24 | 18 57 11.7 | 02 15 54.7 | 44.7 | 4.3 | 2.9 | 57 | 0.67 | 121 |
| G036.6700.11 | 18 58 40.4 | 03 16 17.7 | 54.4 | 3.6 | 3.6 | 61 | 3.92 | 1098 |
| G038.9500.47 | 19 04 08.3 | 05 08 49.3 | 41.6 | 3.1 | 2.7 | 119 | 11.37 | 1792 |
| G048.6500.29 | 19 21 45.3 | 13 49 21.7 | 34.0 | 2.8 | 2.5 | 71 | 6.79 | 917 |
| G053.11+00.05 | 19 29 18.1 | 17 54 33.0 | 22.0 | 2.2 | 1.8 | 81 | 7.41 | 519 |
| G053.25+00.04 | 19 29 37.5 | 18 01 23.5 | 23.9 | 2.1 | 1.9 | 96 | 4.36 | 340 |
| G053.31+00.00 | 19 29 54.5 | 18 03 30.0 | 24.0 | 2.7 | 2.0 | 71 | 4.54 | 393 |
| References | 1 | 1 | 2 | 2 | 2 | |||
| Core | Coordinates | 1.2 mm Flux | FWHM Diameter | Mass | CommentaaIncludes: “em” marks cores that are associated with 8 m emission in the MSX images; letters in parentheses refer to the corresponding cores from the IRDC catalog of Simon et al. (2006a); the names of IRAS sources associated with the millimeter cores are also listed here. | ||||
|---|---|---|---|---|---|---|---|---|---|
| Peak | Integrated | Angular | Physical | ||||||
| (J2000) | (J2000) | (mJy) | (Jy) | () | (pc) | ( ) | |||
| MSXDC G015.05+00.07 | |||||||||
| MM1 | 18 17 50.4 | -15 53 38 | 115 | 0.47 | 24 | 0.32 | 105 | ||
| MM2 | 18 17 40.0 | -15 48 55 | 50 | 0.37 | 32 | 0.46 | 83 | (b) | |
| MM3 | 18 17 42.4 | -15 47 03 | 35 | 0.10 | 22 | 0.28 | 22 | ||
| MM4 | 18 17 32.0 | -15 46 35 | 35 | 0.19 | 28 | 0.39 | 43 | ||
| MM5 | 18 17 40.2 | -15 49 47 | 30 | 0.13 | 24 | 0.33 | 29 | ||
| MSXDC G015.31-00.16 | |||||||||
| MM1 | 18 18 56.4 | -15 45 00 | 41 | 0.17 | 24 | 0.33 | 38 | ||
| MM2 | 18 18 50.4 | -15 43 19 | 39 | 0.46 | 40 | 0.59 | 101 | ||
| MM3 | 18 18 45.3 | -15 41 58 | 37 | 0.74 | 52 | 0.79 | 164 | ||
| MM4 | 18 18 48.0 | -15 44 22 | 23 | 0.08 | 24 | 0.32 | 18 | ||
| MM5 | 18 18 49.1 | -15 42 47 | 21 | 0.14 | 40 | 0.59 | 32 | ||
| MSXDC G018.82-00.28 | |||||||||
| MM1 | 18 25 56.1 | -12 42 48 | 459 | 1.78 | 23 | 0.46 | 887 | em | |
| MM2 | 18 26 23.4 | -12 39 37 | 170 | 0.49 | 20 | 0.37 | 242 | em | |
| MM3 | 18 25 52.6 | -12 44 37 | 118 | 0.47 | 25 | 0.52 | 233 | em | |
| MM4 | 18 26 15.5 | -12 41 32 | 80 | 0.53 | 31 | 0.66 | 263 | ||
| MM5 | 18 26 21.0 | -12 41 11 | 55 | 0.34 | 30 | 0.64 | 170 | ||
| MM6 | 18 26 18.4 | -12 41 15 | 45 | 0.41 | 35 | 0.77 | 205 | ||
| MSXDC G019.27+00.07 | |||||||||
| MM1 | 18 25 58.5 | -12 03 59 | 150 | 0.91 | 29 | 0.30 | 113 | ||
| MM2 | 18 25 52.6 | -12 04 48 | 89 | 0.92 | 37 | 0.41 | 114 | ||
| MSXDC G022.35+00.41 | |||||||||
| MM1 | 18 30 24.4 | -09 10 34 | 349 | 0.63 | 16 | 0.22 | 253 | (a) | |
| MM2 | 18 30 24.2 | -09 12 44 | 67 | 0.54 | 33 | 0.64 | 215 | em | |
| MM3 | 18 30 38.1 | -09 12 44 | 53 | 0.29 | 28 | 0.52 | 114 | ||
| MSXDC G022.73+00.11 | |||||||||
| MM1 | 18 32 13.0 | -09 00 50 | 38 | 0.27 | 31 | 0.70 | 149 | ||
| MSXDC G023.60+00.00 | |||||||||
| MM1 | 18 34 11.6 | -08 19 06 | 375 | 1.11 | 20 | 0.31 | 365 | em | |
| MM2 | 18 34 21.1 | -08 18 07 | 272 | 0.71 | 19 | 0.29 | 233 | ||
| MM3 | 18 34 10.0 | -08 18 28 | 81 | 0.81 | 41 | 0.74 | 266 | em | |
| MM4 | 18 34 23.0 | -08 18 21 | 68 | 1.07 | 47 | 0.85 | 350 | ||
| MM5 | 18 34 09.5 | -08 18 00 | 65 | 0.30 | 26 | 0.43 | 98 | em | |
| MM6 | 18 34 18.2 | -08 18 52 | 61 | 0.29 | 27 | 0.45 | 96 | ||
| MM7 | 18 34 21.1 | -08 17 11 | 58 | 0.87 | 47 | 0.85 | 286 | ||
| MM8 | 18 34 24.9 | -08 17 14 | 40 | 0.14 | 22 | 0.34 | 45 | ||
| MM9 | 18 34 22.5 | -08 16 04 | 39 | 0.24 | 31 | 0.53 | 80 | ||
| MSXDC G024.08+00.04 | |||||||||
| MM1 | 18 34 57.0 | -7 43 26 | 219 | 0.63 | 20 | 0.29 | 196 | em | |
| MM2 | 18 34 51.1 | -7 45 32 | 68 | 0.64 | 40 | 0.70 | 201 | ||
| MM3 | 18 35 2.2 | -7 45 25 | 50 | 0.40 | 33 | 0.56 | 124 | ||
| MM4 | 18 35 2.6 | -7 45 56 | 48 | 0.37 | 32 | 0.55 | 115 | ||
| MM5 | 18 35 7.4 | -7 45 46 | 40 | 0.28 | 32 | 0.54 | 87 | ||
| MSXDC G024.33+00.11 | |||||||||
| MM1 | 18 35 07.9 | -07 35 04 | 1199 | 2.03 | 15 | 0.18 | 1759 | IRAS 18324-0737 | |
| MM2 | 18 35 34.5 | -07 37 28 | 117 | 0.39 | 25 | 0.40 | 123 | em | |
| MM3 | 18 35 27.9 | -07 36 18 | 96 | 0.41 | 25 | 0.40 | 126 | em | |
| MM4 | 18 35 19.4 | -07 37 17 | 90 | 1.43 | 48 | 0.85 | 446 | ||
| MM5 | 18 35 33.8 | -07 36 42 | 79 | 0.62 | 34 | 0.58 | 192 | em | |
| MM6 | 18 35 07.7 | -07 34 33 | 77 | 0.94 | 41 | 0.72 | 293 | ||
| MM7 | 18 35 09.8 | -07 39 48 | 77 | 0.30 | 24 | 0.38 | 93 | ||
| MM8 | 18 35 23.4 | -07 37 21 | 72 | 0.98 | 44 | 0.78 | 305 | ||
| MM9 | 18 35 26.5 | -07 36 56 | 66 | 0.88 | 46 | 0.82 | 273 | em | |
| MM10 | 18 35 27.9 | -07 35 32 | 64 | 0.31 | 26 | 0.42 | 97 | ||
| MM11 | 18 35 05.1 | -07 35 58 | 48 | 0.88 | 56 | 1.00 | 275 | ||
| MSXDC G024.60+00.08 | |||||||||
| MM1 | 18 35 40.2 | -07 18 37 | 279 | 0.65 | 18 | 0.25 | 192 | ||
| MM2 | 18 35 35.7 | -07 18 09 | 230 | 0.53 | 18 | 0.42 | 483 | ||
| MM3 | 18 35 41.1 | -07 18 30 | 71 | 0.12 | 16 | 0.20 | 35 | ||
| MM4 | 18 35 39.3 | -07 18 51 | 30 | 0.09 | 23 | 0.36 | 27 | ||
| MSXDC G025.04-00.20 | |||||||||
| MM1 | 18 38 10.2 | -07 02 34 | 203 | 1.11 | 28 | 0.42 | 276 | em | |
| MM2 | 18 38 17.7 | -07 02 51 | 92 | 0.42 | 28 | 0.41 | 104 | ||
| MM3 | 18 38 10.2 | -07 02 44 | 90 | 0.19 | 18 | 0.22 | 47 | ||
| MM4 | 18 38 13.7 | -07 03 12 | 82 | 1.23 | 46 | 0.73 | 307 | ||
| MM5 | 18 38 12.0 | -07 02 44 | 73 | 0.20 | 21 | 0.29 | 50 | ||
| MSXDC G027.75+00.16 | |||||||||
| MM1 | 18 41 19.9 | -04 32 20 | 75 | 0.53 | 31 | 0.73 | 320 | (a) | |
| MM2 | 18 41 33.0 | -04 33 44 | 46 | 0.22 | 27 | 0.63 | 133 | ||
| MM3 | 18 41 16.8 | -04 31 55 | 36 | 0.46 | 42 | 1.04 | 281 | ||
| MM4 | 18 41 30.4 | -04 30 00 | 29 | 0.20 | 32 | 0.77 | 123 | ||
| MM5 | 18 41 23.6 | -04 30 42 | 28 | 0.15 | 28 | 0.64 | 92 | ||
| MSXDC G027.94-00.47 | |||||||||
| MM1 | 18 44 03.6 | -04 38 00 | 103 | 0.32 | 21 | 0.26 | 70 | ||
| MM2 | 18 44 03.1 | -04 37 25 | 40 | 0.19 | 27 | 0.37 | 42 | ||
| MSXDC G027.97-00.42 | |||||||||
| MM1 | 18 43 52.8 | -04 36 13 | 143 | 0.26 | 16 | 0.16 | 57 | (a) | |
| MM2 | 18 43 58.0 | -04 34 24 | 103 | 0.28 | 19 | 0.23 | 62 | (b) | |
| MM3 | 18 43 54.9 | -04 36 08 | 41 | 0.27 | 18 | 0.20 | 45 | ||
| MSXDC G028.04-00.46 | |||||||||
| MM1 | 18 44 08.5 | -04 33 22 | 87 | 0.36 | 24 | 0.32 | 80 | em | |
| MSXDC G028.08+00.07 | |||||||||
| MM1 | 18 42 20.3 | -04 16 42 | 63 | 0.72 | 39 | 0.89 | 374 | ||
| MSXDC G028.10-00.45 | |||||||||
| MM1 | 18 44 12.9 | -04 29 45 | 33 | 0.35 | 38 | 0.56 | 78 | ||
| MM2 | 18 44 14.3 | -04 29 48 | 18 | 0.09 | 28 | 0.40 | 19 | ||
| MSXDC G028.23-00.19 | |||||||||
| MM1 | 18 43 30.7 | -04 13 12 | 83 | 1.25 | 51 | 1.22 | 705 | (a) | |
| MM2 | 18 43 29.0 | -04 12 16 | 35 | 0.19 | 27 | 0.60 | 108 | em | |
| MM3 | 18 43 30.0 | -04 12 33 | 23 | 0.07 | 21 | 0.43 | 38 | ||
| MSXDC G028.28-00.34 | |||||||||
| MM1 | 18 44 15.0 | -04 17 54 | 317 | 1.74 | 27 | 0.39 | 411 | em | |
| MM2 | 18 44 21.3 | -04 17 37 | 165 | 1.36 | 37 | 0.55 | 321 | em | |
| MM3 | 18 44 13.4 | -04 18 05 | 139 | 0.29 | 17 | 0.20 | 68 | em | |
| MM4 | 18 44 11.4 | -04 17 22 | 64 | 0.59 | 37 | 0.55 | 139 | ||
| MSXDC G028.37+00.07 | |||||||||
| MM1 | 18 42 52.1 | -03 59 45 | 470 | 2.12 | 26 | 0.55 | 1148 | em | |
| MM2 | 18 42 37.6 | -04 02 05 | 277 | 1.00 | 22 | 0.46 | 542 | em | |
| MM3 | 18 43 03.1 | -04 06 24 | 248 | 0.89 | 23 | 0.47 | 482 | em | |
| MM4 | 18 42 50.7 | -04 03 15 | 199 | 0.61 | 21 | 0.43 | 329 | ||
| MM5 | 18 42 26.8 | -04 01 30 | 151 | 0.33 | 17 | 0.30 | 177 | em | |
| MM6 | 18 42 49.0 | -04 02 23 | 145 | 0.43 | 20 | 0.40 | 232 | ||
| MM7 | 18 42 56.3 | -04 07 31 | 138 | 0.56 | 24 | 0.51 | 304 | em | |
| MM8 | 18 42 49.7 | -04 09 54 | 115 | 0.77 | 31 | 0.70 | 414 | em | |
| MM9 | 18 42 46.7 | -04 04 08 | 97 | 0.73 | 34 | 0.77 | 397 | ||
| MM10 | 18 42 54.0 | -04 02 30 | 88 | 0.66 | 34 | 0.79 | 358 | ||
| MM11 | 18 42 42.7 | -04 01 44 | 81 | 0.83 | 38 | 0.88 | 447 | ||
| MM12 | 18 43 09.9 | -04 06 52 | 71 | 0.88 | 42 | 0.97 | 476 | ||
| MM13 | 18 42 41.8 | -03 57 08 | 66 | 0.86 | 42 | 0.98 | 463 | ||
| MM14 | 18 42 52.6 | -04 02 44 | 62 | 0.07 | 12 | 0.08 | 36 | ||
| MM15 | 18 42 32.4 | -04 01 16 | 59 | 0.25 | 26 | 0.55 | 134 | em | |
| MM16 | 18 42 40.2 | -04 00 23 | 58 | 0.83 | 44 | 1.03 | 447 | ||
| MM17 | 18 43 00.0 | -04 01 34 | 56 | 0.37 | 30 | 0.67 | 198 | ||
| MM18 | 18 43 12.9 | -04 01 16 | 54 | 0.30 | 34 | 0.76 | 162 | ||
| MSXDC G028.53-00.25 | |||||||||
| MM1 | 18 44 18.0 | -03 59 34 | 227 | 1.66 | 33 | 0.84 | 1165 | (a) | |
| MM2 | 18 44 15.7 | -03 59 41 | 129 | 3.01 | 56 | 1.51 | 2115 | ||
| MM3 | 18 44 16.0 | -04 00 48 | 126 | 2.91 | 56 | 1.51 | 2044 | ||
| MM4 | 18 44 18.6 | -04 00 05 | 95 | 1.14 | 44 | 1.16 | 800 | ||
| MM5 | 18 44 17.0 | -04 02 04 | 95 | 0.33 | 23 | 0.53 | 234 | ||
| MM6 | 18 44 17.8 | -04 00 05 | 71 | 0.17 | 18 | 0.38 | 119 | ||
| MM7 | 18 44 23.7 | -04 02 09 | 63 | 0.72 | 45 | 1.19 | 508 | (b) | |
| MM8 | 18 44 22.0 | -04 01 35 | 61 | 0.26 | 27 | 0.66 | 185 | ||
| MM9 | 18 44 19.3 | -03 58 05 | 58 | 0.24 | 26 | 0.63 | 166 | ||
| MM10 | 18 44 18.5 | -03 58 43 | 57 | 0.62 | 41 | 1.07 | 433 | ||
| MSXDC G028.67+00.13 | |||||||||
| MM1 | 18 43 03.1 | -03 41 41 | 86 | 0.25 | 20 | 0.40 | 143 | em | |
| MM2 | 18 43 07.1 | -03 44 01 | 70 | 0.70 | 38 | 0.90 | 394 | ||
| MM3 | 18 42 58.2 | -03 48 20 | 60 | 0.22 | 22 | 0.46 | 122 | em | |
| MM4 | 18 43 13.2 | -03 41 03 | 37 | 0.21 | 29 | 0.64 | 116 | ||
| MM5 | 18 43 10.1 | -03 45 08 | 32 | 0.18 | 30 | 0.67 | 103 | ||
| MM6 | 18 43 12.2 | -03 45 39 | 31 | 0.20 | 31 | 0.71 | 113 | ||
| MM7 | 18 43 06.9 | -03 45 11 | 27 | 0.16 | 30 | 0.67 | 87 | ||
| MSXDC G030.14-00.06 | |||||||||
| MM1 | 18 46 35.7 | -02 31 03 | 53 | 0.90 | 51 | 1.32 | 597 | ||
| MM2 | 18 46 31.7 | -02 32 41 | 36 | 0.13 | 23 | 0.53 | 83 | ||
| MSXDC G030.57-00.23 | |||||||||
| MM1 | 18 48 00.0 | -02 07 20 | 297 | 0.60 | 17 | 0.33 | 419 | em | |
| MM2 | 18 47 58.7 | -02 15 20 | 143 | 0.30 | 17 | 0.33 | 198 | em | |
| MM3 | 18 47 54.5 | -02 11 15 | 55 | 0.39 | 31 | 0.77 | 257 | ||
| MM4 | 18 48 01.8 | -02 12 35 | 37 | 0.46 | 45 | 1.15 | 300 | (a) | |
| MM5 | 18 47 59.9 | -02 11 01 | 36 | 0.22 | 32 | 0.78 | 144 | ||
| MM6 | 18 47 59.4 | -02 13 13 | 33 | 0.16 | 31 | 0.77 | 104 | ||
| MSXDC G030.97-00.14 | |||||||||
| MM1 | 18 48 21.6 | -01 48 27 | 114 | 0.74 | 32 | 0.73 | 417 | em | |
| MM2 | 18 48 22.0 | -01 47 42 | 27 | 0.41 | 47 | 1.13 | 231 | ||
| MSXDC G031.02-00.10 | |||||||||
| MM1 | 18 48 20.7 | -01 44 48 | 130 | 0.65 | 24 | 0.50 | 349 | em | |
| MSXDC G031.97+00.07 | |||||||||
| MM1 | 18 49 36.3 | -00 45 45 | 913 | 1.84 | 17 | 0.40 | 1890 | em; IRAS 18470-0049 | |
| MM2 | 18 49 36.0 | -00 46 16 | 311 | 0.90 | 20 | 0.55 | 929 | ||
| MM3 | 18 49 32.3 | -00 47 02 | 187 | 1.19 | 30 | 0.91 | 1222 | ||
| MM4 | 18 49 33.0 | -00 47 33 | 117 | 0.83 | 32 | 0.98 | 852 | ||
| MM5 | 18 49 21.9 | -00 50 35 | 96 | 0.17 | 16 | 0.35 | 178 | (b) | |
| MM6 | 18 49 35.0 | -00 46 44 | 96 | 1.15 | 41 | 1.32 | 1181 | ||
| MM7 | 18 49 28.4 | -00 48 54 | 80 | 0.28 | 23 | 0.67 | 291 | ||
| MM8 | 18 49 29.1 | -00 48 12 | 64 | 0.48 | 33 | 1.03 | 493 | ||
| MM9 | 18 49 31.6 | -00 46 30 | 47 | 0.15 | 21 | 0.57 | 151 | em | |
| MSXDC G033.69-00.01 | |||||||||
| MM1 | 18 52 58.8 | 00 42 37 | 205 | 1.04 | 27 | 0.82 | 1135 | ||
| MM2 | 18 52 49.9 | 00 37 57 | 115 | 1.23 | 42 | 1.37 | 1342 | em | |
| MM3 | 18 52 50.8 | 00 36 43 | 81 | 0.26 | 22 | 0.63 | 288 | em | |
| MM4 | 18 52 56.4 | 00 43 08 | 78 | 0.75 | 37 | 1.19 | 820 | ||
| MM5 | 18 52 47.8 | 00 36 47 | 56 | 0.22 | 24 | 0.73 | 243 | em; IRAS 18502+00.33 | |
| MM6 | 18 52 48.7 | 00 35 58 | 47 | 0.36 | 32 | 1.03 | 395 | ||
| MM7 | 18 52 58.1 | 00 44 08 | 43 | 0.59 | 47 | 1.57 | 641 | ||
| MM8 | 18 52 53.9 | 00 41 16 | 41 | 0.54 | 44 | 1.46 | 588 | ||
| MM9 | 18 52 58.1 | 00 41 20 | 40 | 0.11 | 19 | 0.52 | 119 | ||
| MM10 | 18 52 52.7 | 00 38 35 | 40 | 0.10 | 19 | 0.52 | 114 | ||
| MM11 | 18 52 56.2 | 00 41 48 | 31 | 0.09 | 21 | 0.60 | 100 | ||
| MSXDC G034.43+00.24 | |||||||||
| MM1 | 18 53 18.0 | 01 25 24 | 2228 | 4.01 | 16 | 0.19 | 1187 | ||
| MM2 | 18 53 18.6 | 01 24 40 | 964 | 4.33 | 26 | 0.42 | 1284 | em; IRAS 18507+0121 | |
| MM3 | 18 53 20.4 | 01 28 23 | 244 | 1.02 | 24 | 0.38 | 301 | ||
| MM4 | 18 53 19.0 | 01 24 08 | 221 | 0.86 | 24 | 0.38 | 253 | ||
| MM5 | 18 53 19.8 | 01 23 30 | 122 | 2.24 | 51 | 0.89 | 664 | ||
| MM6 | 18 53 18.6 | 01 27 48 | 57 | 0.43 | 37 | 0.62 | 126 | ||
| MM7 | 18 53 18.3 | 01 27 13 | 55 | 0.29 | 28 | 0.46 | 87 | ||
| MM8 | 18 53 16.4 | 01 26 20 | 51 | 0.36 | 31 | 0.52 | 108 | ||
| MM9 | 18 53 18.4 | 01 28 14 | 50 | 0.53 | 39 | 0.67 | 157 | ||
| MSXDC G034.77-00.55 | |||||||||
| MM1 | 18 56 48.2 | 01 18 47 | 232 | 0.91 | 23 | 0.28 | 166 | em | |
| MM2 | 18 56 50.3 | 01 23 16 | 59 | 1.04 | 49 | 0.66 | 188 | ||
| MM3 | 18 56 44.7 | 01 20 42 | 44 | 0.08 | 16 | 0.15 | 14 | ||
| MM4 | 18 56 48.9 | 01 23 34 | 42 | 0.38 | 36 | 0.47 | 70 | ||
| MSXDC G035.39-00.33 | |||||||||
| MM1 | 18 56 41.2 | 02 09 52 | 128 | 0.42 | 21 | 0.25 | 76 | em | |
| MM2 | 18 56 59.2 | 02 04 53 | 114 | 0.25 | 17 | 0.18 | 45 | em | |
| MM3 | 18 57 05.3 | 02 06 29 | 107 | 0.44 | 24 | 0.30 | 79 | em | |
| MM4 | 18 57 06.7 | 02 08 23 | 76 | 0.59 | 34 | 0.45 | 108 | ||
| MM5 | 18 57 08.8 | 02 08 09 | 69 | 0.65 | 37 | 0.49 | 118 | ||
| MM6 | 18 57 08.4 | 02 09 09 | 56 | 0.39 | 37 | 0.49 | 71 | ||
| MM7 | 18 57 08.1 | 02 10 50 | 55 | 0.53 | 39 | 0.52 | 96 | (c) | |
| MM8 | 18 57 07.0 | 02 08 54 | 52 | 0.33 | 29 | 0.37 | 59 | ||
| MM9 | 18 57 11.2 | 02 07 27 | 50 | 0.23 | 27 | 0.34 | 42 | ||
| MSXDC G035.59-00.24 | |||||||||
| MM1 | 18 57 02.3 | 02 17 04 | 69 | 0.36 | 28 | 0.36 | 65 | em | |
| MM2 | 18 57 07.4 | 02 16 14 | 57 | 0.26 | 25 | 0.31 | 48 | ||
| MM3 | 18 57 11.6 | 02 16 08 | 44 | 0.23 | 27 | 0.34 | 41 | ||
| MSXDC G036.67-00.11 | |||||||||
| MM1 | 18 58 39.6 | 03 16 16 | 61 | 0.17 | 21 | 0.31 | 49 | (a) | |
| MM2 | 18 58 35.6 | 03 15 06 | 54 | 0.21 | 24 | 0.36 | 58 | ||
| MSXDC G038.95-0.47 | |||||||||
| MM1 | 19 04 07.4 | 05 08 48 | 119 | 0.74 | 29 | 0.35 | 117 | (a) | |
| MM2 | 19 04 03.4 | 05 07 56 | 103 | 0.46 | 25 | 0.28 | 73 | em | |
| MM3 | 19 04 07.4 | 05 09 44 | 65 | 0.07 | 12 | 0.04 | 11 | ||
| MM4 | 19 04 00.6 | 05 09 06 | 53 | 0.31 | 33 | 0.40 | 48 | em | |
| MSXDC G048.65-00.29 | |||||||||
| MM1 | 19 21 49.7 | 13 49 30 | 71 | 0.39 | 29 | 0.32 | 52 | ||
| MM2 | 19 21 47.6 | 13 49 22 | 57 | 0.29 | 26 | 0.28 | 39 | ||
| MSXDC G053.11+00.05 | |||||||||
| MM1 | 19 29 17.2 | 17 56 21 | 536 | 1.77 | 21 | 0.15 | 124 | em | |
| MM2 | 19 29 20.2 | 17 57 06 | 81 | 0.63 | 33 | 0.27 | 44 | ||
| MM3 | 19 29 00.6 | 17 55 11 | 70 | 0.18 | 19 | 0.13 | 12 | em | |
| MM4 | 19 29 20.4 | 17 55 04 | 52 | 0.64 | 44 | 0.37 | 45 | ||
| MM5 | 19 29 26.3 | 17 54 53 | 48 | 0.19 | 24 | 0.18 | 13 | em | |
| MSXDC G053.25+00.04 | |||||||||
| MM1 | 19 29 39.0 | 18 01 42 | 246 | 0.31 | 13 | 0.06 | 24 | em | |
| MM2 | 19 29 33.0 | 18 01 00 | 97 | 0.95 | 38 | 0.33 | 74 | em | |
| MM3 | 19 29 44.0 | 17 58 47 | 96 | 0.13 | 14 | 0.07 | 10 | ||
| MM4 | 19 29 34.5 | 18 01 39 | 71 | 0.15 | 17 | 0.12 | 12 | ||
| MM5 | 19 29 39.4 | 17 58 40 | 52 | 0.25 | 30 | 0.25 | 19 | ||
| MM6 | 19 29 31.5 | 17 59 50 | 47 | 0.22 | 26 | 0.21 | 17 | em | |
| MSXDC G053.31+00.00 | |||||||||
| MM1 | 19 29 50.0 | 18 05 07 | 71 | 0.36 | 29 | 0.26 | 31 | ||
| MM2 | 19 29 42.1 | 18 03 57 | 60 | 0.38 | 30 | 0.26 | 33 | ||
| MM3 | 19 29 49.7 | 18 04 39 | 21 | 0.09 | 29 | 0.25 | 8 | ||
References. — (1) Leung (1985); (2) Clemens & Barvainis (1988); (3) Bourke et al. (1995); (4) Lada & Lada (2003); (5) Motte et al. (2003); (6) this work; (7) Myers & Benson (1983); (8) Ward-Thompson et al. (1994); (9) Garay & Lizano (1999); (10) Kurtz et al. (2000); (11) Churchwell (2002); (12) this work; (13) Rathborne et al. (2005).
References. — (1) Simon et al. 2006a; (2) Simon et al. 2006b