Testing Accretion Disk Theory in Black Hole X-ray Binaries
Abstract
We present results from spectral modeling of three black hole X-ray binaries: LMC X-3, GRO J1655-40, and XTE J1550-564. Using a sample of disk dominated observations, we fit the data with a range of spectral models that includes a simple multitemperature blackbody (DISKBB), a relativistic accretion disk model based on color-corrected blackbodies (KERRBB), and a relativistic model based on non-LTE atmosphere models within an prescription (BHSPEC). BHSPEC provides the best fit for a BeppoSAX observation of LMC X-3, which has the broadest energy coverage of our sample. It also provides the best fit for multiple epochs of Rossi X-ray Timing Explorer (RXTE) data in this source, except at the very highest luminosity (), where additional physics must be coming into play. BHSPEC is also the best-fit model for multi-epoch RXTE observations of GRO J1655-40 and XTE J1550-564, although the best-fit inclination of the inner disk differs from the binary inclination. All our fits prefer to , in apparent disagreement with the large stresses inferred from the rapid rise times observed in outbursts of these two sources. In all three sources our fits imply moderate black hole spins (), but this is sensitive to the reliability of independent measurements of these system parameters and to the physical assumptions which underly our spectral models.
Subject headings:
accretion, accretion disks — black hole physics — X-rays:binaries — Stars: Individual(GRO J1655-40, LMC X-3, XTE J1550-564)1. Introduction
Black hole X-ray binaries (BHBs) are known to occupy distinct spectral states which can be characterized by the relative contribution of thermal and non-thermal emission components (e.g. McClintock & Remillard 2004). The most well-understood of these states is the thermal dominant (or high/soft) state. Here most of the flux is in the thermal component, which is generally assumed to be emission from a radiatively efficient, geometrically thin accretion disk (Shakura & Sunyaev 1973). The disk is believed to extend deep within the gravitational field of the black hole, and this makes spectral modeling of this state an important probe of both the physics of relativistic accretion disks and the properties of black holes.
In standard treatments of black hole accretion disks, the emitting matter extends down to the innermost stable circular orbit (ISCO), which is determined by the mass and spin of the black hole. Such treatments usually assume a “no-torque” inner boundary condition at this radius (e.g. Novikov & Thorne 1973), but magnetic fields may in fact exert such torques (Gammie 1999; Krolik 1999; Hawley & Krolik 2002), increasing the radiative efficiency of the disk. The structure and emission of these disks are therefore sensitive to the mass and spin of the black hole as well as any torque which may be present.
This sensitivity makes accretion disk spectral modeling a potential way to measure or constrain black hole spin (e.g. Ebisawa et al. 1993; Zhang et al. 1997; Shafee et al. 2006; Middleton et al. 2006). This method requires a model of the radial profile of effective temperature in the gravitational field of the black hole, calculation of the relativistic transfer function from the disk surface to an observer at infinity (Cunningham 1975), and spectral modeling of the surface emission in the local rest frame of the disk. Most implementations of this method approximate one or all of these components. One common approximation is to assume that the disk surface emission is a blackbody or, more generally, a color-corrected blackbody,
| (1) |
where is the specific intensity, is the effective temperature, is the Planck function, and is the spectral hardening factor (or color-correction), typically assumed to be around 1.7 (Shimura & Takahara 1995). One of the most sophisticated models of this type is the KERRBB model (Li et al. 2005) for Xspec (Arnaud 1996). It accounts for the relativistic effects on the disk effective temperature profile and the relativistic transfer function. Potential difficulties with the color-corrected blackbody approximation exist. The local spectrum may not be well approximated by an isotropic, color-corrected blackbody due to limb darkening and frequency dependent absorption opacities. Even if it can, one must still specify . It has been suggested that is a relatively strong function of accretion rate or of the fraction of energy emitted in a corona (Merloni et al. 2000).
Relativistic models (Davis et al. 2005) now exist which calculate the non-LTE vertical disk structure and radiative transfer self-consistently using the TLUSTY stellar atmospheres code (Hubeny & Lanz 1995). The relativistic effects on photon geodesics are accounted for with ray tracing methods (Agol 1997). These spectral models have now been implemented in an Xspec table model (BHSPEC; Davis & Hubeny, 2006). By calculating values of appropriate for use with KERRBB, these models have already been used to estimate black hole spins from KERRBB fits to two BHBs: GRO J1655-40 and 4U 1543-47 (Shafee et al. 2006).
In this work, we circumvent the color-corrected blackbody approximation entirely by fitting the BHSPEC model directly to BHB observations. Since the model does not include irradiation of the disk surface, we focus our efforts on thermal dominant state observations in which the non-thermal emission is a small fraction of the total flux. Fortunately, a sample of such observations made with the Rossi X-ray Timing Explorer (RXTE) already exists (Gierlinski & Done 2004; hereafter GD04).
BHSPEC still assumes that the disk emission extends only down to the ISCO and then effectively ceases due to rapid in-fall of matter interior to this radius. This assumption appears to be consistent with spectral modeling of BHBs in the thermal dominant state in that the luminosity is seen to scale roughly with the fourth power of the color temperature in several different sources (Kubota et al. 2001; Gierlinski & Done 2004). This suggests that as sources vary by over an order of magnitude in luminosity, there is a roughly constant emitting area and thus a relatively constant inner radius to the disk. It is therefore very natural to associate such a stable inner radius with the ISCO of the black hole, though the ‘emission edge’ need not coincide exactly with the ISCO (Krolik & Hawley 2002).
Not all of these sources follow the relation exactly, however. In several cases a relative hardening is seen with increasing (see e.g. GD04; Kubota & Makishima 2004; Shafee et al. 2006). A potential explanation for this hardening is that advection may be becoming increasingly important as these sources approach the Eddington limit (Kubota & Makishima 2004). Alternatively, this behavior is qualitatively consistent with the increased spectral hardening with accretion rate in the local disk atmospheres, ignoring advection (Davis et al. 2005; Shafee et al. 2006). In the BHSPEC model, the precise nature of the hardening depends strongly on the variation in surface density with radius in the disk. Currently, the surface density is determined by assuming the vertically averaged stress is proportional to the vertically averaged total pressure with a constant of proportionality . However, more general stress prescriptions could be implemented in the future. Therefore, spectral modeling could potentially provide a constraint on the nature of the stresses in these systems.
In this paper we fit these fully-relativistic, non-LTE accretion disk models to RXTE and BeppoSAX observations of BHBs in the thermal dominant state. Our purpose is two-fold: we want to test the applicability of the spectral models to these observations, and having then found suitable representations of the data, we use them to infer black hole spins and infer properties of the stresses in these system. We review our spectral fitting and results in section 2, discuss the implications of these results in section 3, and summarize our conclusions in section 4. In the Appendix we develop a simplified model to understand and motivate the variation of the BHSPEC spectra with accretion rate.
2. Spectral Modeling
Several properties of BHBs make them particularly well suited both for testing accretion disk theory and for measuring the unknown black hole properties of interest. There are several sources for which precise, independent measurements of the mass of the primary and the binary inclination are available from light curve modeling of the secondary star (e.g. Orosz & Bailyn 1997). Typically, the distance to BHBs are known with less precision, but there are exceptions. As can be seen in Table 2, the distances to LMC X-3 and GRO J1655-40 are both claimed to be known to better than 10%. BHBs have an advantage over most active galactic nuclei because of their relatively short timescales for large changes in the bolometric luminosity, which allows the same source to be observed in the same spectral state at appreciably different accretion rates. The variation of the BHSPEC model with accretion rate provides a precise quantitative prediction which is sensitive to the assumed stress prescription. Therefore, simultaneous fitting of multiple observations of the same source at different epochs provides a much more powerful constraint and potentially more information than a single fit to a single epoch.
We compare three accretion disk models for the soft, thermal emission: the multicolor disk model (DISKBB in Xspec, Mitsuda et al. 1984), KERRBB, and BHSPEC. DISKBB is the most commonly used spectral model, but it neglects relativity. Both KERRBB and BHSPEC include relativistic effects. In addition, BHSPEC includes atmosphere physics which we are interested in testing in this paper. In particular, we are interested in examining whether BHSPEC with a fixed can explain the variation in the spectral hardening with accretion rate. As a control, we compare these results with KERRBB at a fixed .
We also model the neutral absorption along the line of sight, and though we focus on observations inferred to be disk dominated, we need an additional component to account for the non-thermal emission which is present. It is widely believed that the coronal emission is due to inverse Compton scattering of seed photons from the accretion disk. In this case, a power law will tend to overestimate the flux at low energies. Therefore, we prefer to approximate the non-thermal emission with the COMPTT Comptonization model (Titarchuk 1994) in our spectral fits. We specify a disk geometry and fix the high energy cutoff in this model to 50 keV, a value high enough not to affect our fits. We also tie the seed photon temperature to the DISKBB model temperature when DISKBB is used to model the soft emission. For KERRBB and BHSPEC we fix this parameter at the best fit DISKBB value. This leaves two free parameters – an optical depth and a normalization for each data set.
DISKBB is a relatively simple model with only two parameters: the temperature at the inner edge of the disk and the model normalization. BHSPEC and KERRBB both share a number of model parameters which need to be specified or fit. The black hole spin and the accretion rate are free parameters in all fits unless stated otherwise. For BHSPEC is parameterized by where is the Eddington luminosity for completely ionized hydrogen. This value is converted to an accretion rate by assuming an efficiency which corresponds to the fraction of gravitational binding energy at infinity which is converted to radiation. Other parameters include black hole mass , disk inclination , and distance to the source . For KERRBB is an explicit parameter, but for BHSPEC kpc where is the model normalization. In some cases , , and (or ) are fixed at the estimates given in Table 2. Though is always fixed, there are also cases where and are left as free parameters. The estimates for in Table 2 are all estimates of the binary inclination. However, there is no guarantee that the angular momentum of the black hole, and therefore the inner accretion disk, is aligned with the binary (Bardeen & Petterson 1975). If one assumes that the jet axis is aligned with the angular momentum vector of the black hole, then misalignments may be common (Maccarone 2002). XTE J1550-564 and GRO J1655-40 are among the sources for which misalignment can be inferred. Therefore, we also consider fits in which and are free parameters with unconstrained and allowed to vary within the confidence intervals in Table 2. These models also allow for the presence of a torque on the inner disk which is parameterized by the increase in efficiency due to the torque relative to the efficiency of the untorqued disk .
| Name | Mass | Distance | Inclination | Reference | |
|---|---|---|---|---|---|
| (kpc) | (deg) | ||||
| LMC X-3 | 1, 2, 3, 4, 5 | ||||
| XTE J1550-564 | 6, 7 | ||||
| GRO J1655-40 | 8, 9, 10, 11 |
References. — (1) Soria et al. (2001); (2) Cowley et al. (1983); (3) di Benedetto (1997); (4) Kuiper et al. (1988); (5) Page et al. (2003); (6) Orosz et al. (2002); (7) Gierliński & Done (2003); (8) Shahbaz et al. (1999); (9) Hjellming & Rupen (1995); (10) van der Hooft et al. (1998); (11) Gierliński et al. (2001)
There are other parameters which are not shared between BHSPEC and KERRBB. Two additional parameters for BHSPEC are and the metal abundance. In the BHSPEC model, the stress is given by
| (2) |
where is the vertically averaged accretion stress and is the vertically averaged total pressure. Usually, the metal abundances are fixed at the solar value, but we also consider fits with three times solar metallicity. The color correction parameter must be chosen for KERRBB, and we fix unless stated otherwise. The value which brings KERRBB into best agreement with BHSPEC is a function of (Shafee et al. 2006), but this choice makes KERRBB roughly consistent over the range of we consider. We always fix the parameters rflag and lflag so that the spectra are limb darkened and reprocessed emission from self-irradiation is ignored. Test cases suggest that these choices do not have a significant effect on the quality of fit or the inferred values for .
2.1. Source Selection
Our work is motivated in part by spectral fitting of BHBs performed by Gierlinski & Done (2004). They already provided a sample of sources with RXTE observations in which a low fraction (under 15%) of the bolometric flux is inferred to be in the non-thermal component. We focus on three of these sources: LMC X-3, XTE J1550-564 (hereafter J1550), and GRO J1655-40 (hereafter J1655). Each one ranges over nearly a decade or more in bolometric luminosity (see Figure 2 of Gierlinski & Done 2004). This makes them particularly well suited for constraining the spectral variation over a range of . The properties of these sources are summarized in Table 2. All have reasonably precise mass estimates, and the distances to LMC X-3 and J1655 both have relatively small uncertainties. The distance to J1550 is less well constrained, but we still include it in our sample because it spans the widest range of luminosities.
One drawback of RXTE is its lack of soft X-ray coverage. The thermal components of BHBs typically peak at photon energies near or below 1 keV, whereas the RXTE band extends down to only keV. Since one of our goals is to test the applicability of the underlying accretion disk model, we would like to cover as much of the SED as possible. Even if we use other observatories, we face the difficulty that most BHBs lie in or near the Galactic plane and are heavily absorbed by the interstellar medium along the line-of-sight. Therefore, we also examine a BeppoSAX observation of LMC X-3 which has a low line-of-sight absorption column. BeppoSAX is well-suited for this purpose as it covers a very broad range of photon energies extending down to a tenth of a keV, but lacks the effective area of XMM or Chandra and their corresponding pile-up problems for such bright sources.

2.2. LMC X-3
2.2.1 BeppoSAX Data
The low energy coverage of BeppoSAX makes the fits particularly sensitive to our model for the neutral absorption. We therefore include the line-of-sight absorption column as a free parameter in our fits to the BeppoSAX data. For our best fit BHSPEC model we find cm-2. This is higher than values inferred from 21 cm absorption ( cm-2, Nowak et al. 2001) or fits to the neutral oxygen edge in observations with the Reflection Grating Spectrometer on-board XMM-Newton ( cm-2, Page et al. 2003), but lower than those found in previous modeling of the BeppoSAX data ( , Haardt et al. 2001).
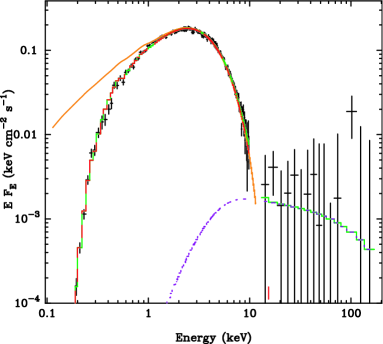
The unfolded spectrum of the BeppoSAX data is shown in Figure 1. The best fit model for BHSPEC with and which was used to generate the unfolded spectrum is also shown. The LMC X-3 spectrum is very disk dominated and the PDS provides little constraint due to the low count rate. Therefore, we fix the optical depth in the COMPTT model at , providing a flat (in ) spectrum typical of thermal dominant state observations.
We provide a comparison of the three spectral models in Table 2. With and fixed in the KERRBB and BHSPEC, each model has the same number of free parameters: two for the soft/thermal component, one for the non-thermal component, and one for the intervening absorption column for a total of four free parameters. DISKBB provides a considerably poorer fit than either KERRBB or BHSPEC. The relativistically broadened spectra are a much better representation of the soft thermal emission than the narrower DISKBB.
The quality of the DISKBB fit is sensitive to the model of the non-thermal emission. If we treat as a free parameter, drops and the fit improves slightly () but remains poor compared with KERRBB and BHSPEC. The COMPTT spectrum steepens as decreases. This extra flux in the ‘tail’ of the thermal component compensates for a decrease in which allows DISKBB to better approximate the low energy photons. The fit further improves to if we replace COMPTT with a power law. This provides a slightly better fit than KERRBB but BHSPEC is still preferred. The best fit model now requires a steep power law component which is consistent with the best fit model of Haardt et al. (2001). However, the power law flux now exceeds the DISKBB flux at low energies. This result is unphysical in a picture where the soft X-ray emission provides the bulk of the seed photons for the non-thermal component. This is also likely the explanation for why the Haardt et al. (2001) fits require a larger neutral hydrogen column. This inconsistency was also pointed out by Yao et al. (2005) who find a self-consistent fit with a Comptonized multitemperature blackbody model. In contrast, the inclusion of non-thermal emission has little effect on the values for KERRBB and BHSPEC. Thus, the BeppoSAX data can be completely accounted for by a bare accretion disk spectra as long as relativistic effects on the spectra are included.
BHSPEC provides a better fit () to the data than KERRBB for an inclination , a source distance kpc, and . Allowing to vary from 1.5-1.9 does not improve the KERRBB quality of fit significantly. The prescription for relativistic effects in the two models are essentially identical, so the differences in the spectral shapes are primarily due to the different prescriptions for the disk surface emission. The annuli spectra which make up the BHSPEC model have imprints from metal opacities and may differ from color corrected blackbodies by several percent. Additionally, annuli at different radii have local spectra which are best approximated by different values of , with usually being higher for the hotter, inner annuli. KERRBB assumes one value of for the whole disk. Though these discrepancies are not at a level which is significantly greater than the intrinsic uncertainties in the BHSPEC model, it is suggestive that a model which includes atomic physics provides a better fit.

Despite these differences in the quality of fit, KERRBB and BHSPEC both give values of for . The best fit value for for BHSPEC is a function of with giving a lower than . This is the case in all fits and is most simply understood by examining how changes in the parameters either harden (increase the mean photon energy) or soften (lower the mean photon energy) the spectra. As increases, the inner radius of the disk decreases. This results in a larger fraction of the gravitational binding energy being released in a smaller area of the disk surface. The resulting increase in in these annuli produces a spectrum with higher average photon energies. Therefore, increasing hardens the spectra, even at fixed luminosity.
The sensitivity of the spectrum to is more complex. It is strongest at high in radiation pressure dominated annuli where the surface density is low. A larger yields a lower , making the disk less effectively optically thick. For a range of , the annuli remain very effectively optically thick while the annuli become less effectively optically thick and eventually effectively optically thin as increases. For , the densities are lower and the temperatures are higher. The photons cannot thermalize as well, causing the spectrum to harden significantly. At lower , both models have sufficiently large so that spectral formation occurs nearer the disk surface at approximately the same densities and temperatures. The models still tend to be slightly less dense in the spectral forming region and are therefore slightly harder, but the differences are significantly smaller than at higher . Therefore, the dependence of the best-fit on results from an increase in from 0.01 to 0.1 hardening the spectrum so that must be reduced to compensate.
The best fit is also a function of . As can be seen in Table 2, making and free parameters does not significantly improve the quality of fit in these cases. However, it does greatly increase the uncertainty in the best fit . This is illustrated in Figure 2 where we plot the 66%, 90%, and 99% joint confidence contours for and . The strong correlation exists because lowering softens the spectrum so that must increase to compensate. This is partly because the line-of-sight projection of the azimuthal fluid velocity component decreases. This reduces the blueshift and beaming of the emission from the approaching side of the disk, and moves the ‘position’ of the high energy tail to lower energies. Also, the projected disk area increases which produces a larger flux for the observer at infinity. This needs to be compensated by a decrease in , and therefore . This decrease in lowers and again softens the spectrum. Thus, our ability to constrain is generally improved by precise, reliable estimates for . The contours in Figure 2 suggest at 90% confidence. If the binary inclination uncertainties are accurate and the inner accretion disk is aligned with the binary orbit, these constraints imply .
We also examine the variation of with the source distance . The BHSPEC model normalization is defined so that kpc. The confidence range for the distance to LMC X-3 listed in Table 2 provides a tight constraint on . However, also depends on the absolute flux calibration of the detector so that any uncertainty in absolute flux translates into an effective uncertainty for . Therefore, we consider fits where is free to vary by 20% from its nominal values of . The 66%, 90%, and 99% confidence contours in the – plane are shown in Figure 3. The best fit model lies at the upper limit of the allowed range of . The best fit is slightly larger than the range ( ) consistent with the distance constraints which are plotted as vertical dashed lines in the figure.
The strong anticorrelation between and seen in Figure 3 exists because an increase in leads to a decrease in the flux expected at the detector (i.e. a lower ). This must be accounted for by an increase in the luminosity () which would shift the spectral peak to higher energies at fixed . However, is a free parameter and it can be lowered so that the spectral peak remains fixed while increases.
| ModelaaThe full Xspec model is WABS*(Model+COMPTT). | |||||||
|---|---|---|---|---|---|---|---|
| (deg) | (kpc) | (keV) | |||||
| DISKBB | 336/177 | ||||||
| KERRBB | 67 | 52 | 275/177 | ||||
| BHSPEC | 0.1 | 67 | 52 | 243/177 | |||
| BHSPEC | 0.01 | 67 | 52 | 246/177 | |||
| BHSPEC | 0.01 | 238/175 |
Note. — All uncertainties are 90% confidence for one parameter. Parameters reported without uncertainties were held fixed during the fit.
We also use these models to test for the possibility of magnetic torques on the inner accretion disk. The energy release by a torque increases the fraction of emission at small radii and increases the effective temperature of the annuli. This produces a hardening of the spectrum similar to an increase in . At the time of publication, BHSPEC spectra have only been computed from disks with non-zero torques for . KERRBB can be used to examine torques at all , but the fits provide little constraint as varies over the entire range of the model from zero to one at 90% confidence when is a free parameter. As expected, increases in are offset by decreases in . An upper-limit on torque can be obtained by fitting BHSPEC at . The best fit with and . This value of is only slightly greater than in the untorqued case, and the best fit inclination is consistent with the constraints on the binary inclination, so it is difficult to rule out the possibility of large torques from these data.
2.2.2 RXTE Data
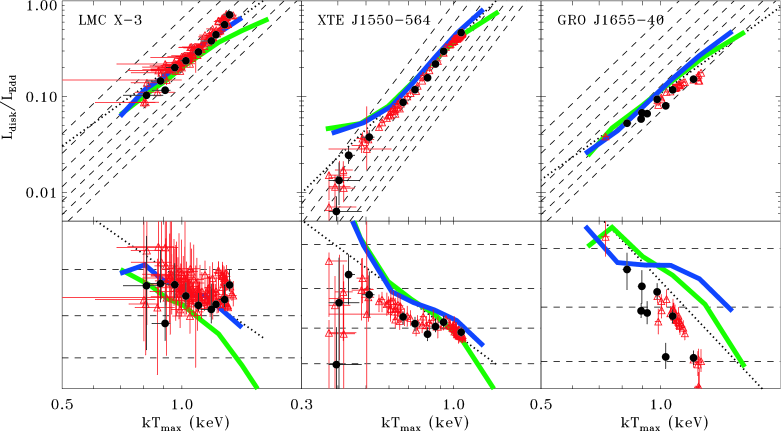
GD04 have already selected a sample of disk dominated RXTE observations for several sources, including LMC X-3. From these, we have selected a subset of 10 epochs which evenly cover the range of disk luminosities inferred from the GD04 analysis. The luminosities of these epochs are plotted versus the maximum color temperature in the first panel of Figure 4. The black filled circles correspond to the data sets used in our work and red triangles represent the other epochs in the GD04 sample. These plots were generated by taking DISKBB fit results and making corrections for the temperature profile and relativistic effects (Zhang et al. 1997). This plot only includes epochs in which the disk component is inferred to account for greater than 85% of the bolometric flux. A detailed explanation of the analysis can be found in GD04. The values of and are evaluated using the estimates in Table 2 so there is some uncertainty in collective position of these symbols on the plot. However, the placement of the points relative to each other is robust to these uncertainties so that reproduction of the shapes of these relations provides an important test for our disk models. We repeat the same procedure for observations of J1550 and J1655 and plot these in the center and right panels of Figure 4, respectively.
As stated in section 1, the luminosity is roughly proportional to the fourth power of the maximum temperature. The dashed curves represent lines of constant where . In the bottom panels of Figure 4 we have also plotted in order to more easily evaluate spectral hardening relative to this overall trend. Comparison of the data with these curves shows some evidence for hardening with increasing for J1665 and J1550. LMC X-3 is roughly consistent with a constant , but a close examination suggests there might be weak signs of hardening above keV and softening at the highest temperatures.
We investigate this spectral evolution with by fitting the models directly to the data. We consider the same models as in section 2.2.1, but we now fix the absorption column since it is not well constrained without the low energy coverage. For LMC X-3 we fix it at to be consistent with the BeppoSAX fits. We initially fix and , and fit only a single value of for all epochs. We also fix for KERRBB and or 0.01 for BHSPEC. Only (or ) is allowed to vary for each epoch. We also consider models with DISKBB, fitting a single normalization simultaneously to all data sets. This is also consistent with assuming a fixed color correction and constant effective area for each epoch. With these choices, each model has the same number of free parameters. There is a single parameter shared by all data sets ( or DISKBB normalization), and two parameters for each individual data set: one for the soft/thermal component (, , or ) and a normalization for the non-thermal component. For BHSPEC, we also consider fits where and (or ) are free parameters. Since only a single value of either parameter is fit for all epochs, this provides at most two additional parameters.
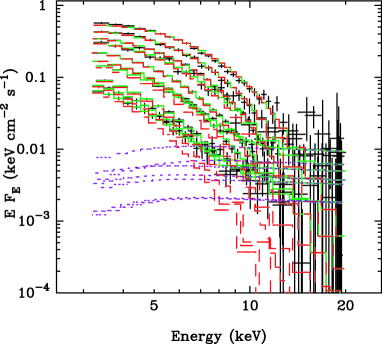
In oder to visualize the variation of the spectral shape with , we plot in Figure 4 the relations (solid curves) derived from the best fit BHSPEC models at fixed for =0.1 and 0.01. These curves are calculated by generating artificial spectra with our best fit models, and then fitting them using the same procedure that GD04 used for the real data. The plot therefore provides a comparison of fits with DISKBB, both to the data, and to artificial spectra generated from the best-fit BHSPEC models. It is not a direct comparison of BHSPEC with the data. This explains why the best-fit BHSPEC curves do not go through the ‘data points’ in the J1550 and J1655 plots. The two types of fits find a different partition of the spectra between the soft/thermal and hard/non-thermal components, with additional flux accounted for by the non-thermal emission in the BHSPEC fits. The implications of this are discussed further in section 3.3. For comparison, we also show curves with (dotted lines). These curves represent simple, analytic estimates for the spectral hardening in effectively optically thick disks when the effects of Comptonization are negligible. The derivation of this relation in presented in the Appendix.
Based on the discussion above, it is reasonable to expect that the difference in quality of fit between models with fixed (KERRBB and DISKBB) and BHSPEC might be dominated by the differing predictions for the variation of spectral hardening with changing . The lack of hardening at the highest seen in Figure 4 for LMC X-3 suggests that models with constant or BHSPEC with a low value of would provide the best representations of the data. These predictions are borne out in simultaneous fits to the LMC X-3 data, which are summarized in Table 3. The unfolded spectra are plotted in Figure 5 with the best fit BHSPEC model for and . DISKBB, which is representative of a disk with a fixed emitting area and constant , provides the best fit. A comparable is provided by KERRBB with and . The fit with BHSPEC for gives an acceptable , but provides a poorer representation than the fixed models. The model does not provide an acceptable fit. For BHSPEC, the largest contributions to come from the highest luminosity epoch. As seen in Figure 4, the BHSPEC models seem to harden too rapidly to accommodate all epochs simultaneously. BHSPEC hardens more rapidly with increasing for than 0.01, leading to the significantly poorer fit. In order to make the inner disk annuli more effectively thick, we increased the metal abundances to three times the solar value. However, this had limited impact on the spectral shape and did not improve the quality of fit appreciably.
The best fit values of and their 90% confidence intervals are summarized in Table 3. They are systematically lower () than the values inferred from the BeppoSAX fits (). Most of this discrepancy can be accounted for by cross calibration differences between the two observatories. Cross-calibration111http://heasarc.gsfc.nasa.gov/docs/asca/calibration/3c273_results.html campaigns on 3C 273 show that the RXTE PCA flux is about 20% higher than the BeppoSAX data. At fixed normalization, this requires a increase in which leads to an increase in . For a given , this change must be offset by a decrease in which leads to a systematically lower value for the RXTE fits relative to BeppoSAX fits.
2.3. XTE J1550-564
As seen in the middle panels of Figure 4, J1550 varies over an order of magnitude in and we have chosen 10 observations which sample this range. We fit J1550 (and J1655) with the same model which we applied to LMC X-3, but we found statistically significant residuals consistent with reflection features. (These were apparently unnecessary in LMC X-3 because the spectra are so strongly disk dominated.) To account for these residuals we add a GAUSSIAN and apply a SMEDGE (Ebisawa et al. 1991) to the COMPTT component to approximate reprocessing at the disk surface. We fix the widths of these components to 0.5 keV and 7 keV, respectively. This adds two free parameters from each new component. We also let the optical depth vary in the COMPTT component for a total of five additional parameters in each epoch. The fit results with these additional components are summarized in Table 3.
As with LMC X-3, all of the models provide an acceptable fit, though there is still considerable variation in the values. There is a statistically significant preference for the DISKBB model over KERRBB. Since both models have a constant , the difference in the quality of fit must be due to the overall spectral shape and not simply its evolution with . A comparison of the best fit spectral shapes shows that relativistic KERRBB models are harder than those of DISKBB over the RXTE band, which seems to be primarily the result of relativistic broadening.
The BHSPEC model with provides a better fit than , consistent with the prediction of the comparison in Figure 4. However, the model still provides a poorer fit than DISKBB. In contrast to KERRBB, the best fit spectra fall off more steeply with increasing photon energy than the DISKBB spectra. This behavior seems to be primarily due to absorption features (primarily Fe K) in the tail of spectrum. When we let and float, the BHSPEC fit improves and the values are now slightly better than DISKBB. The best fit inclination is lower ( deg) and the spin is higher (), producing slightly harder spectra with less pronounced absorption features than in the case. For , the best fit is relatively low () for both KERRBB and BHSPEC, so allowing to vary changes considerably.
Apparent motion has been claimed to be observed in the radio emission from this source (Hannikainen et al. 2001) suggesting for ballistic motion. This implies a misalignment of at least if the jet is aligned with the black hole angular momentum vector. The best fit inclination deg is consistent with this upper limit and may be compatible with an inner disk aligned with the black hole via the Bardeen-Petterson effect.
2.4. GRO J1655-40
Of the three sources considered in this work, J1655 displays the strongest evidence of hardening in Figure 4, suggesting that the models with fixed will provide poorer fits than BHSPEC. In fact, KERRBB does not provide an adequate fit to the data, and a luminosity dependent trend can be seen in the residuals. However, DISKBB can still provide an adequate fit and is even preferred to BHSPEC for . As in J1550, the best fit KERRBB spectra are harder than those of DISKBB. These results again suggest that the overall differences in spectral shape (as opposed to the variation with ) provide the dominant effect on the quality of fit. Unlike LMC X-3 and J1550, the BHSPEC model with provides a better fit than . Comparison with the bottom-right panel of Figure 4 suggests that the soft, thermal component in J1655 is hardening more strongly with increasing luminosity than can be easily accounted for with the model.
At fixed inclination, BHSPEC with provides the only relativistic fit which is marginally acceptable. The best fit in this case suggests a moderate spin which is reasonably consistent with other investigations (, Gierlinski et al. 2001; , Shafee et al. 2006). KERRBB also yields a similar spin () for . The small discrepancy with the Shafee et al. (2006) is likely due to our choice of a single and to differences in our modeling of the non-thermal emission.
Allowing to be a free parameter significantly reduces for both values of , but now provides a slightly better fit. As with LMC X-3 and J1550, the spin is very sensitive to the inclination. For both values of the best fit , the lower limit of the model. (We have not yet extended BHSPEC to retrograde spins.) We find and for , and and for .
Radio observations of J1655 have inferred a jet inclination of to the line of sight (Hjellming & Rupen 1995). Assuming the jets are aligned with the angular momentum axis of the black hole, this would imply an inner disk inclination (to the plane of the sky) of , consistent with the best fit above. However, disk alignment only occurs for black holes with non-zero angular momentum and the transition radius is expected to increase with increasing spin (Bardeen & Petterson, 1975). Therefore, because these fits find , they do not provide a self-consistent picture for a misaligned disk scenario.
| LMC X-3 | XTE J1550-564 | GRO J1655-40 | |||||
|---|---|---|---|---|---|---|---|
| ModelaaThe full Xspec model is WABS*(Model+COMPTT) for LMC X-3, and WABS*(Model+GAUSSIAN+SMEDGE*COMPTT) for J1550 and J1655. | |||||||
| DISKBBbbA single normalization is fit for all data sets. | 296/431 | 230/355 | 284/304 | ||||
| KERRBBccThe hardening factor is fixed at . Fit parameters were selected so that limb darkening was included but self-irradiation was not. | 296/431 | 301/355 | 439/304 | ||||
| BHSPEC | 0.1 | 1190/431 | 324/355 | 330/304 | |||
| BHSPEC | 0.01 | 359/431 | 256/355 | 369/304 | |||
| BHSPECddBoth and are free parameters with the value of allowed to vary over the full range but constrained to lie within the confidence limits reported in Table 2. The best fit values are deg, kpc for LMC X-3; deg kpc for J1550; and deg, kpc for J1655. | 0.01 | 307/429 | 221/353 | 234/302 | |||
Note. — All uncertainties are 90% confidence for one parameter. Parameters reported without uncertainties were held fixed during the fit. Unless otherwise noted, the values of , , and were fixed at the estimates given in Table 2.
3. Discussion
One of the principle aims of this work was to test the applicability of the relativistic -disk model in BHBs. The spectral fitting discussed in section 2 presents mixed results. The significant improvements in relative to DISKBB resulting from the BHSPEC and KERRBB fits to the BeppoSAX data provide a strong case for relativistic broadening. DISKBB alone is too narrow to adequately approximate the soft, thermal emission from LMC X-3. The additional quality of fit improvement for BHSPEC relative to KERRBB might also be evidence for modified blackbody and smeared absorption features in the spectrum.
In light of these results, it is surprising that DISKBB with a fixed normalization seems to provide a better fit to the RXTE data than KERRBB or BHSPEC in all three sources when we fix at the binary inclination. Since it is preferred to both relativistic models, the difference cannot simply be due to the differences in the degree of spectral hardening as luminosity changes. This could be taken as evidence against relativistic broadening, but the innermost radii implied by the DISKBB fits are consistent with coming from near the black hole. A comparison of the best fit spectral shapes for all three models shows differences at the level. The KERRBB spectral shapes tend to be broader (harder in the 3-20 keV band) than both DISKBB and BHSPEC. The differences between BHSPEC and KERRBB seem to be mostly due to broad absorption features which cause the BHSPEC model to fall off more strongly with increasing energy in the tail of the spectrum. Therefore, it is conceivable that DISKBB spectrum could be mimicking similar, but slightly weaker, features in data, though it is surprising that it does this consistently and effectively in all three sources.
Alternatively, it may simply be that our estimates for , , or are in error. When we allow to be a free parameter, BHSPEC provides a better fit than DISKBB in both J1550 and J1655. In both cases, observations of the radio jets suggest the angular momentum of the black hole is misaligned with that of the binary. It is suggestive that in both cases we find values for consistent with the constraints implied by the jets, rather than the binary inclination. In the case of LMC X-3, where a jet has not been observed, the best fit is more nearly face on than the measured binary inclination. It is consistent with the binary inclination at 90% confidence for the BeppoSAX data, but not for the RXTE spectral fits.
A third possibility is that the non-thermal emission and Compton reflection components are not being correctly accounted for by our prescription. If this is a problem, it should be minimized by looking at LMC X-3, which has the most disk dominated spectra of the three sources and relatively little evidence for reflected emission. For LMC X-3 the BHSPEC residuals are clearly dominated by the most luminous epoch for which BHSPEC predicts too much hardening with increasing luminosity for either value of . If we ignore the most luminous epoch improves to 257/388 for BHSPEC with and , but only improves slightly to 256/388 for DISKBB, providing comparable fits. Allowing to be a free parameter allows the BHSPEC fit to improve even further for slightly more face on values. If remains fixed at , the fit with BHSPEC also improves by allowing the model normalization to vary within 20% of the nominal value. This is a larger range of normalization than that associated with distance uncertainty and accounts for possible errors in the absolute flux calibration. Thus for LMC X-3, the shape of the spectra seem to be best represented by BHSPEC, but the evolution of the spectral hardening with at the highest luminosities is not consistent with the predictions of a simple -disk model.
3.1. Spectral Hardening and the Stress Prescription
The three relations presented in Figure 4 show that differences exist in the spectral evolution with disk luminosity from source to source. LMC X-3 has the most scatter and is reasonably consistent with a constant , though the lower-left panel of Figure 4 shows evidence of a weak hardening for and softening for . J1550 is consistent with weak hardening and J1655 seems to show more significant hardening. A comparison of the KERRBB and BHSPEC fit results seems to agree with these descriptions. At fixed , KERRBB with is preferred for LMC X-3, but BHSPEC provides a better fit in both J1550 and J1655. Fitting a single for all epochs with KERRBB does not alter this result. A comparison of BHSPEC fits with and 0.01 is also generally consistent. With fixed at the estimate for the binary inclination, is preferred for LMC X-3 and J1550, but provides a better fit for J1655. If is a free parameter, provides a better fit for all three sources, though the improvement is small for J1655.
As discussed in section 2.2.1 and the Appendix, the sensitivity of the spectra to comes about primarily because determines . For sufficiently large , the spectral shape depends only weakly on . However, if drops sufficiently, the disks begin to become effectively optically thin at small radii. Once the hottest annuli are effectively optically thin, they become increasingly isothermal or inverted in their temperature profiles as inverse Compton scattering in the now hotter surface layers increasingly dominates the cooling. This is much less efficient than thermal cooling and the spectra harden rapidly as temperatures rise with increasing (Davis & Hubeny 2006). Such effects are responsible for the hardening in the models at high in Figure 4. Our results suggest that these multi-epoch fits are sensitive to these effects and may even be able to differentiate between the -disk prescription and more general models of angular momentum transport in these disks.
In the context of the prescription, our fit results seem to rule out fixed values of for LMC X-3 and possibly J1550. At first sight, this appears inconsistent with the values inferred for the outburst phases of dwarf novae (Lasota 2001) and soft X-ray transients (e.g. Dubus et al. 2001). However, it is important to note that the disk instabilities that drive the outburst time scales are associated with regions of the disk where gas pressure dominates radiation pressure. In contrast, the X-ray spectra are dominated by the innermost regions of the disk where radiation pressure can be important at high . There is no reason to believe that either or the stress prescription should be the same at all radii in the disk.
It may be that the classical stress prescription of equation (2) is not valid in radiation pressure dominated disks. Alternative stress prescriptions have long been considered, partly because they can produce thermally and viscously stable disks (e.g. Piran 1978). In addition, there have been proposals that magnetohydrodynamical turbulence may produce stresses that are limited to values that are related in some way to the gas pressure (e.g. Sakimoto & Coroniti 1981, Merloni 2003).
It is noteworthy that LMC X-3 reaches the highest Eddington ratios among the sources fit here, and that the spectrum even appears to soften slightly at these highest luminosities. A substantial reduction in stress at might explain this, perhaps linked to the onset of a disk instability, which appears to be present in the only other source to consistently exceed such luminosities, GRS 1915+105. Fits with BHSPEC to GRS 1915+105 show that this source has ‘stable’ disk spectra (i.e. constant for longer than 16 sec) from and from which are consistent with the expected hardening with luminosity (Middleton et al. 2006). However, there are no stable disk spectra from this source in the range , exactly where the LMC X-3 spectra show slightly different properties than expected.
Other effects might be important at the high luminosities. The disk models used in BHSPEC are actually somewhat inconsistent for , as the innermost annuli then have . Radial transport of accretion power is increasingly important in this regime. In addition, magnetic torques across the ISCO may be more important (Afshordi & Paczyński 2003). However, both of these effects would tend to make the inner annuli hotter and/or more effectively optically thin. We would expect this to increase the hardening, in contrast to what is observed. As the Eddington ratio increases, increased inhomogeneities in the magnetorotational turbulence (Turner et al. 2002) and photon bubbles (Begelman 2001) may mitigate this by producing a softer spectrum and a geometrically thinner disk than would be expected in a homogeneous model.
3.2. Estimates for Black Hole Spins
The total mass accreted over the lifetime of these sources expected to be small (King & Kolb 1999; Shafee et al. 2006). As a result, only a small increase in the angular momentum of the black hole is expected, and so our spin measurements are likely probing the natal spin distribution of the binaries. Therefore, these low to moderate spin estimates () place constraints on black hole formation scenarios. They may also constrain spin-dependent models for jet production (Middleton et al. 2006) since both J1550 and J1655 are microquasars. We characterize these spins as ‘moderate’ because even for , the proximity of the ISCO to the event horizon and the resulting radiative efficiency (, ) are substantially less extreme than in the maximally spinning spacetime (, , ). These moderate spins are in contrast to estimates for spin at or near that have been inferred from other methods, including spectral fits to the Fe K line and some interpretations of the high frequency quasi-periodic oscillations (QPOs).
Broad Fe K line emission has been seen in ASCA observations of J1550 and J1655 (Miller et al. 2004). The emission was modeled with a relativistic disk line profile calculated in a maximally spinning Kerr spacetime (LAOR in Xspec, Laor 1991), but with inner radius allowed to vary. The best fit inner radius for J1655 was small with , suggesting and possibly near maximal (). J1550 is less well constrained with depending on the model, though it may also be consistent with near maximal spin. The strongest constraints on come from the presence of a broad, asymmetric red wing which extends down to 4 keV in the best-fit models. Therefore, a principle source of uncertainty for applying this method is modeling the underlying continuum to accurately gauge the shape and extent of the line wing. We refer the reader to Done & Gierlinski, (2005) for a more detailed discussion of uncertainties associated with this method.
The reproducibility of the frequencies of the pair of high frequency QPOs from one observation to the next suggests they might also provide a direct probe of the black hole spacetime. As a result, prospective models of QPOs often provide constraints on . For example, if the lower frequency member of the pair in J1550 and J1655 is identified as an axisymmetric radial epicyclic oscillation, then black hole spins of are required (Rezzolla et al. 2003, Török 2005). The reason is simple: the radial epicyclic frequency has a maximum at some radius, and that maximum is below the observed QPO frequency for the observed black hole masses unless the spin is high. The same conclusion holds in diskoseismology models if the lower frequency member is identified with a low order axisymmetric “g-mode”, because it has a frequency less than the radial epicyclic frequency within the mode trapping region (e.g. Wagoner et al. 2001). However, there are many possible oscillation modes in accretion disks, and other mode identifications can be made which are more consistent with moderate spins (e.g. Blaes et al 2006a).
In principle, the high signal-to-noise RXTE data allow us to place very tight constraints on the spins of BHBs (see e.g. Table 3). However, the relatively small uncertainties in Table 3 do not account for uncertainties in , , and . There are degeneracies among the fitting parameters in the way that they affect the spectrum, e.g. the correlation between and seen in Figure 2. Therefore, when and are free parameters, can change significantly. For the RXTE data, the uncertainty ranges for increase when and are free, but still remain relatively small. This also leads to rather small formal uncertainties for and , though is at the limit of allowed range for LMC X-3 and J1655. So these data are capable of constraining all the parameters simultaneously, because changes of only a few percent in the spectral shape in the high energy tail of the spectrum lead to substantial changes in . However, we caution that the models themselves are uncertain at the few percent level due to our interpolation method alone (Davis & Hubeny 2006). Therefore, this method of spin estimation can only be used with good precision when reliable and precise constraints on , , and are available.
All of these methods of spin estimation have their weaknesses, as all rely to varying degrees on uncertain physical assumptions. An important example relevant for both Fe K line and our continuum spectral fits is the assumption that the disk emission extends to the ISCO, and effectively ceases interior to this radius. In principle, the disk (or its emission) could be truncated at larger radius and our spins would be underestimates. Alternatively, significant emission might be generated or reprocessed inside the ISCO (Krolik & Hawley 2002), making the interpretation of both estimation methods more difficult.
Several uncertainties also remain in other physical assumptions which underly the BHSPEC model, because we still lack a complete understanding of the magnetohydrodynamical structure of the accretion flows. There are several modifications which likely lead to a hardening of the spectra, including increased dissipation near the disk surface (Davis et al. 2005), an increase in the density scale height due to magnetic pressure support (Blaes et al. 2006b), surface irradiation by the non-thermal emission, and torques on the inner edge of the disk. Other processes might lead to a softening of the spectra. Opacity due to bound-bound transitions of metal ions, which is not included in BHSPEC should increase the ratio of absorption to electron scattering opacity, pushing the spectrum closer to blackbody. Inhomogeneities, such as those caused by compressible magnetohydrodynamical turbulence (Turner et al. 2002) or the photon bubble instability (Turner et al. 2005), may also soften the spectrum. They may increase the effective ratio of absorption to scattering opacity because photon-matter interactions are dominated by the densest regions (Davis et al. 2004), or through a reduction in the density scale height (see e.g. Begelman 2001) leading to an increase in the average density of the disk interior. Given all these possibilities, it is difficult to say with certainty what net effect modifying our assumptions or including these additional processes would have on the disk spectra. If the effects which harden the spectra are more important, BHSPEC will underestimate the spectral hardening and would then require higher spins to fit the data, making our spin measurements overestimates and vice-versa.
Given these uncertainties, it is conceivable that one could reconcile the spectral constraints with if the BHSPEC model overestimates the actual spectral hardening. Spins this high would bring our estimates in line with the published uncertainties for the Fe K estimates and some of the QPO-based measurements. Reconciling our spectral models with the extreme spin () is more difficult. We have attempted to quantify this in the case of J1655 by fitting the data with KERRBB for , but with as a free parameter. For or , an adequate fit can be obtained only for which corresponds to blackbody radiation. Electron scattering opacity dominates at the relevant temperatures so nearly blackbody emission is highly unlikely. One could obtain agreement with more reasonable color corrections () by allowing to be a free parameter. However, this requires , in disagreement with the inclinations from both the binary and jet observations.
3.3. Uncertainties due to Hard X-ray Emission
A potential difficulty for deriving constraints on or by this method is the need to account for the non-thermal emission. This is particularly true with RXTE data when only the high energy tail of the spectrum is typically observed. Even though we infer the models’ bolometric fluxes to be dominated by the softer thermal component, the non-thermal component accounts for a substantial fraction of the 3-20 keV emission in many of the cases. The decomposition of thermal and non-thermal emission is clearly dependent on the choice of model for the thermal emission. It can be seen in Figure 4 that the values derived from the best-fit BHSPEC models for J1550 and J1655 are softer (lower ) at fixed than those derived by GD04 who fit DISKBB directly to the data. This means that emission which was being accounted for by the DISKBB model is partly being accounted for by the non-thermal emission in the BHSPEC fits. The fits also depends on the choice of model for the non-thermal component. The COMPTT model assumes a single Wien spectrum for the soft photon input. A model with a multitemperature disk spectrum for the seed photon input (THCOMP, Zdziarski et al. 1996) provides more low energy photons for a given temperature. Therefore, a THCOMP spectrum which matches COMPTT at higher photon energies will tend to have more flux at lower energies. We find that the quality of fit can change significantly (e.g. DISKBB is no longer preferred to BHSPEC for J1550 at fixed ) if we replace COMPTT with THCOMP, though the best-fit spins and preferred values seem more robust. The LMC X-3 observations are much more disk dominated than those of J1550 and J1655, and are much less sensitive to the choice of model for the non-thermal emission.
The effects of the non-thermal emission can be minimized if we observe these sources with detectors sensitive to lower photon energies, as most of the spectra peak below the lower limit of the RXTE band. Thus, the RXTE fits can be sensitive to changes of only a few percent in both the non-thermal emission model and the shape of the high energy tail of the BHSPEC models. The shape of the high energy tail of the BHSPEC spectra is uncertain at the several percent level due to our interpolation scheme (Davis & Hubeny 2006). Line-of-sight absorption at softer-photon energies will put practical limits on such modeling, and makes sources located out of the Galactic plane (such as LMC X-3) particularly well suited for this type of study.
4. Conclusions
We analyze disk-dominated spectra of three black hole binaries: LMC X-3, XTE J1550-564, and GRO J1655-40, fitting them with a simple multitemperature blackbody model (DISKBB), as well as sophisticated relativistic disk models (KERRBB and BHSPEC). For LMC X-3, this includes BeppoSAX data, which cover the 0.1-10 keV energy band in which the majority of the bolometric flux of the disk is emitted. In this case we find a statistically significant preference for the relativistic models over DISKBB. At lower significance, we also find a preference for BHSPEC over KERRBB which may suggest the spectra are sensitive to atomic and radiative transfer physics which are calculated explicitly in BHSPEC.
We also examine RXTE spectra for each of the three BHBs using simultaneous, multi-epoch fits to each source. When we fix the relativistic model at the independent estimates for the binary inclination in Table 2, we find DISKBB is preferred over both relativistic models for both J1550 and J1655, though is still acceptable in most of the relativistic model fits. If we allow the inclination to be a free parameter, BHSPEC is the best-fit model for both sources. The best fit inclinations are both consistent with constraints inferred from radio observations of the jets in these sources which might be accounted for by a misalignment of the black hole spin with the binary orbital angular momentum. BHSPEC is also the best fit model for LMC X-3, if we ignore the highest luminosity epoch where additional physics appears to be important. The best-fit inclination is marginally consistent with the constraints on the binary inclination in this source.
Using the binary inclination estimates in Table 2, we are able to derive precise estimates for the black hole spin. However, the inferred values of the spin are functions of inclination, and the spin changes if the inclination of the X-ray emitting, inner disk annuli differs significantly from independent estimates. The best fit spin is also sensitive to the source distance and absolute flux calibration through the model normalization. Accurate and precise estimates for all these parameters as well as the black hole mass are therefore a prerequisite for accurate and precise spin estimates. We find relatively moderate spins (), even when inclination is a free parameter in our fits. For J1655, our maximum spin estimate is only slightly lower than the limits ( at 90% confidence) implied by fits to Fe K lines (Miller et al. 2004) and certain models of high frequency QPOs ( e.g. Wagoner et al. 2001; Rezzolla et al. 2003; Török 2005). The spin of J1550 is more weakly constrained by the Fe K fits (Miller et al. 2004), and is consistent with our estimates. However, for both sources the best fit Fe K models are also consistent with nearly ‘maximal’ spins () which would be difficult to reconcile if the BHSPEC models provide an accurate approximation to the spectra of the accretion flows in these sources.
We also find that our fits are sensitive to the assumed form of the angular momentum transport through its effects on the disk surface density. We consider an stress prescription with and 0.01, finding approximate qualitative agreement between the diagrams and the model predictions (see figure 4). We find that all three BHBs are consistent with a single value of , preferring to (though only weakly in the case of J1655). These results are in contrast to the standard disk instability model of soft X-ray transients (see e.g. Dubus et al. 2001) which requires in the outer disk. If we include the most luminous epoch in our fits to the RXTE data of LMC X-3, models with constant provide a better fit than BHSPEC with either . BHSPEC fails to account for the most luminous epoch because it predicts continued spectral hardening at the highest Eddington ratios while the observed spectra appear to soften. This suggests the onset of additional physics which softens the spectrum as the Eddington ratio nears unity.
Appendix A A Simple Estimate for the Spectral Hardening
A major focus of this work is understanding if a standard accretion disk model can reproduce the spectra of the thermal dominant state, including its variation with luminosity. This task is difficult because it involves a self-consistent calculation of the vertical structure and radiative transfer in a number of annuli. This requires the solution of many coupled non-linear differential equations, and sophisticated methods (e.g. Hubeny & Lanz 1995) are needed to solve this problem with precision. However, it is insightful to first examine the extent to which the results of the detailed calculation can be inferred from simple (albeit somewhat crude) arguments before comparing with the data.
We focus on a single annulus (the one with the largest ) which remains at a fixed radius in the disk as varies. We make the further approximation that all the spectral variation is encapsulated in a single parameter , the color correction in equation 1. In the standard model , with , , and fixed as varies. We can relate to via
| (A1) |
where is the Stefan-Boltzmann constant, is the gravitational constant, and Keplerian frequency. For simplicity we have dropped the ‘correction factors’ due to relativistic effects and the no torque inner boundary condition. Now we have reduced the problem of calculating the relation to finding as a function of .
In order to evaluate we need an approximate scheme for the spectral formation. In our models, the spectra harden because electron scattering dominates the opacity, leading to deviations from local thermodynamic equilibrium (LTE) and modified blackbody spectra. The resulting spectra are harder than a blackbody at as typical photon energies are higher. The photons are thermally emitted deeper in the atmosphere and their energy distributions are characteristic of the temperatures where they are formed. If the opacities are frequency dependent the depth of formation (thermalization surface) varies with frequency and photons at different frequencies originate from different depths with different temperatures. However, over a broad range of temperatures where bound-free processes dominate, the true absorption opacity is a much weaker function of frequency than in the free-free case. This ‘grey’ opacity dependence yields a spectrum which can be crudely approximated by a diluted Planck function with a temperature evaluated at the depth of formation (Davis et al. 2005). Therefore, a simple estimate for is given by . If the opacity has a stronger frequency dependence, the Planckian shape will be a poorer approximation, but this estimate of will still be crudely correct if is evaluated near the spectral peak.
In the electron scattering dominated atmospheres we are considering, where is the approximately constant electron scattering opacity and is the column mass where the effective optical depth is equal to unity. It can be approximated by , where is the absorption opacity evaluated at . In general, is a frequency dependent quantity and should be evaluated by integrating from the surface inward. For our approximate estimates, it is useful to ignore the frequency dependence and consider all quantities with an asterisk subscript as being evaluated at a frequency near the spectral peak. For simplicity, we assume an absorption opacity of the form and find
| (A2) |
The temperature at an optical depth in an annulus can be estimated using an LTE-grey model with mean opacities (Hubeny 1990), yielding
| (A3) |
Here, is the optical depth at the disk midplane, and is the Planck mean opacity. We can use this expression to evaluate the temperature at the depth of formation
| (A4) |
where we have assumed , , and . These limits are appropriate for annuli with large and correspond to lower values of and/or . In this approximation, equation (A4) shows that depends only on through
| (A5) |
Next, we need an expression for density. In the range of , , and of primary interest to us, the annuli are radiation pressure dominated at the midplane. However, strong gas pressure gradients are still needed to support the atmosphere near the surface (Hubeny 1990) where the radiation force ceases to increase with height above the midplane as fast as the tidal gravity. Hydrostatic equilibrium is then given by
| (A6) |
where is the height above which the gas pressure gradient dominates (of order the radiation pressure scale height), is the local isothermal sound speed, is the mean molecular weight, and is the proton mass. Using the definition of column mass , equation (A6) becomes
| (A7) |
We can use this to solve for , approximating the atmosphere as isothermal. We find
| (A8) |
This expression can be integrated to find ,
| (A9) | |||||
where and erfc denotes the complimentary error function. The argument of the erfc is typically large in the range of interest. In the limit of large , and equation (A9) can be evaluated to find
| (A10) |
The expression for is difficult to approximate, and we must appeal to the full atmosphere calculations for guidance. Typically, both and increase with but their difference tends to decrease. It decreases only weakly in annuli where and g cm-2, but more rapidly with in annuli where is larger and/or is smaller. However, in these annuli the assumptions underlying equation (A10) are increasing invalid, so over the range of interest we approximate as a constant. Including the decrease in would make a stronger function of , but only weakly since and . Since , this approximation is better for lower .
Combining equations (A2), (A4), and (A10), we can solve for the dependence of , , and on :
where would be the relevant value for a Kramer’s opacity law. The bound-free opacity dominates the true absorption opacity in the models at the temperatures of interest and the mean opacity is not well approximated by a Kramer’s law at these temperatures and densities. We find empirically that a slightly weaker temperature dependence () yields better agreement between equation (A2) and the simulation results. For we find from equation (A5) that , so that we expect to increase with temperature, but with a weak dependence. The resulting relation is plotted as a dotted line in Figure 4, where we have used equation (A1) to obtain . The normalization is arbitrary and chosen to facilitate comparison with the models.
It is worth noting the role that density gradients near the surface play in producing this trend. The choice of yields independent of , a reasonably good approximation for model annuli with large . If we instead assume (as is commonly done) that radiation pressure dominated annuli are constant density with equal to the midplane value of the density , we find a much stronger density dependence since (Shakura & Sunyaev 1973). This produces a much stronger dependence of and on . It also yields a stronger dependence of on since . The approximation becomes increasingly relevant when declines, either due to an increase in or an increase in (see e.g. Shakura & Sunyaev 1973). However, the large ’s that would result are not typically seen in the data. As pointed out by Shimura & Takahara (1995), this is largely the result of Compton scattering effects when and become large.
It is difficult to address the effects of Compton scattering in detail without attempting a full solution of the radiative transfer equation. However, some insight can be gained by examining the behavior of the -parameter (see e.g. Rybicki & Lightman 1979)
| (A11) |
where is temperature, is Planck’s constant, is the mass of the electron, is the speed of light, and is the number of electron scatterings. The typical ratio of final to initial photon energy is . In an annulus, the temperature increases with optical depth as in equation (A3). Photons produced near will tend to have higher energies than the electrons they encounter as they scatter out of the atmosphere. Therefore, so that the final photon energy is less than the initial photon energy and is negative.
For photons produced near , and for a photon reaching the photosphere. Following Hubeny et al. (2001), we therefore define the ‘effective y-parameter’ as
| (A12) |
The effects of Comptonization decrease the photon energies and bring them closer to LTE near the photosphere, reducing the spectral hardening and lowering . Instead of increasing indefinitely with increasing , will ‘saturate’ when or . Using equation (A5), we can rewrite equation (A12) as
| (A13) |
For and keV, we find , close to the commonly assume value of 1.7 (Shimura & Takahara 1995). Above this value, will increase only weakly because further increase in the typical energies of photons emitted at is offset by reductions due to the effects of Compton scattering. The precise value of obtained will, of course, depend on the details, but the strong dependence in equation (A13) demonstrates why the spectra of effectively optically thick annuli are never consistent with .
We emphasize that the arguments discussed above are only approximate with varying accuracy over the parameter space of interest. They are not a substitute for full atmosphere calculations. Nevertheless, comparison with these calculations (see e.g. Figure 5) demonstrates that they are qualitatively correct and are useful for understanding why the spectral hardening depends so weakly on in most BHBs.
References
- Afshordi & Paczyński (2003) Afshordi, N. & Paczyński, B. 2003, ApJ, 592, 354
- Agol (1997) Agol, E. 1997, Ph.D. thesis, Univ. California, Santa Barbara
- Agol & Krolik (2000) Agol, E., & Krolik, J. H. 2000, ApJ, 528, 161
- Arnaud (1996) Arnaud, K. A. 1996, in ASP Conf. Proc. 101, Astronomical Data Analysis Software and Systems V, ed. G. H. Jacoby & J. Barnes (San Francisco: ASP), 17
- (5) Bardeen, J. M., & Petterson, J. A. 1975, ApJ, 195, L65
- Begelman (2001) Begelman, M. C. 2001, ApJ, 551, 897
- (7) Blaes, O. M., Arras, P., & Fragile, P. C. 2006, MNRAS, submitted (astro-ph/0601379)
- (8) Blaes, O. M., Davis, S. W., Hirose, S., Krolik, J. H., & Stone, J. M. 2006, ApJ, submitted (astro-ph/0601380)
- Cowley et al (1983) Cowley, A. P., Crampton, D., Hutchings, J. B., Remillard, R., & Penfold, J. E. 1983, ApJ, 272, 118
- Cunningham (1975) Cunningham, C. T. 1975, ApJ, 202, 788
- Davis & Hubeny (2006) Davis, S. W., & Hubeny, I. 2006, ApJ, submitted
- Davis et al. (2005) Davis, S. W., Blaes, O. M., Hubeny, I. & Turner, N. J. 2005, ApJ621, 327
- di Benedetto (1997) di Benedetto, G. P. 1997, ApJ, 486, 60
- Dubus et al. (2001) Dubus, G., Hameury, J.-M., & Lasota, J.-P. 2001, A&A, 373, 251
- Ebisawa et al. (1991) Ebisawa, K., Mitsuda, K., Hanawa, T. 1991, ApJ, 367, 213
- Gammie (1999) Gammie, C. F. 1999, ApJ, 522, L57
- Gierliński & Done (2003) Gierliński, M., & Done, C. 2003, MNRAS, 342, 1083
- Gierliński & Done (2004) Gierliński, M., & Done, C. 2004, MNRAS, 347, 885 (GD04)
- Gierliński et al. (2001) Gierliński, M., Maciołek-Niedźwiecki, A., & Ebisawa, K. 2001, MNRAS, 325, 1253
- Haardt et al. (2001) Haardt et al. 2001, ApJS, 133, 187
- Hannikainen et al. (2001) Hannikainen, D., Campbell-Wilson, D., Hunstead, R., McIntyre, V., Lovell, J., Reynolds, J., Tzioumis, T., & Kinwah, W. 2001, Ap&SS, 276, 45
- Hawley & Krolik (2002) Hawley, J. F., & Krolik, J. H. 2002, ApJ, 566, 164
- Hjellming & Rupen (1995) Hjellming, R. M., & Rupen, M. P., 1995, Nature, 375, 464
- Hubeny (1990) Hubeny, I. 1990, ApJ, 351, 632
- Hubeny & Lanz (1995) Hubeny, I., & Lanz, T. 1995, ApJ, 439, 875
- Hubeny et al. (2001) Hubeny, I., Blaes, O., Krolik, J.H., & Agol, E. 2001 ApJ, 559, 680
- King & Kolb (1999) King, A. R., & Kolb, U. 1999, MNRAS, 305, 654
- Krolik (1999) Krolik, J. H. 1999, ApJ, 515, L73
- Krolik & Hawley (2002) Krolik, J. H., & Hawley, J. F. 2002, ApJ, 573, 754
- Kubota et al. (2001) Kubota, A., Makishima, K., & Ebisawa, K. 2001, ApJ, 560, L147
- Kubota & Makishima (2004) Kubota, A. & Makishima, K. 2004, ApJ, 601, 428
- Kuiper et al. (1988) Kuiper, L., van Paradijs, J., & van der Klis, M. 1988, A&A, 203, 79
- Laor (1991) Laor, A. 1991, ApJ, 376, 90
- Lasota (2001) Lasota, J.-P. 2001, NewA Rev., 45, 449
- Li et al. (2005) Li L.-X., Zimmerman E. R., Narayan R., & McClintock J. E. 2005, ApJS, 157, 335L
- Maccarone (2002) Maccarone, T. J. 2002, MNRAS, 336, 1371
- McClintock & Remillard (2004) McClintock, J. E. & Remillard, R. A. 2004, Black Hole Binaries, eds. W. H. G. Lewin and M. van der Klis (Cambridge: Cambridge Univ. Press), in press, astro-ph/0306213
- Merloni (2003) Merloni, A. 2003, MNRAS, 341, 1051
- Merloni et al. (2000) Merloni, A., Fabian, A.C. & Ross, R.R. 2000, MNRAS, 313, 193
- Middleton et al. (2006) Middleton, M., Done, C., Gierlinski, M., & Davis, S. W. 2006, MNRAS, submitted (astro-ph/0601540)
- Miller et al. (2004) Miller, J. M., Fabian, A. C., Nowak, M. A., & Lewin, W. H. G. 2004, preprint, (astro-ph/0402101)
- Mitsuda et al. (1984) Mitsuda, K., et al. 1984, PASJ, 36, 741
- Novikov & Thorne (1973) Novikov, I.D. & Thorne, K.S. 1973, in Black Holes, eds. C. De Witt and B. De Witt (New York: Gordon & Breach) p. 343 (NT73)
- Nowak et al. (2001) Nowak, M. A., Wilms, J., Heindl, W. A., Pottschmidt, K., Dove, J. B., & Begelman, M. C. 2001, MNRAS, 320, 316
- Orosz & Bailyn (1997) Orosz J. A., & Bailyn C. D. 1997, ApJ, 477, 876
- Orosz et al (2002) Orosz J. A. et al. 2002, ApJ, 568, 845
- Page et al. (2003) Page, M. J., Soria, R., Mason, K. O., Cordova, F. A., & Priedhorsky, W. C. 2003, MNRAS, 345, 639
- Piran (1978) Piran, T. 1978, ApJ, 221, 652
- Rezzolla et al. (2003) Rezzolla, L., Yoshida, S’i., Maccarone, T. J., & Zanotti, O., 2003, MNRAS, 344, L37
- Rybicki & Lightman (1979) Rybicki G. B. & Lightman, A. P. 1979, Radiative Processes in Astrophysics, (New York: John Wiley & Sons)
- Sakimoto and Coroniti (1981) Sakimoto, P.J., & Coroniti, F.V. 1981, ApJ, 247, 19
- Shafee et al. (2006) Shafee, R., McClintock, J. E., Narayan, R., Davis, S. W., Li L.-X., & Remillard, R. A. 2006, ApJ, 636 L113
- Shahbaz et al. (1999) Shahbaz, T., van der Hooft, F., Casares, J., Charles, P. A., & van Paradijs, J. 1999, MNRAS, 306, 89
- Shakura & Sunyaev (1973) Shakura, N. I., & Sunyaev, R. A. 1973, A&A, 24, 337 (SS73)
- Shimura & Takahara (1995) Shimura, T., & Takahara, F. 1995, ApJ, 445, 780 (ST95)
- Soria et al. (2001) Soria, R., Wu, K., Page, M. J., Sakelliou, I. 2001 A&A, 365, L273
- Titarchuk (1994) Titarchuk, L. 1994, ApJ, 434, 570
- Török (2005) Török, G., 2005, Astron. Nachr., 326, 856
- Turner et al. (2002) Turner, N. J., Stone, J. M., Sano, T. 2002, ApJ, 566, 148
- Turner et al. (2005) Turner, N. J., Blaes, O. M., Socrates, A., Begelman, M. C. & Davis, S. W. 2005, ApJ, 624, 267
- van der Hooft et al. (1998) van der Hooft, F., Heemskerk, M. H. M., Alberts F., & van Paradijs, J. 1998, A&A, 329, 538
- Wagoner, Silbergleit &Ortega-Rodríguez (2001) Wagoner, R. V., Silbergleit, A. S., & Ortega-Rodríguez, M., 2001, ApJ, 559, L25
- Wu et al. (2001) Wu, K., Soria, R., Page, M. J., Sakelliou, I., Kahn, S. M., & de Vries, C. P. 2001, A&A, 365, 267
- Yao et al. (2005) Yao, Y., Wang, D. Q., & Shuang, N. Z. 2005, MNRAS, 362, 229
- Zhang, Cui, & Chen (1997) Zhang, S. N., Cui, W., & Chen, W. 1997, ApJ, 482, L155
- Zdziarski et al. (1996) Zdziarski, A. A., Johnson, W. N., Magdziarz, P. 1996, MNRAS, 283, 193