Millimeter Interferometric Investigations of the Energy Sources of Three Ultraluminous Infrared Galaxies, UGC 5101, Mrk 273, and IRAS 172080014, based on HCN to HCO+ Ratios
Abstract
We present interferometric observations of three ultraluminous infrared galaxies (ULIRGs; UGC 5101, Mrk 273, and IRAS 172080014) in the 3-mm wavelength range, using the Nobeyama Millimeter Array. Both the HCN (J=1–0) and HCO+ (J=1–0) molecular lines were observed simultaneously. HCN emission was clearly detected at the nuclear positions of these ULIRGs, and HCO+ emission was detected at the nuclear positions of UGC 5101 and IRAS 172080014. The HCN to HCO+ brightness-temperature ratios toward the nuclei of the three ULIRGs were derived and compared with those of lower luminosity galaxies known to be dominated by active galactic nuclei (AGNs) or starbursts. In UGC 5101 and Mrk 273, where there is evidence for obscured AGNs from previous observations at other wavelengths, we found high HCN/HCO+ ratios (1.8) that are in the range found for AGN-dominated galaxies. In IRAS 172080014, where the presence of a powerful obscured AGN has been unclear, the ratio (1.7) is in between the observed values for starburst- and AGN-dominated galaxies. The high HCN/HCO+ brightness-temperature ratios in UGC 5101 and Mrk 273 could be the consequence of an HCN abundance enhancement, which is expected from chemical effects of the central X-ray emitting AGN on the surrounding dense molecular gas. Our proposed millimeter interferometric method based on HCN/HCO+ ratios may be an effective tool for unveiling elusive buried AGNs at the cores of ULIRGs, especially because of the negligible dust extinction at these wavelengths.
Subject headings:
galaxies: active — galaxies: nuclei — galaxies: ISM — radio lines: galaxies — galaxies: individual (UGC 5101, Mrk 273, and IRAS 172080014 (catalog ))1. Introduction
Ultraluminous infrared galaxies (ULIRGs), discovered during the IRAS all-sky survey, radiate the bulk of their very large luminosities () as dust emission in the infrared (Sanders & Mirabel, 1996). Hence, powerful energy sources, such as starbursts or active galactic nuclei (AGNs), must be present hidden behind dust. Since distant ULIRGs dominate the cosmic infrared background emission, the sum of the dust-obscured activity in the universe (Blain et al., 1999), establishing the energy sources of ULIRGs is closely related to understanding the connections between obscured AGNs and starbursts. Distant ULIRGs are too faint to investigate in detail with existing facilities and so the study of nearby ULIRGs continues to be an important means of understanding the distant ULIRG population.
It is now generally accepted that the majority of nearby ULIRGs are energetically dominated by compact (500 pc), highly dust-obscured nuclear cores, rather than by extended (kpc), weakly obscured (AV 15 mag) starburst activity in host galaxies (Soifer et al., 2000). Therefore, a primary goal in the study of nearby ULIRGs is to establish whether the obscured compact cores are very compact starbursts or AGNs. Optical spectroscopy is an often used way to distinguish an AGN from a starburst. In the presence of an AGN obscured by dust in a torus geometry, clouds that are photo-ionized by the radiation from the AGN develop along the torus axis above a torus scale height (the so-called narrow line regions: NLRs) (Antonucci, 1993). The NLRs produce optical emission lines whose flux ratios differ from the clouds in starburst galaxies; galaxies that contain an AGN obscured by torus-shaped dust are classified optically as Seyfert 2s (Veilleux & Osterbrock, 1987). Hence, this type of obscured AGN can be identified by using optical spectroscopy. However, the nuclear regions of ULIRGs contain sufficiently highly concentrated molecular gas and dust that putative AGNs may be obscured by dust in virtually all directions (Sanders & Mirabel, 1996). Such buried AGNs 111 We use the term “obscured AGN” if the AGN is obscured along our line of sight, and “buried AGN” if the AGN is obscured along virtually all sightlines. without significant NLRs are classified optically as “non-Seyferts”, and so very difficult to find (Maiolino et al., 2003); however, they are predicted to be abundant in the universe (Fabian et al., 2002). In fact, the initial evidence of powerful buried AGNs has been detected in several optical non-Seyfert ULIRGs (Dudley & Wynn-Williams, 1997; Soifer et al., 2000; Imanishi & Dudley, 2000; Tran et al., 2001; Imanishi et al., 2001; Imanishi & Maloney, 2003; Imanishi et al., 2003, 2006), so that it is essential to understand the contribution from buried AGNs to the total energy output of the ULIRG population.
One of the most effective ways to distinguish a buried AGN from a very compact starbust as the primary energy source in the core of a ULIRG is to investigate whether there is a strong X-ray-emitting source. A luminous buried AGN should exhibit intrinsically strong X-ray emission at E 2 keV from the vicinity of the accretion disk around the central supermassive black hole (Elvis et al., 1994), whereas in a starburst, the intrinsic X-ray emission above keV, relative to bolometric luminosity, is significantly weaker (Ranalli et al., 2003). Therefore, the detection of intrinsically strong, but highly absorbed, X-ray emission can provide strong evidence for a powerful buried AGN. Although moderately X-ray absorbed, Compton thin (NH 1024 cm-2) AGNs are easy to find with currently available X-ray data at E = 2–10 keV (Franceschini et al., 2003; Ptak et al., 2003; Imanishi & Terashima, 2004), it is very difficult to unveil and quantify the luminosities of Compton thick (NH 1024 cm-2) buried AGNs using such data. Given that most of the AGNs detected so far in optical Seyfert-2 ULIRGs (Franceschini et al., 2000; Iwasawa et al., 2001; Braito et al., 2003; Iwasawa et al., 2005) and non-Seyfert galaxies with LIR 1012L⊙ (Done et al., 1996; Vignati et al., 1999; Della Ceca et al., 2002) suffer from Compton-thick absorption, it is very likely that the majority of the putative buried AGNs in optical non-Seyfert ULIRGs are also Compton thick. High-sensitivity observations at E 10 keV using a next-generation X-ray satellite are required to properly evaluate the energetic importance of buried AGNs in a large ULIRG sample.
Another approach to investigating whether a ULIRG core has an intrinsically strong X-ray emitting source is to search for signatures of the effects of the luminous X-ray source on the surrounding interstellar medium. Around a buried AGN, X-ray dissociation regions (XDRs; Maloney et al. 1996) should develop, rather than the photo-dissociation regions (PDRs) usually found in starburst regions. XDRs and PDRs can be distinguished if they show different flux ratios of emission lines. In particular, emission lines in the far-infrared to millimeter wavelength range are potentially a powerful tool, because low dust extinction at these wavelengths makes it possible to uncover the signatures of XDRs around powerful buried AGNs that are usually deeply embedded in dust. Kohno et al. (2001, 2003) and Kohno (2005) proposed that the HCN (J=1–0) (=3.38 mm), HCO+ (J=1–0) (=3.36 mm), and CO(J=1–0) (=2.60 mm) lines are useful for this purpose, and argued that AGN-dominated galaxies (XDRs) show systematically larger HCN/HCO+ and HCN/CO ratios in brightness temperature than starburst-dominated galaxies (PDRs). Imanishi et al. (2004) pointed out that the HCN/HCO+ ratio is particularly effective for investigating the nature of heavily obscured ULIRG cores for the following reasons: (1) since both molecular lines probe high-density molecular gas ( 104 cm-3), their relative ratios are not strongly contaminated by more extended lower density gas, whose relative fraction can vary among different galaxies, and (2) the wavelengths of the two lines are sufficiently close that they are observable simultaneously with wide-band receiving systems, reducing the net observing time and systematic errors. Since HCN and HCO+ are both moderately strong lines, this method is applicable to a larger number of galaxies than that proposed by Usero et al. (2004), which uses various faint molecular lines for the purpose of distinguishing between XDRs and PDRs.
Interferometric maps are preferable to single-dish large-aperture observations for investigating the cores of ULIRGs in the millimeter wavelength range, because they reduce the contamination from extended star-formation emission in the host galaxy. We applied this millimeter interferometric method to the infrared luminous galaxy NGC 4418 (LIR 1011L⊙), which likely contains a powerful buried AGN (Dudley & Wynn-Williams, 1997; Spoon et al., 2001), and were successful in finding signatures of a buried AGN from the HCN/HCO+ ratio (Imanishi et al., 2004), demonstrating the potential of this method. In this paper, we report the application of this interferometric HCN/HCO+ method to three ULIRGs: UGC 5101, Mrk 273, and IRAS 172080014. Throughout this paper, we adopt 75 km s-1 Mpc-1, = 0.3, and = 0.7.
2. Targets
The target ULIRGs were selected based on the following criteria: 1) Strong HCN emission is detected with single-dish radio telescopes, so that the study of HCN and HCO+ emission-line ratios at the nuclei is feasible with the Nobeyama Millimeter Array (NMA), our observing facility. (2) They are nearby ( 0.06), so that redshifted HCN and HCO+ emission lines are observable with the NMA receiving systems. The three ULIRGs UGC 5101, Mrk 273, and IRAS 172080014 were selected as the first targets. Table 1 summarizes the detailed information about these sources. An angular scale of 1′′ corresponds to a physical size of 0.7–0.8 kpc for the three ULIRGs.
UGC 5101 (z = 0.040) is included in the original ULIRG sample (Sanders et al., 1988a) and is a well-studied ULIRG. It is classified optically as a LINER (Veilleux et al., 1995) or as a Seyfert 2 in a slightly different classification scheme by a different group (Goncalves et al., 1999). Imanishi et al. (2001) and Imanishi & Maloney (2003) performed infrared 3–4 m spectroscopy and detected polycyclic aromatic hydrocarbon (PAH) emission at 3.3 m, a starburst indicator, as well as signatures of a powerful AGN deeply buried at the core. They inferred that the infrared luminosity of UGC 5101 is dominated by the buried AGN, rather than the detected starburst activity. Radio VLBI observations (Smith et al., 1998; Lonsdale et al., 2003) and a near-infrared high-spatial-resolution image (Scoville et al., 2000) showed compact, high surface-brightness emission, which was interpreted as an AGN by these authors. Similar compact emission was detected in the infrared at 12.5 m (Soifer et al., 2000). The presence of a powerful obscured AGN was confirmed by subsequent 2–10 keV X-ray observations (Imanishi et al., 2003). Armus et al. (2004) detected weak high-excitation forbidden emission lines originating in the NLRs in a mid-infrared 5–40 m high-resolution spectrum. Judging from the detection of NLR-originating emission lines in the optical (Goncalves et al., 1999) and mid-infrared (Armus et al., 2004), there may be a small angular range that is transparent to the AGNs’ ionizing photons (mostly UV and soft X-rays). HCN (J=1–0) data based on a single-dish telescope are available (Gao & Solomon, 2004) and indicate that if a significant fraction of the detected HCN emission comes from the nucleus of UGC 5101, then an investigation of the HCN/HCO+ ratio at the core should be feasible using the NMA with a reasonable integration time.
Mrk 273 (z = 0.038) is also a well-studied ULIRG (Sanders et al., 1988a). It is classified optically as a Seyfert 2 (Veilleux et al., 1999). Its Seyfert-2 classification and the detection of strong NLR-originating high-excitation forbidden emission lines in the mid-infrared 5–11 m spectrum (Genzel et al., 1998) suggest that the dust distribution around the putative AGN is torus-shaped and that a significant amount of ionizing radiation is escaping the AGN. 2–10 keV X-ray data have revealed the presence of a moderately absorbed Compton-thin AGN (Iwasawa, 1999; Xia et al., 2002; Balestra et al., 2005). The presence of an obscured AGN in Mrk 273 is also suggested from (1) a smaller equivalent width of 3.3 m PAH emission than the typical value for starburst galaxies (Imanishi & Dudley, 2000), (2) deep 9.7 m silicate dust absorption and weak PAH emission features in the 8–13 m spectrum (Dudley, 1999; Soifer et al., 2002), and (3) compact high surface brightness mid-infrared emission at 12.5 m (Soifer et al., 2000). The HCN flux from Mrk 273 observed with a single-dish telescope is as strong as that from UGC 5101 (Gao & Solomon, 2004), so that investigations of nuclear HCN and HCO+ emission are also feasible for Mrk 273.
IRAS 172080014 (z = 0.042) is classified optically as an HII-region (Veilleux et al., 1995). Unlike other ULIRGs, the mid-infrared 8–23 m emission of IRAS 172080014 is spatially extended, with no prominent core (Soifer et al., 2000). Its radio emission as detected with the VLA is relatively compact (Martin et al., 1989; Condon et al., 1996), but its surface brightness is not high enough to indicate strongly the presence of an AGN (Diamond et al., 1999). Its 8–13 m spectrum is typical of starburst galaxies, with prominent PAH emission features (Dudley, 1999) Its 3–4 m spectrum also displays a clear 3.3 m PAH emission feature, but the detection of a moderately strong 3.1 m ice absorption feature suggests an energy source more centrally-concentrated than the surrounding dust, such as a buried AGN (Risaliti et al., 2006; Imanishi, 2006). However, in IRAS 172080014, the AGN signature is much weaker than UGC 5101 and Mrk 273. The detected HCN flux using a single-dish telescope is the largest among the three ULIRGs (Gao & Solomon, 2004).
3. Observations and Data Reduction
Interferometric observations of HCN (J=1–0) ( = 3.3848 mm or = 88.632 GHz) and HCO+ (J=1–0) ( = 3.3637 mm or = 89.188 GHz) were performed with the NMA and RAINBOW Interferometer at Nobeyama Radio Observatory (NRO) between December 2004 and March 2005. Table 2 summarizes the detailed observing log. The NMA consists of six 10-m antennas, and observations were performed using the D (the longest baseline was 82 m), C (163 m), and AB (351 m) configurations. The RAINBOW interferometer is a seven-element combined array that includes six 10-m antennas (NMA) and the NRO 45-m telescope. The RAINBOW observations were performed when the NMA array was in the AB configuration, and the longest baseline was 410 m. The sensitivity of RAINBOW is about twice that of the NMA array in the 3-mm wavelength range, because the inclusion of the NRO 45-m telescope increases the total aperture size by a factor of four.
The backend was the Ultra-Wide-Band Correlator (UWBC) (Okumura et al., 2000), which was configured to cover 1024 MHz with 128 channels at 8-MHz resolution. The central frequency was set to 85.49, 85.67, and 85.24 GHz for UGC 5101, Mrk 273, and IRAS 172080014, respectively, so that both the redshifted HCN and HCO+ lines were observable simultaneously. A bandwidth of 1024 MHz corresponds to 3500 km s-1 at 86 GHz. The field of view at this frequency is 26′′ (full width at half maximum; FWHM) and 77′′ (FWHM) for RAINBOW and NMA, respectively. Since the Hanning window function was applied to reduce side lobes in the spectra, the effective resolution was widened to 16 MHz or 55 km s-1 at 86 GHz. To calibrate the passband across the 128 channels, the bright quasars 3C 84 (UGC 5101), 0355+508 (Mrk 273), and 3C 454.3 and 3C279 (IRAS 172080014) were observed every observing day. Quasars 0954+658, 1418+546, and 1741038 were used to calibrate temporal variation in the visibility amplitude and phase for UGC 5101, Mrk 273, and IRAS 172080014, respectively.
The UVPROC-II package developed at NRO (Tsutsumi et al., 1997) and the AIPS package of the National Radio Astronomy Observatory were used for standard data reduction. Corrections for the antenna baselines, bandpass properties, and the time variation of the visibility amplitude and phase were applied to all of the data. A fraction of the data with large phase scatter due to bad radio seeing was removed from our analysis. After clipping a small fraction of data of unusually high amplitude, the data were Fourier-transformed using a natural UV weighting. The flux calibration was made using the observations of the appropriate quasars, 1749+096 (UGC 5101), 1741038 and 0355+508 (Mrk 273), or 1741038 (IRAS 172080014), whose flux levels relative to Uranus or Neptune had been measured at least every month between December 2004 and March 2005. A conventional CLEAN method was applied to deconvolve the synthesized beam pattern. The total net on-source integration times were 29 hours (UGC 5101), 8 hours (Mrk 273), and 18 hours (IRAS 172080014). The synthesized beam sizes are 58 45 (position angle is 45∘ west of north; PA = 45∘) for UGC 5101, 19 15 (PA = 66∘) for Mrk 273, and 31 24 (PA = 1∘) for IRAS 172080014. Absolute positional uncertainties of NMA/RAINBOW maps were estimated to be much less than 1 arcsec.
4. Results
HCN (J=1–0) or HCO+ (J=1–0) data are available for several ULIRGs (Solomon et al., 1992; Curran et al., 2000; Gao & Solomon, 2004), but observations have generally been performed with single-dish telescopes. Radford et al. (1991) showed an interferometric HCN map of the ultraluminous infrared galaxy Arp 220. With this exception, no detailed morphological information for HCN emission exists for ULIRGs. Therefore, this work allows us to reveal for the first time the spatial distribution of HCN (J=1–0) in the ULIRG population other than Arp 220. Ours are also the first published interferometric maps of ULIRGs for HCO+ (J=1–0) emission.
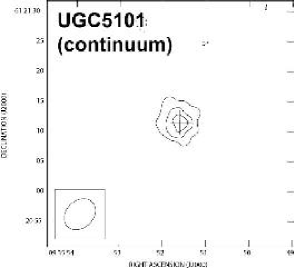
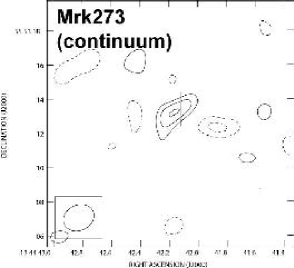
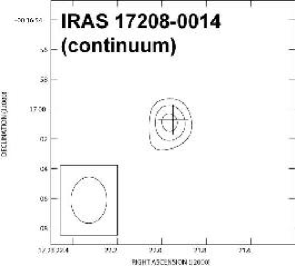
Figure 1 shows the contours of the continuum emission from UGC 5101, Mrk 273, and IRAS 172080014. Signals away from the HCN and HCO+ emission lines were combined to produce the continuum maps. Strong continuum emission is found in all ULIRGs and the continuum peaks are spatially coincident with the nuclear positions of these ULIRGs. Table 3 summarizes the estimated continuum flux levels. The detection significance is (UGC 5101), (Mrk 273), and (IRAS 172080014). The spatial extents of the continuum emission agree with the beam sizes within 50%.
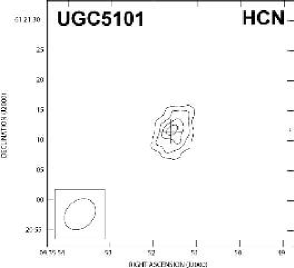
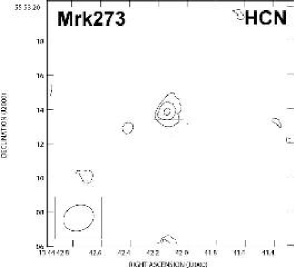
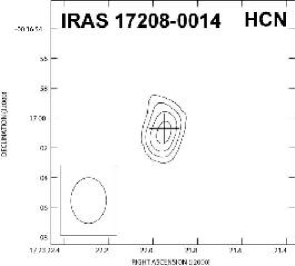
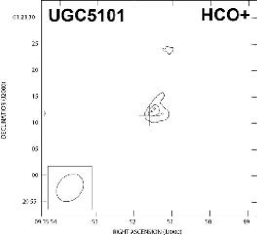
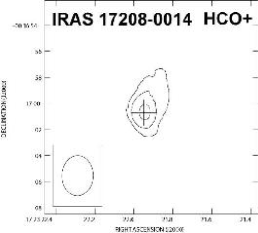
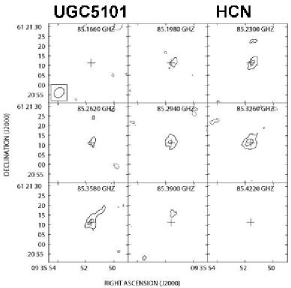
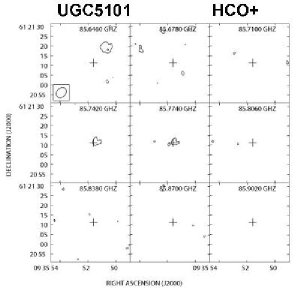
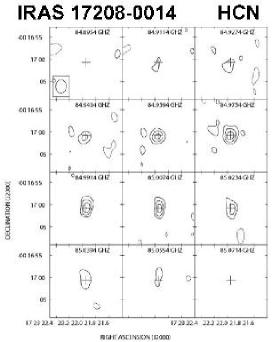
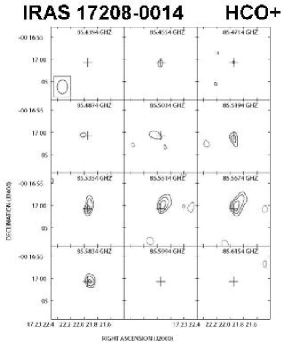
After the continuum emission was subtracted, we investigated the spatial distribution of the HCN and HCO+ emission. Figure 2 shows the integrated intensity maps of the HCN emission for UGC 5101, Mrk 273, and IRAS 172080014. Figure 3 displays the HCO+ integrated intensity maps for UGC 5101 and IRAS 172080014. HCO+ emission is not clearly detected from the nucleus of Mrk 273 in our interferometric map (). With this exception, the HCN and HCO+ emission lines are clearly () detected. The detected emission lines are coincident with the nuclear positions of the ULIRGs and has spatial extents consistent with the beam sizes within 50%. For UGC 5101 and IRAS 172080014, the signal-to-noise ratios around the HCN and HCO+ lines are good enough to present channel maps, which are shown in Figures 4 and 5, respectively.
Figure 6 shows continuum-subtracted nuclear spectra around the HCN and HCO+ emission lines. The presence of HCO+ emission from Mrk 273 is unclear, but HCN emission from all the ULIRGs, and HCO+ emission from UGC 5101 and IRAS 172080014 are clearly recognizable. Figure 7 presents the Gaussian fits to these detected emission lines. The central velocity and line width of the Gaussian were determined independently for the HCN and HCO+ lines. The HCN emission from UGC 5101 suggests the presence of double peaks, which may be related to the nuclear rotating molecular disk probed by the CO (J=1–0) line (Genzel et al., 1998). Therefore, a double Gaussian fit was also attempted for the HCN line of UGC 5101. For the HCN and HCO+ lines from IRAS 172080014, we added a constant continuum to subtly adjust the residual continuum level in the vicinity of the HCN and HCO+ lines. Table 4 summarizes the Gaussian fitting results.
The local standard of rest (LSR) peak velocities of HCN emission from Mrk 273 (11310 km s-1) and IRAS 172080014 (12860 km s-1) agree, within 25 km s-1, with those of CO peak velocities (11324 km s-1 for Mrk 273 and 12837 km s-1 for IRAS 172080014; Downes & Solomon 1998). HCN and CO (Downes & Solomon, 1998) line profiles are also similar for the nuclei of Mrk 273 and IRAS 172080014. For the double Gaussian fit of HCN emission from UGC 5101, the velocity difference of the two components is 400 km -1, which is roughly comparable to that of CO (480 km s-1; Genzel et al. 1998).
The integrated fluxes of HCN and HCO+ at the peak position, estimated from the Gaussian fits, are summarized in Table 5. For the HCN emission from UGC 5101, the single and double Gaussian fits give fluxes that are consistent to within 5%. Therefore, we adopt the values based on single Gaussian fits for all sources. The derived HCN fluxes correspond to 60% (UGC 5101), 30% 222 This value seems low, but we have no clear answer. The flux difference between the single-dish and interferometric observations may be due to discrepancies in the absolute flux scale between the two observations, or the presence of extended HCN emission unrecovered by our interferometric observations (less likely), or possibly a substantial overestimate of the HCN flux by Gao & Solomon (2004), coming from relatively large scatters in their single-dish data (their Figure 2). (Mrk 273), and 55% (IRAS 172080014) of the HCN flux measurements from single-dish radio telescopes (Gao & Solomon, 2004).
The HCN/HCO+ ratios in brightness temperature ( flux density) are also summarized in Table 5. For the purpose of detecting the effects of putative AGNs on the surrounding interstellar medium at ULIRG cores, we regard our HCN/HCO+ ratios as a more appropriate tool than the ratios previously derived from single-dish telescope observations (Nguyen-Q-Rieu et al., 1992; Solomon et al., 1992), because (1) we can reduce the contamination from the extended flux of the host galaxy, and (2) in our NMA data, the HCN and HCO+ lines were observed simultaneously with the same receiver and same correlator unit, so that possible systematic errors should be minimal. Although the absolute flux calibration uncertainty of the NMA and RAINBOW data might be as large as 20%, this uncertainty does not affect the HCN/HCO+ ratios. The uncertainty in the ratios is dominated by statistical noise and fitting errors (see Figure 7).
5. Discussion
5.1. Comparison of HCN/HCO+ Ratios with Other Galaxies
Figure 8 shows the HCN/HCO+ and HCN/CO ratios in brightness temperature for UGC 5101, Mrk 273, and IRAS 172080014, together with previously obtained data for nearby starburst and Seyfert galaxies (Kohno et al., 2001; Kohno, 2005), and the AGN-powered infrared luminous galaxy NGC 4418 (Imanishi et al., 2004). The ratios for the three main nuclei of the infrared luminous merging galaxy Arp 299 (Imanishi et al. 2006, in preparation) are also plotted. Kohno et al. (2001) and Kohno (2005) found empirically that AGN-dominated galaxies tend to have higher HCN/HCO+ and HCN/CO ratios than starburst-dominated galaxies: AGN-dominated galaxies should be distributed on the upper right-hand side, whereas starburst-dominated galaxies should occupy the lower left region in Figure 8.
The HCN/CO ratio in brightness temperature (abscissa) may increase if the HCN abundance relative to CO is enhanced by X-ray radiation from an AGN (Lepp & Dalgarno, 1996). However, another possible explanation for the enhanced HCN/CO brightness-temperature ratio is an increase in molecular gas density. Since the dipole moment of HCN ( 3 debye; Millar et al. 1997) is much larger than that of CO ( 0.1 debye; Millar et al. 1997), HCN emission traces a much higher density molecular gas ( 104 cm-3) than is traced by CO ( 102-3 cm-3). The HCN/CO brightness-temperature ratio can increase if a galaxy contains a larger fraction of high-density molecular gas (e.g., Solomon et al. 1992; Helfer & Blitz 1993; Kohno et al. 1999; Curran et al. 2000). In fact, ULIRGs are expected to have a larger fraction of high-density molecular gas than less infrared-luminous galaxies do (Sanders & Mirabel, 1996), so that HCN/CO brightness-temperature ratios can be high in ULIRGs, even without the HCN abundance enhancement caused by powerful AGNs. Furthermore, the HCN and CO data were taken on different observing runs, with different beam sizes, under different weather conditions, all of which could introduce additional systematic uncertainties. Therefore, the interpretation of HCN/CO brightness-temperature ratios in ULIRGs is not simple.
Such uncertainties are much reduced if we use the HCN/HCO+ ratios. Both HCN and HCO+ ( 4 debye; Botschwina et al. 1993) probe high-density molecular gas ( 104 cm-3), so that the HCN/HCO+ brightness-temperature ratio is insensitive to the different fraction of dense molecular gas, relative to diffuse one, in individual galaxies. Furthermore, since both the HCN and HCO+ emission lines were observed simultaneously with NMA/RAINBOW for all the sources plotted in Figure 8, systematic errors are not a serious concern. For this reason, we use the HCN/HCO+ ratios (ordinate) in our discussion of the possible presence of powerful AGNs.
Our new millimeter interferometric data for UGC 5101 and Mrk 273 reveal that the HCN/HCO+ brightness-temperature ratios are high and in the range expected for AGN-dominated galaxies (HCN/HCO+ 2; Kohno 2005). This is consistent with the fact that previous data have found the signatures of powerful AGNs in UGC 5101 and Mrk 273 (2).
The interpretation of our data for IRAS 172080014 is rather unclear. No strong evidence for a luminous buried AGN in IRAS 172080014 has been found at other wavelengths (2). The HCN/HCO+ brightness-temperature ratio for IRAS 172080014 (1.7) is located in between the expected values for AGN- and starburst-dominated galaxies. A powerful AGN possibly hidden in IRAS 172080014 may slightly increase the HCN/HCO+ ratio, but the presence of an AGN is not clear from our data.
5.2. Interpretations of HCN/HCO+ Ratios
In ULIRGs, the profiles of HCN (J=1–0) and CO (J=1–0) lines are generally similar (Solomon et al. 1992; Gao & Solomon 2004; This paper), despite the difference of their optical depths. The similar line profiles are naturally explained by the widely accepted mist model (Solomon et al., 1987), where a molecular gas cloud consists of a large number of small clumps, with a filling factor of 1 at any fixed velocity. In this model, even if each clump is optically thick for a molecular line, we can probe clumps at the background side of the molecular gas cloud.
If each clump is optically thin for a molecular line, its flux will increase linearly with increasing abundance. However, each clump is thought to be optically thick for CO (J=1–0) lines (Solomon et al., 1987; Scoville & Sanders, 1987). It is not clear whether each clump is optically thick or thin for HCN (J=1–0) and HCO+ (J=1–0) lines, but we can roughly estimate their optical depths (), based on the formula of
| (1) |
where A is the Einstein coefficient and is proportional to , where is the value of dipole moment (Scoville & Sanders, 1987). If we adopt the HCN and HCO+ abundance, relative to CO, are 10-4 510-3 (Blake et al., 1987), the optical depths of both HCN (J=1–0) and HCO+ (J=1–0) lines are 0.2–2 times as large as that of CO (J=1–0) line. Thus, this simple estimate suggests that each clump can be optically thick for HCN (J=1–0) and HCO+ (J=1–0) lines. Nguyen-Q-Rieu (1992) also showed that each clump can have optical depth slightly larger than unity for HCN (J=1–0) line, if the volume filling factor of the clump is as small as f 0.1 (Solomon et al., 1987; Koda et al., 2005).
For an optically thick case, although the relation between flux and abundance is not so simple, their positive correlation is still expected for the following main reason. Assuming that each clump has a decreasing radial density profile ( r-1.5; Gierence et al. 1992), line emission comes mainly from the layer where an optical depth reaches unity (Gierens et al., 1992). When a molecular abundance increases (decreases), the = 1 layer for that molecular line moves outward (inward). Consequently, the surface area of the layer, or its area filling factor, becomes larger (smaller), increasing (decreasing) the flux of that molecular line. Unless the optical depth is extremely large, this effect can be significant and flux will increase with increasing abundance, if not completely linearly, as was demonstrated for the optically thick CO (J=1–0) line (Verter & Hodge, 1995; Wilson, 1995; Sakamoto, 1996; Arimoto et al., 1996). Hence, qualitatively, the high HCN/HCO+ ratio in the brightness temperature can be explained by an enhanced HCN/HCO+ abundance ratio in dense molecular gas from which the bulk of the observed HCN and HCO+ fluxes originate.
Theoretical models allow the calculation of the abundance of molecules, including HCN and HCO+, as a function of distance from a central UV illuminating source or X-ray emitting AGN deeply buried in molecular gas and dust (Lepp & Dalgarno, 1996; Meijerink & Spaans, 2005). Lepp & Dalgarno (1996) found that the abundance of HCN can be enhanced relative to HCO+ if a strong X-ray source is present inside molecular gas. Meijerink & Spaans (2005) calculated the effects of a central X-ray-illuminating AGN on the surrounding molecular gas. They found that the HCN/HCO+ abundance ratio in uniformly-distributed dense molecular gas (105.5 cm-3), as probed by HCN and HCO+, around a luminous X-ray-emitting source can be substantially higher than the ratio in dense molecular gas illuminated only by a central UV source (their Fig.10, model 4). Thus, we have some theoretical basis for the enhanced HCN abundance, relative to HCO+, in the presence of an X-ray-emitting AGN.
However, further sophisticated model calculations are definitely required to quantitatively interpret our observational results. Models available to date (Lepp & Dalgarno, 1996; Meijerink & Spaans, 2005) have only calculated the HCN/HCO+ abundance ratio and showed that the abundance ratio is a function of distance from the central illuminating source. To convert from the HCN/HCO+ abundance ratio to brightness-temperature ratio, we have to know the region from where the bulk of the observed HCN and HCO+ fluxes come, which has not been explicitly mentioned in any available model calculations. Furthermore, the models assume uniform dust/gas distribution for simplicity. If the distribution is clumpy, which is more realistic (Solomon et al., 1987), the abundance ratio can change substantially.
In order for our millimeter interferometric HCN/HCO+ method to help to detect buried AGN signatures, high-density molecular gas must be concentrated near the core region where putative AGNs reside and can affect the gas. If high-density molecular gas is distributed in between double nuclei, for example as in NGC 6240 (Nakanishi et al., 2005), then our method may no longer work. Furthermore, shocks may enhance HCO+ emission (Rawlings et al., 2000, 2004). If shocks driven by outflows or superwind from starbursts coexist with powerful buried AGNs, and if there is a large amount of high-density molecular gas that is affected by the shocks, then the HCN/HCO+ brightness-temperature ratio may decrease compared to that of a pure buried AGN. Thus, some fraction of the galaxies containing powerful AGNs can show low HCN/HCO+ ratios and may be missed when searching based on the HCN/HCO+ ratio.
Despite these remained ambiguities, this millimeter interferometric method can empirically be an effective means of revealing the presence of deeply buried AGNs at ULIRG cores, because of the negligible dust extinction in this wavelength range. If this method is established from a larger number of sources, future observations with high spatial resolution and high sensitivity using ALMA are potentially a powerful probe for optically and even 2–10 keV X-ray-elusive buried AGNs in ULIRG cores.
6. Summary
We performed millimeter interferometric observations of the HCN (J=1–0) and HCO+ (J=1–0) lines of the three ultraluminous infrared galaxies, UGC 5101, Mrk 273, and IRAS 172080014, using NMA/RAINBOW. These are the first interferometric maps of a ULIRG sample for which the HCN (J = 1–0) and HCO+ (J = 1–0) molecular lines were observed simultaneously. We extracted the HCN to HCO+ brightness-temperature ratios at the cores of these ULIRGs, and compared the ratios with those previously estimated for less-luminous, AGN-dominated and starburst-dominated galaxies. We then looked for possible signatures of the influence of AGNs, strong X-ray emitters, on the surrounding interstellar medium at the nuclei. We found that:
-
1.
Continuum and HCN emission were clearly detected in all ULIRGs. HCO+ emission was found in UGC 5101 and IRAS 172080014. The spatial distribution of the emission, when detected, is coincident with the nuclear positions of these ULIRGs.
-
2.
UGC 5101 and Mrk 273 showed high HCN/HCO+ ratios in brightness temperature, as found in AGN-dominated galaxies. Previous observations had suggested luminous obscured AGNs in UGC 5101 and Mrk 273, and so our millimeter interferometric data may be revealing the signatures of the effects of a luminous X-ray-emitting AGN on the surrounding interstellar medium at the nucleus.
-
3.
The HCN/HCO+ ratio for IRAS 172080014 was in between the regions occupied by AGN- and starburst-dominated galaxies. There was no clear evidence for a hidden AGN in IRAS 172080014 based on previously obtained data at other wavelengths. The presence of a luminous buried AGN in IRAS 172080014 remains uncertain based on currently available millimeter interferometric data.
-
4.
Although the sample size is still small, this millimeter interferometric HCN/HCO+ method succeeded in confirming AGN signatures in the two ULIRGs (UGC 5101 and Mrk 273) that were previously known to possess luminous obscured AGNs. Since dust extinction is negligible at this wavelength range, we argue that our method is potentially an important tool for unveiling powerful, but deeply buried, AGNs in optical “non-Seyfert” ULIRGs in the ALMA era.
References
- Antonucci (1993) Antonucci, R. 1993, ARA&A, 31, 473
- Arimoto et al. (1996) Arimoto, N., Sofue, Y., & Tsujimoto, T. 1996, PASJ, 48, 275
- Armus et al. (2004) Armus, L., et al. 2004, ApJS, 154, 178
- Balestra et al. (2005) Balestra, I., Boller, Th., Gallo, L., Lutz, D., & Hess, S. 2005, A&A, 442, 469
- Blain et al. (1999) Blain, A. W., Smail, I., Ivison, R. J., & Kneib, J. -P. 1999, MNRAS, 302, 632
- Blake et al. (1987) Blake, G. A., Sutton, E. C., Masson, C. R., & Phillips, T. G. 1987, ApJ, 315, 621
- Botschwina et al. (1993) Botschwina,P., Horn, M., Flugge, J., Seeger, S. 1993, J. Chem. Soc. Faraday Trans., 89, 2219
- Braito et al. (2003) Braito, V. et al. 2003, A&A, 398, 107
- Condon et al. (1996) Condon, J. J., Helou, G., Sanders, D. B., & Soifer, B. T. 1996, ApJS, 103, 81
- Condon et al. (1991) Condon, J. J., Huang, Z. -P., Yin, Q. F., & Thuan, T. X. 1991, ApJ, 378, 65
- Curran et al. (2000) Curran, S. J., Aalto, S., & Booth, R. S. 2000, A&AS, 141, 193
- Dale et al. (2005) Dale, D. A., Sheth, K., Helou, G., Regan, M. W., & Huttemeister, S. 2005, AJ, 129, 2197
- Della Ceca et al. (2002) Della Ceca, R. et al. 2002, ApJ, 581, L9
- Diamond et al. (1999) Diamond, P. J., Lonsdale, C. J., Lonsdale, C. J., & Smith, H. E. 1999, ApJ, 511, 178
- Done et al. (1996) Done, C., Madejski, G. M., & Smith, D. A. 1996, ApJ, 463, L63
- Downes & Solomon (1998) Downes, D., & Solomon, P. M. 1998, ApJ, 507, 615
- Dudley (1999) Dudley, C. C. 1999, MNRAS, 307, 553
- Dudley & Wynn-Williams (1997) Dudley, C. C., & Wynn-Williams, C. G. 1997, ApJ, 488, 720
- Elvis et al. (1994) Elvis, M., et al. 1994, ApJS, 95, 1
- Fabian et al. (2002) Fabian, A. C., Wilman, R. J., & Crawford, C. S., 2002, MNRAS, 329, L18
- Franceschini et al. (2000) Franceschini, A., Bassani, L., Cappi, M., Granato, G. L., Malaguti, G., Palazzi, & Persic, M. 2000, A&A, 353, 910
- Franceschini et al. (2003) Franceschini, A. et al. 2003, MNRAS, 343, 1181
- Gao & Solomon (2004) Gao, Y., & Solomon, P. M. 2004, ApJS, 152, 63
- Genzel et al. (1998) Genzel, R. et al. 1998, ApJ, 498, 579
- Gierens et al. (1992) Gierens, K. M., Stutzki, J., & Winnewisser, G. 1992, A&A, 259, 271
- Goncalves et al. (1999) Goncalves, A. C., Veron-Cetty, M. -P., & Veron, P. 1999, A&AS, 135, 437
- Helfer & Blitz (1993) Helfer, T. T., & Blitz, L. 1993, ApJ, 419, 86
- Imanishi (2006) Imanishi, M. 2006, AJ, 131, in press (astro-ph/0602143)
- Imanishi & Dudley (2000) Imanishi, M., & Dudley, C. C. 2000, ApJ, 545, 701
- Imanishi & Maloney (2003) Imanishi, M., & Maloney, P. R. 2003, ApJ, 588, 165
- Imanishi & Terashima (2004) Imanishi, M., & Terashima, Y., 2004, AJ, 127, 758
- Imanishi et al. (2001) Imanishi, M., Dudley, C. C., & Maloney, P. R. 2001, ApJ, 558, L93
- Imanishi et al. (2006) Imanishi, M., Dudley, C. C., & Maloney, P. R. 2006, ApJ, 637, 114
- Imanishi et al. (2004) Imanishi, M., Nakanishi, K., Kuno, N., & Kohno, K. 2004, AJ, 128, 2037
- Imanishi et al. (2003) Imanishi, M., Terashima, Y., Anabuki, N., & Nakagawa, T. 2003, ApJ, 596, L167
- Iwasawa (1999) Iwasawa, K. 1999, MNRAS, 302, 96
- Iwasawa et al. (2001) Iwasawa, K., Fabian, A. C., & Ettori, S. 2001, MNRAS, 321, L15
- Iwasawa et al. (2005) Iwasawa, K., Crawford, C. S., Fabian, A. C., & Wilman, R. J. 2005, MNRAS, 362, L20
- Koda et al. (2005) Koda, J., Okuda, T., Nakanishi, K., Kohno, K., Ishizuki, S., Kuno, N., & Okumura, S. 2005, A&A, 431, 887
- Kohno (2005) Kohno, K. 2005, in AIP Conf. Ser. 783, The Evolution of Starbursts, ed. S. Hüttemeister, E. Manthey, D. Bomans, & K. Weis (New York: AIP), 203 (astro-ph/0508420)
- Kohno et al. (2001) Kohno, K., Matsushita, S., Vila-Vilaro, B., Okumura, S. K., Shibatsuka, T., Okiura, M., Ishizuki, S., Kawabe, R. 2001, in ASP Conf. Ser. 249, The Central kpc of Starbursts and AGN, ed. J. H. Knapen, J. E., Beckman, I. Shlosman, & T. J. Mahoney (San Francisco: ASP), 672 (astro-ph/0206398)
- Kohno et al. (2003) Kohno, K., Ishizuki, S., Matsushita, S., Vila-Vilaro, B., & Kawabe, R., 2003, PASJ, 55, L1
- Kohno et al. (1999) Kohno, K., Kawabe, R., & Vila-Vilaro. B. 1999, ApJ, 511, 157
- Lepp & Dalgarno (1996) Lepp, S., & Dalgarno, A. 1996, A&A, 306, L21
- Lonsdale et al. (2003) Lonsdale, C. J., Lonsdale, C. J., Smith, H. E., & Diamond, P. J. 2003, ApJ, 592, 804
- Maiolino et al. (2003) Maiolino, R. et al. 2003, MNRAS, 344, L59
- Maloney et al. (1996) Maloney, P., Hollenbach, D., & Tielens, A. G. G. M. 1996, ApJ, 466, 561
- Martin et al. (1989) Martin, J. M., Bottinelli, L., Dennefeld, M., Gouguenheim, L., & Le Squeren A. M. 1989, A&A, 208, 39
- Meijerink & Spaans (2005) Meijerink, R., & Spaans, M. 2005, A&A, 436, 397
- Millar et al. (1997) Millar, T. J., Farquhar, P. R. A., & Willacy, K. 1997, A&AS, 121, 139
- Nakanishi et al. (2005) Nakanishi, K., Okumura, S., Kohno, K., Kawabe, R., & Nakagawa, T. 2005, PASJ, 57, 575
- Nguyen-Q-Rieu et al. (1992) Nguyen-Q-Rieu, Jackson, J. M., Henkel, C., Truong-Bach, & Mauersberger, R. 1992, ApJ, 399, 521
- Okumura et al. (2000) Okumura, S. et al. 2000, PASJ, 52, 393
- Ptak et al. (2003) Ptak, A., Heckman, T., Strickland, D., Levenson, N. A., & Weaver, K. 2003, ApJ, 592, 782
- Radford et al. (1991) Radford, S. J. E., et al. 1991, in IAU Symp. 146, Dynamics of Galaxies and Their Molecular Cloud Distributions, ed. F. Combes & F. Casoli (Dordrecht: Kluwer), 303
- Ranalli et al. (2003) Ranalli, P., Comastri, A., & Setti, G. 2003, A&A, 399, 39
- Rawlings et al. (2004) Rawlings, J. M. C., Redman, M. P., Keto, E., & Williams, D. A. 2004, MNRAS, 351, 1054
- Rawlings et al. (2000) Rawlings, J. M. C., Taylor, S. D., & Williams, D. A. 2000, MNRAS, 313, 461
- Risaliti et al. (2006) Risaliti, G., et al. 2006, MNRAS, 365, 303
- Sakamoto (1996) Sakamoto, S. 1996, ApJ, 462, 215
- Sanders & Mirabel (1996) Sanders, D. B., & Mirabel, I. F. 1996, ARA&A, 34, 749
- Sanders et al. (1988a) Sanders, D. B., Soifer, B. T., Elias, J. H., Madore, B. F., Matthews, K., Neugebauer, G., & Scoville, N. Z. 1988a, ApJ, 325, 74
- Sanders et al. (1988b) Sanders, D. B., Soifer, B. T., Elias, J. H., Neugebauer, G., & Matthews, K. 1988b, ApJ, 328, L35
- Scoville & Sanders (1987) Scoville, N. Z., & Sanders, D. B. 1987, in Interstellar Processes, ed. D. Hollenbach & H. Thronson (Dordrecht: Reidel), 21
- Scoville et al. (2000) Scoville, N. Z. et al. 2000, AJ, 119, 991
- Smith et al. (1998) Smith, H. E., Lonsdale, C. J., & Lonsdale, C. J. 1998, ApJ, 492, 137
- Soifer et al. (2000) Soifer, B. T. et al. 2000, AJ, 119, 509
- Soifer et al. (2002) Soifer, B. T., Neugebauer, G., Matthews, K., Egami, E., Weinberger, A. J., 2002, AJ, 124, 2980
- Solomon et al. (1992) Solomon, P. M., Downes, D., & Radford, S. J. E. 1992, ApJ, 387, L55
- Solomon et al. (1987) Solomon, P. M., Rivolo, A. R., Barrett, J., & Yahil, A. 1987, ApJ, 319, 730
- Spoon et al. (2001) Spoon, H. W. W., Keane, J. V., Tielens, A. G. G. M., Lutz, D., & Moorwood, A. F. M. 2001, A&A, 365, L353
- Tran et al. (2001) Tran, Q. D. et al. 2001, ApJ, 552, 527
- Tsutsumi et al. (1997) Tsutsumi, T. Morita, K. -I. & Umeyama, S. 1997, in Astronomical Data Analysis Software and Systems VI, ed. G. Hunt, & H. E. Payne (San Francisco: ASP), 50
- Usero et al. (2004) Usero, A., Garcia-Burillo, S., Fuente, A., Martin-Pintado, J., Rodriguez-Fernandez, N. J. 2004, A&A, 419, 897
- Veilleux & Osterbrock (1987) Veilleux, S., & Osterbrock, D. E. 1987, ApJS, 63, 295
- Veilleux et al. (1995) Veilleux, S., Kim, D. -C., Sanders, D. B., Mazzarella, J. M., & Soifer, B. T. 1995, ApJS, 98, 171
- Veilleux et al. (1999) Veilleux, S., Kim, D. -C., & Sanders, D. B. 1999, ApJ, 522, 113
- Verter & Hodge (1995) Verter, F., & Hodge, P. 1995, ApJ, 446, 616
- Vignati et al. (1999) Vignati, P. et al. 1999, A&A, 349, L57
- Wilson (1995) Wilson, C. D. 1995, ApJ, 448, L97
- Xia et al. (2002) Xia, X. Y., Xue, S. J., Mao, S., Boller, Th., Deng, Z. G., & Wu, H. 2002, ApJ, 564, 196
| Object | Redshift | log (log /) | Far-infrared | ||||
|---|---|---|---|---|---|---|---|
| (Jy) | (Jy) | (Jy) | (Jy) | (ergs s-1) | Color | ||
| (1) | (2) | (3) | (4) | (5) | (6) | (7) | (8) |
| UGC 5101 | 0.040 | 0.25 | 1.03 | 11.54 | 20.23 | 45.5 (12.0) | cool |
| Mrk 273 | 0.038 | 0.24 | 2.28 | 21.74 | 21.38 | 45.7 (12.1) | cool |
| IRAS 172080014 | 0.042 | 0.20 | 1.66 | 31.14 | 34.90 | 45.9 (12.3) | cool |
Note. — Column (1): Object. Column (2): Redshift. Columns (3)–(6): f12, f25, f60, and f100 are the IRAS FSC fluxes at 12, 25, 60, and 100 m, respectively. Column (7): Decimal logarithm of the infrared (81000 m) luminosity in ergs s-1 calculated as follows: D(Mpc)2 (13.48 + 5.16 + ) ergs s-1 (Sanders & Mirabel, 1996). The values in parentheses are the decimal logarithms of the infrared luminosities in units of solar luminosities. Column (8): ULIRGs with f12/f25 () 0.2 are classified as cool (warm) (Sanders et al., 1988b).
| Object | Array | Observing Date |
|---|---|---|
| Configuration | (UT) | |
| UGC 5101 | D | 2004 Dec 22, 23, 24 |
| RAINBOW | 2005 Jan 20 | |
| C | 2005 Mar 9, 10 | |
| Mrk 273 | RAINBOW | 2005 Jan 22 and 31 |
| IRAS 172080014 | AB | 2005 Jan 26–28, Feb 7 |
| C | 2005 Mar 6, 7, 16–19, 26 |
| Object | Flux | Frequency |
|---|---|---|
| (mJy) | (GHz) | |
| UGC 5101 | 6 | 85.5 |
| Mrk 273 | 6 | 85.6 |
| IRAS 172080014 | 9 | 85.3 |
| Object | LSR velocity | FWHM | ||
|---|---|---|---|---|
| (km s-1) | (km s-1) | |||
| HCN | HCO+ | HCN | HCO+ | |
| (1) | (2) | (3) | (4) | (5) |
| UGC 5101 | 11830 | 11990 | 700 | 330 |
| 11585+11985 aa A double Gaussian fit of the HCN emission line (see 4). | 11990 | 270+375 aa A double Gaussian fit of the HCN emission line (see 4). | 330 | |
| Mrk 273 | 11310 | 450 | ||
| IRAS 172080014 | 12860 | 12820 | 530 | 470 |
Note. — Col.(1): Object name. Col.(2): LSR velocity {vopt ( 1) c} of the HCN emission peak. Col.(3): LSR velocity of the HCO+ emission peak. Col.(4): Line width of the HCN emission at FWHM. Col.(5): Line width of the HCO+ emission at FWHM.
| Nucleus | HCN | HCO+ | HCN/HCO+ | CO | Reference |
|---|---|---|---|---|---|
| (Jy km s-1) | (Jy km s-1) | (Jy km s-1) | |||
| (1) | (2) | (3) | (4) | (5) | (6) |
| UGC 5101 | 6.6 | 2.7 | 2.5 | 50 | a |
| 3.6+2.7 aa Blue (Left) and red (Right) components for the double Gaussian fit (see 4). HCO+ emission has a peak velocity close to that of the red HCN component. We attribute most of the HCO+ flux to the red component. | 2,1 aa Blue (Left) and red (Right) components for the double Gaussian fit (see 4). HCO+ emission has a peak velocity close to that of the red HCN component. We attribute most of the HCO+ flux to the red component. | ||||
| Mrk 273 | 4.8 | 2.7 | 1.8 | 78 | b |
| IRAS 172080014 | 14 | 8.1 | 1.7 | 132 | b |
Note. — Col.(1): Object name. Col.(2): Integrated HCN intensity at the nucleus. Col.(3): Integrated HCO+ intensity at the nucleus. Col.(4): HCN/HCO+ ratio in brightness temperature ( flux density) at the nucleus. The ratio is not affected by possible uncertainties in the absolute flux calibration (see 4). Col.(5): Integrated CO intensity at the nucleus taken from the literature. Col.(6): References for interferometric CO flux measurements. (a): Genzel et al. (1998).; (b): Downes & Solomon (1998).