Chandra and Spitzer unveil heavily obscured quasars in the SWIRE/Chandra Survey11affiliation: Some of the data presented herein were obtained at the W.M. Keck Observatory, which is operated as a scientific partnership among the California Institute of Technology, the University of California and the National Aeronautics and Space Administration. The Observatory was made possible by the generous financial support of the W.M. Keck Foundation. Based on observations at the Kitt Peak National Observatory, National Optical Astronomy Observatory, which is operated by the Association of Universities for Research in Astronomy, Inc. under cooperative agreement with the National Science Foundation. The National Radio Astronomy Observatory is a facility of the National Science Foundation operated under a cooperative agreement by Associated Universities Inc.
Abstract
Using the large multi-wavelength data set in the Chandra/SWIRE Survey (0.6 in the Lockman Hole), we show evidence for the existence of highly obscured (Compton-thick) AGN, estimate a lower limit to their surface density and characterize their multi-wavelength properties. Two independent selection methods based on the X-ray and infrared spectral properties are presented. The two selected samples contain 1) 5 X-ray sources with hard X-ray spectra and column densities , and 2) 120 infrared sources with red and AGN-dominated infrared spectral energy distributions (SEDs). We estimate a surface density of at least 25 Compton-thick AGN deg-2 detected in the infrared in the Chandra/SWIRE field of which 40% show distinct AGN signatures in their optical/near-infrared SEDs, the remainings being dominated by the host-galaxy emission. Only 33% of all Compton-thick AGN are detected in the X-rays at our depth (F(0.3-8 keV)10-15).
We report the discovery of two sources in our sample of Compton-thick AGN, SWIRE_J104409.95+585224.8 (=2.54) and SWIRE_J104406.30+583954.1 (=2.43), which are the most luminous Compton-thick AGN at high- currently known. The properties of these two sources are discussed in detail with an analysis of their spectra, SEDs, luminosities and black-hole masses.
1 Introduction
According to the AGN unification models (Antonucci, 1993; Krolik , 1999), all AGN are intrinsically similar, and the observational differences among various types are due to the geometry and orientation with respect to the line of sight of obscuring matter surrounding the central super-massive black hole (SMBH). According to this model, obscuring matter is ubiquitous in AGN, but the effects of absorption are only seen when the line of sight intercepts it. Alternative models attribute the presence of obscuration to a stage in the early phases of AGN evolution during a merger (Fabian , 1999). Mergers of large disk galaxies hosting a SMBH induce the growth of the SMBH and of the host galaxy spheroid throughout vigorous star-formation episodes. During this phase the AGN is surrounded by large amounts of gas and dust, thus it appears as heavily obscured. As the AGN reaches a certain luminosity, its radiation can cause the expulsion and destruction of the surrounding material and the system appears as an unobscured AGN (Silk & Rees , 1998; Granato et al., 2004; Springel et al. , 2005; Hopkins et al. , 2005; Di Matteo et al., 2005; Cattaneo et al., 2005).
Since AGN that are not affected by obscuration are relatively easy to detect and identify across the entire wavelength spectrum, they have been well sampled up to high redshifts and their properties, space density, luminosity function and redshift distributions are well measured (Ueda et al., 2003; Richards et al., 2005). On the other hand, AGN obscured by even only moderate column densities (1022 ) (Richards et al., 2003; White et al., 2003), are routinely missed in observations at various wavelengths because of the difficulty of detecting and identifying them, and, therefore, they are not as well understood. There is evidence that obscured AGN are numerous and might even outnumber unobscured AGN, however optically and X-ray selected samples of AGN are still dominated by unobscured AGN and large and complete samples of obscured AGN are still missing providing only few observables to constrain models.
1.1 Indirect evidence for the existence of highly obscured AGN
In the local Universe and for moderate (Seyfert-like) nuclear luminosities (), the observed ratio between obscured (1022) and unobscured (1022) AGN is 4:1 (Osterbrock & Shaw , 1988; Madau, Ghisellini, & Fabian , 1994; Comastri et al., 1995; Risaliti et al., 1999; Piconcelli et al., 2003) and 45% of the obscured ones are Compton-thick (column density larger than ) (Risaliti et al., 1999; Maiolino & Rieke, 1995). Large column densities () have been directly measured only in a few, 10, sources (e.g. NGC1068, Circinus, NGC4945). For most of the known Compton-thick AGN, 40 (Comastri , 2004), only indirect evidence to their extreme column densities is available (Bassani et al. , 1999; Risaliti et al., 1999; Maiolino et al., 2003), such as the flatness of the hard X-ray continuum, a large equivalent width (EW) of the Kα6.4 keV iron fluorescent emission line, or lower than expected values of the ratio between the flux in the X-rays and in other wavelengths. At higher-redshift (1) and luminosities (), the distribution of absorption in AGN is not as well constrained with only a few examples of confirmed obscured quasars. There is evidence that the fraction of obscured AGN decreases with higher intrinsic luminosities (Ueda et al., 2003; Szokoly et al. , 2004; Barger et al., 2005; Treister & Urry, 2005), and possibly increases with redshift (La Franca et al., 2005).
Other indications for the existence of numerous obscured AGN have been provided by AGN studies at wavelengths less affected by obscuration, such as infrared (IR) and radio. Stern et al. (2004) compared the surface density of an IR-selected sample of AGN () with that of an optically-selected (R-mag21) (Wolf et al., 2003) sample of AGN and found 2.8 times more AGN in the IR than in the optical sample. Since the ratio between the limiting fluxes of the two samples corresponds to the typical R-band/8µm flux ratio of unobscured AGN, the higher density of IR-selected AGN is attributed to an excess of obscured AGN. Similar results were obtained from an IR and radio selected sample of AGN (Martínez-Sansigre et al., 2005) in which the fraction of obscured sources at high-redshift (2) is estimated to be 50% (obscured:unobscured=1:1) or as high as 87% (obscured:unobscured=2.6:1) if sources which are not confirmed spectroscopically are also taken into account. An obscured:unobscured ratio of 2:1 was also derived from a sample of AGN selected at 24µm (Alonso-Herrero et al., 2005).
The existence of a large population of obscured AGN is also suggested by the shape of the X-ray background at high energies. More than 85% of the 2–10 keV Cosmic X-ray Background has been resolved by sources detected in deep X-ray surveys (Moretti et al., 2003; De Luca & Molendi, 2004). However, the resolved fraction decreases at higher energies, e.g. in the 4-6 keV energy range the resolved fraction is about 70–90%, whilst in the 8–12 keV band no more than 50% is resolved. Less than 30% is resolved above 10 keV, where the bulk of the CXRB energy density is produced (Worsley et al., 2004, 2005). The spectral shape of the residual background cannot be produced by a simple superposition of unobscured AGN spectra, but by an X-ray population with faint low-energy X-ray fluxes and hard X-ray spectra, as in obscured AGN (Worsley et al., 2005).
1.2 Searches for obscured AGN
In spite of the difficulty of finding and identifying highly obscured AGN, several searches have been conducted combining multiwavelength data (Webster et al. , 1995; Wilkes et al., 2002; Padovani et al., 2004; Donley et al., 2005; Stern et al., 2004; Martínez-Sansigre et al., 2005; Zakamska et al. , 2004; Urrutia et al., 2005), performing very deep observations (Treister & Urry, 2005; Van Duyne et al. , 2004) or surveying large areas of the sky (Cutri et al., 2002; Fiore et al., 2003; Zakamska et al. , 2004; Urrutia et al., 2005). Obscured AGN candidates have been selected among X-ray sources with hard X-ray spectra or with high (10) X-ray over optical flux ratios (Fiore et al., 2003; Rigby et al. , 2004), with radio emission in excess compared to the IR (Donley et al., 2005; Urrutia et al., 2005) or with narrow emission lines in their optical spectra (Zakamska et al. , 2004). These sources are predominantly characterized by column densities of the order of 1022 and by various types of optical spectra, with narrow emission lines as expected in type 2 AGN, but also with broad emission lines, as in unobscured AGN, or typical of normal, early and late-type, galaxies (Fiore et al., 2003; Perola et al., 2004).
All these studies aimed at finding the obscured AGN population predicted by models and indirect observations have been successful to varying degrees. However, most of these sample are affected by selection effects and characterized by properties too broad to constrain models, and the measured column densities are only moderate (=1022-23). A common property of these moderately obscured AGN is the variety of optical/near-IR spectral energy distributions (SEDs), with only a minority of sources showing typical AGN signatures (Franceschini et al., 2005; Donley et al., 2005; Rigby et al. , 2004). Consequently, any search in a specific wavelength range will provide incomplete samples of obscured AGN.
In this work, we aim at identifying and characterizing only the most obscured AGN, with columns densities of the order of 1024 , the so-called Compton-thick AGN. By looking at the most obscured AGN which are also the hardest to find because of their elusive properties, we hope to provide useful constraints on AGN models. Our analysis is based on the sources detected by Spitzer and Chandra in a wide area (0.6 ) multi-wavelength (from radio to X-ray) survey performed in the Lockman Hole, the Chandra/SWIRE survey. This field was selected for deep follow-up observations within the Spitzer Wide-Area Infrared Extragalactic Survey (SWIRE) (Lonsdale et al., 2003, 2004) legacy project. By comparing samples selected independently in the X-rays and in the IR, the incompleteness level of each selection method can be estimated. The available multiwavelength data set is described in Section 2. In Section 3, we present our selection methods for heavily obscured AGN, an X-ray based selection in Section 3.1 and an IR based selection in Section 3.2. The general properties of the two samples, SEDs, X-ray over optical and mid-IR fluxes are discussed in Sections 3.2.2 and 3.2.3. A detailed analysis of the properties of two spectroscopically confirmed Compton-thick quasars present in both samples is given in sections 4 (data description), 5 (SED analysis), and 6 (bolometric luminosity and black hole mass estimate). A comparison between our candidates and other samples of heavily obscured AGN is presented in section 7. In Section 8, we estimate a lower limit to the surface density of Compton-thick AGN detected in the IR at our sensitivity limits in the Chandra/SWIRE field and compare our estimates with current models. Our results are summarized in Section 9.
Throughout the paper, we adopt a flat cosmology with H0 = 71 , =0.27 and =0.73 (Spergel et al., 2003).
2 Observations
The Chandra/SWIRE field, located in the northern part of the Lockman Hole Field (10h45m, +59∘), has been selected as the target for the deepest IR, optical and radio SWIRE observations, and for a moderately deep and wide Chandra survey. This field has the lowest cirrus sky emission of all of the SWIRE fields (0.38 MJy/sr at 100µm) and has no contamination from moderate brightness radio sources, making it ideally suited for a radio-IR survey. The neutral Galactic column density toward this field is on average 6.43 (Dickey & Lockman , 1990), making it ideal also for deep X-ray surveys. The data available in this field are summarized in Table 1 and details on the observations are given in the following sections.
2.1 Optical and Infrared Imaging Observations
Optical imaging in , , , and was obtained with the Mosaic Camera at the Kitt Peak National Observatory (KPNO) Mayall 4-mt Telescope on February 2002 (, , and ) and January 2004 (). The coverage of the field is not uniform, the central 0.3 (=161∘–162∘ and =58.75∘–59.25∘) were covered with a 3 hour exposure in , , and , and with a 6 hour exposure in -band to 5 limiting Vega magnitudes of 24.8 (), 25.9 (), 25.2 (), and 24.4 (). The surrounding area at 58.6∘ was also covered in four bands with 50 min exposure in , and , 30 min exposure in , and with a 2 hour exposure in -band to a depth of 24.3 (), 25.2 (), 24.4 (), and 23.5 (). The small region at 58.6∘ was observed only in the , , and bands with a 30 min exposure to a depth of 23.7 (), 23.5 (), and 22.9 (). The astrometry is good to less than 0.4 arcsec and the seeing varies between 0.9 and 1.4 arcsec. The data were processed with the Cambridge Astronomical Survey Unit’s reduction pipeline following the procedures described in Babbedge (2004a). Fluxes were measured within 3″ apertures (diameter) and corrected to total fluxes using profiles measured on bright stars. Total magnitudes, derived by integrating over the curve of growth, were adopted for sources extended and bright in the three filters , , and (23.8, 22.7, 22.0). The optical catalog contains 77,355 sources (galaxies and stars) of which 45,573 are detected in at least two bands.
Near-IR imaging observations were carried out with the 200″ Hale Telescope of the Palomar Observatory using the Wide Infrared Camera (WIRC; Wilson et al. (2003)) on 2004 March 29 under photometric conditions. The field was partially covered, 0.43 , with 24 8585 pointings of 72 min exposure. Data reduction for the near-IR imaging consisted of median-sky removal, flat-fielding using a median “sky” image derived from the science observations, co-addition, and astrometric and flux calibration. The seeing FWHM ranges between 0.7 and 1.3 arcsec. Sources were extracted using SExtractor (Bertin & Arnouts , 1996) and MAG_BEST magnitudes were adopted. Calibration was carried out using the near-IR 2MASS Point Source Catalog (Cutri et al., 2003). The Ks-band photometric uncertainty, relative to 2MASS, is 6% and the 5-sigma sensitivity is 20.5 mag (Vega). The catalog contains 19,876 sources, of which 17,140 have an optical counterpart.
Observations with the Infrared Array Camera (IRAC) (Fazio et al., 2004) were performed on 2003, December 5 and 2004, April 24–30 and observations with the Multiband Imaging Photometer (MIPS) (Rieke et al., 2004) were performed on 2003, December 9 and 2004, May, 4–11. The IRAC depth was 120–480 seconds, depending on exact field location, with a median depth of 240 seconds and MIPS depth was 160–360 seconds, with a median depth of 360 seconds. Fluxes were measured using SExtractor (Bertin & Arnouts , 1996) from mosaics of the flat fielded images processed by the Spitzer Science Center using the S11 data pipelines. Fluxes were extracted in 58 diameter apertures for IRAC (2-3 the FWHM beam) and 12″ for MIPS 24µm using SExtractor (Bertin & Arnouts , 1996) and corrected for aperture to total fluxes using the IRAC/MIPS point spread functions (PSFs). In the case of extended sources (SExtractor stellarity index 0.8 and ISO_Area200) in the IRAC images, Kron fluxes were used. Details of the IRAC and MIPS data processing are given in Surace et al. (2005). The 5 depths of the Spitzer data are 5, 9, 43, 40 and 230 Jy at 3.6, 4.5, 5.8, 8.0 and 24µm, respectively. The IR catalog contains 41,262 sources, of which 31,106 have an optical counterpart.
2.2 Chandra X-ray Data and Analysis
We have obtained Chandra Advanced CCD Imaging Spectrometer (ACIS-I) (Weisskopf, O’dell, & van Speybroeck , 1996) observations in a 33 raster of a 0.6 region with center = 10h 46m and =+59∘ 01′ and 2′ overlap between contiguous pointings within the Lockman Hole field of the SWIRE survey. The exposure time for each observation was 70 ksecs, reaching broad- (0.3–8 keV), soft- (0.3–2.5 keV) and hard-band (2.5-8 keV) fluxes of , 5, and 10-14 , respectively. The observations were obtained on 2004, September 12-26 and processed using the XPIPE pipeline developed for analysis of Chandra data for the ChaMP project (Kim et al., 2004). XPIPE screens bad data, corrects instrumental effects remaining after the standard pipeline processing, detects the X-ray sources (using WAVDETECT (Freeman et al., 2002) in the CIAO 3.2 software package111Chandra Interactive Analysis of Observations (CIAO), http://cxc.harvard.edu/ciao/) and determines counts in the soft (0.32.5keV), hard (2.58.0keV) and broad (0.38.0keV) bands. A false-positive threshold of 10-6 in WAVDETECT is used to accept a source, corresponding to spurious source per ACIS-I chip, or 4 per field. The background and exposure-corrected count-rates for each source were converted to fluxes using conversion factors computed using XSPEC and assuming a power-law model (, where is the energy, the flux density, is the photo-electric cross-section (Morrison & McCammon , 1983), is the photon index, and is the column density associated with the absorbing material) with =1.7 and =61019 . The analysis of the X-ray data and details on the observations will be presented in a future publication.
A total of 812 sources were detected in the initial analysis. The X-ray source list was cross-correlated with the Spitzer source list using a search radius corresponding to the quadratic sum of the Chandra positional uncertainty (2″ minimum) and of the IR positional uncertainty that was fixed to 2″. Based on the visual inspection of the images and on the low detection reliability, 20 sources are considered to be spurious. This is roughly the number expected since 1 source per ACIS chip would lead to 27 spurious sources. These X-ray sources were not included in the X-ray catalog for further analysis, reducing the total number of X-ray sources to 792. An IR counterpart is matched to 766 sources, 631 of which are also detected in the optical images. Sixteen sources are detected only in the optical and 10 X-ray sources do not have either an IR or optical counterpart. The majority of the X-ray sources (561 out of 792 sources or 71%) has a unique optical or IR counterpart within the positional uncertainty and 213 sources have multiple matches (130 sources have 2 matches, 49 have 3 matches and the remaining 34 have more than 3 matches). In the case of multiple matches the closest source was chosen as the counterpart, unless there was another candidate at similar distance that was a brighter and redder IR source (10 cases). To estimate the reality of the associations we calculated the probability of random matches between the X-ray sources and the possible Spitzer counterparts following the same procedure discussed in Fadda et al. (2002) and in Franceschini et al. (2005) which assumes that the IR population follows a Poisson spatial distribution. Most of the Chandra sources with multiple associations are unambiguously identified as the X-ray positional uncertainty is small (2″) and one counterpart is at less than 05 from the X-ray source and the others are at more 2″. In eight cases, the positional uncertainties were so large, i.e. sources at large off-axis angles, to have several possible matches. The closest source was selected, however the reliability of these matches is very low. Approximately 88% have a probability of random matches 5%. Summing the probabilities we expect about 19 false associations in the 774 matched sources. Eighteen of the 774 matched sources are close to bright sources, mostly stars, and, therefore, do not have reliable optical and IR photometric measurements.
2.3 Radio Imaging
A deep, 1.4 GHz radio map centered at =10h46m, =+59∘01′, and covering 40′40′ in the Chandra/SWIRE field, was obtained at the Very Large Array (VLA) during multiple dates, on 2001, December 15, on 2002, January–March and on 2003, January 6 (Owen, F. et al., in preparation). VLA configurations A/B/C and D were used. The total integration time spent on source was 500 ks. The root-mean-squared (rms) noise in the center of the radio image is 2.7 Jy. The source density decreases at larger distances from the center of the field, from about 9400 sources deg-2 within 10′ from the center (4.5Jy rms), to about 4300 sources deg-2 at a distance between 10′ and 20′, and less than 1000 sources sources deg-2 at a distance greater than 20′(16Jy rms). There are 2052 radio sources in the entire field and 2000 are also detected in the IR with IRAC. The fraction of IR sources that are detected at radio wavelengths varies from 13% within 10′ from the center of the radio field to about 7% in the entire radio field. The fraction of X-ray sources that are radio detected is almost four times higher than the fraction of radio detected IR sources, with 50% of all X-ray sources within 10′ from the center and 27% in the whole field.
2.4 Optical Spectroscopy
Spectroscopic observations were carried out using various facilities, with Hydra on the WIYN Observatory on 2004, February 11–15; with the Low Resolution Imaging Spectrometer (LIRS) (Oke et al., 1995) on the Keck I telescope on February 24–25, 2004 and March 3–4, 2005; and with the Gemini Multi-Object Spectrograph (GMOS) on the Gemini Observatory on February 21–23, 2004. Details on these observations will be published in a future publication (Smith, H. et al., in preparation). Details on the Keck observations are given in section 4.1. Spectroscopic redshifts from the Sloan Digital Sky Survey222http://www.sdss.org (SDSS) are also available. In total, spectroscopic redshifts are available for 574 IR sources of which 74 are also X-ray sources, 48 from Keck, 81 from Gemini, 412 from WIYN, and 35 from SDSS.
The IR, X-ray and radio source lists and the matched multi-wavelength catalogs with be presented in a future publications (Polletta, M. et al.; Owen, F. et al., in preparation).
3 Selection of obscured AGN candidates
In the following sections, we present two methods for selecting AGN with extreme column densities (), the so called Compton-thick AGN, one based on the X-ray properties and one based on the optical-IR properties. Since the methods require knowing the redshift, and spectroscopic redshifts are available for only a small fraction of sources, we supplement the spectroscopic redshifts with photometric redshifts. Photometric redshifts were derived using the code HYPERZ (Bolzonella et al., 2000). HYPERZ measures photometric redshifts by finding the best-fit, defined by the -statistic, to the observed SED with a library of galaxy templates. We use 24 galaxy templates that represent normal galaxies (9), starbursts (3) and AGN (12) and cover the wavelength range from 1000Å to 500 (Polletta et al., in preparation). The same method and template library has been used to fit the SEDs of a sample of X-ray detected AGN in the ELAIS-N1 field (Franceschini et al., 2005).
3.1 X-ray selected Compton-thick AGN
Compton-thick AGN can show a variety of X-ray spectra, soft and hard, according to the amount of absorption and reflection components (Smith & Done , 1996; Matt et al., 2000). Therefore, soft X-ray spectra do not necessarily imply low or lack of absorption. However, hard X-ray spectra and X-ray luminosities greater than 1042 can be only explained by presence of absorption and can, therefore, be used to identify obscured AGN.
In this work, we select sources with hard X-ray spectra and estimated column densities of the order of 1024 . This method is biased against Compton-thick AGN in which the primary radiation is completely obscured at the observed energies (8 keV) and only the warm scattered component is observed which produces soft X-ray spectra. This selection effect is less important for high- sources where the observed radiation is emitted at higher energies in the source rest-frame, which are less affected by obscuration, e.g.; for a column density of 1024 the observed flux between 0.3 and 8 keV is reduced by about 98% at 0, and by 71% at =2 assumig a photon index =1.7. Since most of the X-ray sources in the sample are too faint (75% of the sample has less than 50 broad-band X-ray counts) to perform full spectral fitting, the amount of absorption is estimated by comparing the counts in the hard- and soft-X-ray bands. Previous studies (Dwelly et al., 2005; Mainieri et al., 2002; Della Ceca et al., 2004; Perola et al., 2004) have shown that colour based analysis are effective in deriving the properties of X-ray sources with few counts.
Hardness ratios, HR, defined as (H-S)/(H+S), where H corresponds to the X-ray counts in the hard band (2.5-8 keV) and S to the X-ray counts in the soft band (0.3-2.5 keV) were derived from the observed counts for all of the sources. In order to derive the corresponding absorption, Sherpa (Freeman et al., 2001) simulations were performed for each source assuming an absorbed power-law model. The power-law slope was fixed to a conservative (in terms of estimate) value, corresponding to the observed mean for AGN (Nandra & Pounds , 1994) and the column density varied from = 1019 to 1024.5 . The Bayesian method (van Dyk et al. , 2004) was applied to take into account the differences in effective area across the detector by estimating the local background for each source. Each spectrum was used as input to MARX333http://space.mit.edu/CXC/MARX to create a simulated data set. Hardness ratios were calculated from the simulations of each source and the corresponding were tabulated. The tabulated values were then used to determine the by comparison with the observed HR. In order to derive the effective hydrogen column density, rest, the measured was corrected for the redshift of the source taking into account the energy dependence of the photo-electric cross section (Morrison & McCammon , 1983), rest= (Barger et al., 2002; Longair et al., 1992). Photometric redshifts were used when spectroscopic redshifts were not available.
We found 10 X-ray sources with an intrinsic as derived from the observed HR, assuming spectroscopic redshifts when available and photometric redshifts for the others. Photometric redshifts are still preliminary as more spectroscopic redshifts are being collected and improvements are being implemented. Currently, the total for the whole sample of 574 sources with spectroscopic redshifts is 0.26 in 1+, the rate of outliers (defined by ) is 8%, and the obtained after removing the outliers is 0.08. Although these values are consistent with those derived in other samples of galaxies and AGN (Babbedge , 2004b), the uncertainties are still quite large. Therefore, after the selection based on the best photometric redshift, we examined all of the possible solutions obtained by fitting the observed SED with various templates and redshifts. After comparing the reduced of all solutions with the given by the best-fit solution, , we removed four sources with secondary solutions with at a redshift below the value required to have an rest=1024 . Another source was removed because of poor optical and IR photometric data due to a bright nearby star which did not allow a reliable fit. The final X-ray selected sample of obscured AGN candidates contains 5 sources. Their basic properties (coordinates, band magnitudes, IR and radio fluxes) are reported in Table 2, their X-ray properties (broad-, soft- and hard-band X-ray fluxes, redshifts, column densities and absorption corrected broad band luminosities) are listed in Table 3, and their SEDs are shown in Figure 1.
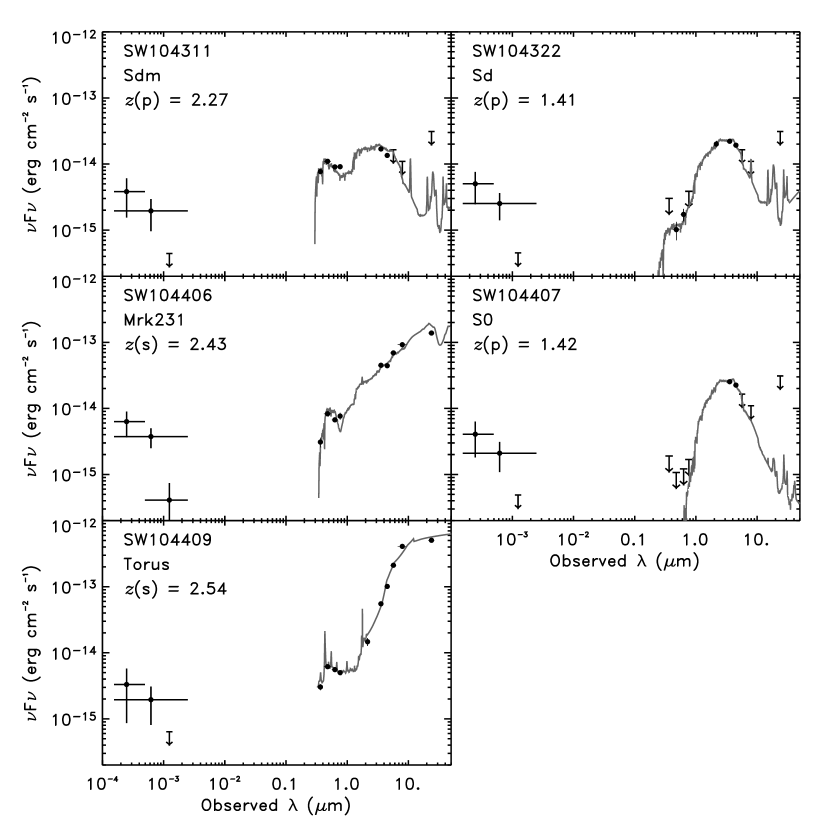
Two sources show SEDs dominated by AGN emission. Spectroscopic data are also available for these two sources and show narrow emission lines typical of type 2 AGN. A detailed analysis of the SEDs of these two sources is presented in Sections 4, and 5. The SEDs of the other three sources are dominated by starlight in the optical and near-IR and are best-fitted with spiral galaxy templates. The estimated redshifts range from 1.4 to 2.5, the column densities range from 1.0 to 91024 and the absorption-corrected X-ray (0.3-8 keV) luminosities from 2.51045 to 9.5 implying that these are all Compton-thick quasars.
3.2 IR-selected obscured AGN
Since Compton-thick AGN might be too faint in the X-rays to be detected at our sensitivity level, we need a complementary selection method that can be applied to the entire IR sample independently of their X-ray data.
In obscured AGN, the X-ray radiation is absorbed by gas and dust surrounding the nuclear region and re-emitted in the mid- and far-IR after being thermally reprocessed. Since IR radiation is less affected by obscuration than optical and X-ray emission, AGN selection at these wavelengths is less biased against obscured AGN. However, AGN usually represent only a small fraction of all of the sources detected in IR surveys compared to the far more numerous and strong IR emitters, such as galactic sources, normal and starburst galaxies. Moreover, their IR spectral properties can be indistinguishable from those of non AGN sources when only a few IR bands are available. IR-selected AGN can thus be less reliable than X-ray and optical selected samples. The Spitzer Space Telescope (Werner et al., 2004), thanks to the wavelength range accessible to IRAC (Fazio et al., 2004), offers the capability to easily identify a large fraction of the AGN population (Lacy et al., 2004; Stern et al., 2004) through a simple color analysis that efficiently removes the majority of non-AGN sources.
In the mid-IR, AGN are characterized by red and almost featureless spectra (Houck et al. , 2005; Hao et al., 2005; Weedman et al., 2005). These properties make their IRAC (3.6, 4.5, 5.8, and 8.0 m) colors unique among other IR sources, such as galaxies and stars, providing a powerful tool to identify them (Lacy et al., 2004; Stern et al., 2004; Hatziminaoglou et al., 2005). However, this diagnostic is effective only when the AGN is the dominant energy source. In cases where thermal radiation produced by dust associated with the AGN is self-absorbed and/or thermal radiation from dust in star-forming regions is more luminous than that produced by the AGN, e.g. as in the Seyfert 2 galaxies NGC 4945 and NGC 6240 (Maiolino et al., 2003; Rigopoulou et al., 1999), the AGN IR emission is fainter or negligible compared to that produced by star-formation processes in the host-galaxy (Peeters et al., 2004). The IR SED and IRAC colors of these AGN may be indistinguishable from those of starburst and normal star-forming galaxies (i.e. dominated by cool/warm dust and PAH features at 0.6 and by stellar light at 0.6) (Franceschini et al., 2005; Alonso-Herrero et al., 2004; Rigby et al. , 2004). In these sources, the AGN might manifest itself at other wavelengths, in the X-rays, if not completely obscured, as in the 3 stellar-dominated Compton-thick X-ray AGN reported in Section 3.1, in the radio or in optical and IR spectra, if the light is not diluted by the host galaxy starlight (Moran, Filippenko, & Chornock , 2002).
In order to select heavily obscured AGN candidates among the IR population independently of their X-ray properties, we require a red and featureless IR SED, and red optical SEDs or red optical-IR colors to remove unobscured AGN. This requirement would be satisfied by only a subset of all obscured AGN for the reasons given above. We first selected all of the extragalactic IR sources that are detected at a 5 level in at least 3 IR bands over the wavelength range 3.6-24m. This reduced the IR sample from 41,262 to 4493 sources of which 2726 (60%) are detected at 24µm. Note that about 46% of the extragalactic X-ray sources with an IR counterpart in the SWIRE/Chandra field do not satisfy this selection criterion. The next step in the selection procedure is done automatically through an algorithm that calculates the spectral slope and goodness of a power-law model fit to the observed SED () between 2.15 and 24m, which includes the -band data, the four IRAC bands and the MIPS 24m band. All of the sources with a monotonically rising IR SED, a spectral slope (defined as ) larger than 1.0 and reduced are then selected. The slope threshold is defined to reject sources with blue SEDs typical of early-type galaxies. The -test is used to select sources with smooth red SEDs, not necessarily power-law like, and to remove sources with variations in their SEDs due to the presence of spectral features, e.g. PAHs. AGN may show IR SEDs with a convex round shape in Log(Fν) instead of a straight power-law spectrum, or a dip at 24m due to the 9.7m Silicate absorption feature at 1.5 (Franceschini et al., 2005; Alonso-Herrero et al., 2004; Rigby et al. , 2004; Rigby et al., 2005; Houck et al. , 2005; Weedman et al., 2005; Hao et al., 2005). For these AGN a power-law model fit does not provide a good fit, but it is a reasonable first-order approximation to their IR SEDs. The expected and values for AGN and normal galaxies were derived from a simulated catalog of sources of different types and redshifts and several combinations of detections in the same filter systems as available for the SWIRE catalog. The simulated catalog was created from the same template library used to derive photometric redshifts and uncertainties to the observed fluxes were added in order to resemble those of the SWIRE catalog. The SEDs of a sub-set of randomly selected objects with a broad range of and were also visually inspected for verification and parameters tuning. Non-detections were taken into account by requiring the power-law model to be consistent with the upper limits. This selection reduces the sample from 4493 to 248 sources of which 93% are detected at 24µm. Although the selection does not require a detection at 24µm, the large fraction of 24µm sources is not surprising due to the combination of the minimum required power-law slope (=1) and the SWIRE sensitivity. The faintest source with =1 and detected in 3 IRAC bands will have a 24µm flux of 120Jy, only a factor of 2 lower than our 5 limit. Sources with brighter fluxes and redder SED will then be easily detected at 24µm. Only 23% (90 sources) of the X-ray detected sources with 3 IR detections have IR SEDs that satisfy the above criterion. This is consistent with previous SED analysis of X-ray selected AGN which find typical AGN SEDs for only 30% of all X-ray selected AGN (Franceschini et al., 2005). In order to remove likely unobscured quasars, we then selected all of the sources with optical-IR colors redder than those typical of unobscured quasars or red optical SEDs. These requirements are satisfied if a power-law () fit to the optical SED of a source detected in , , has a slope, , greater than 2, or if at least two of the following conditions are verified, , , and . This final criterion is satisfied by 181 sources, of which 78 do not have an optical counterpart at the survey limits (see Section 2.1). Note that for blank sources fainter than 16Jy at 3.6µm and located where the optical observations are the least sensitive (58.6∘) this criterion can not verified, but at this stage of the selection, they are kept in the sample for completeness. This selection removes 67 sources, of which 42 are X-ray sources. Among the rejected sample, 61 sources have optical-IR SEDs consistent with those of unobscured AGN like optically selected quasars.
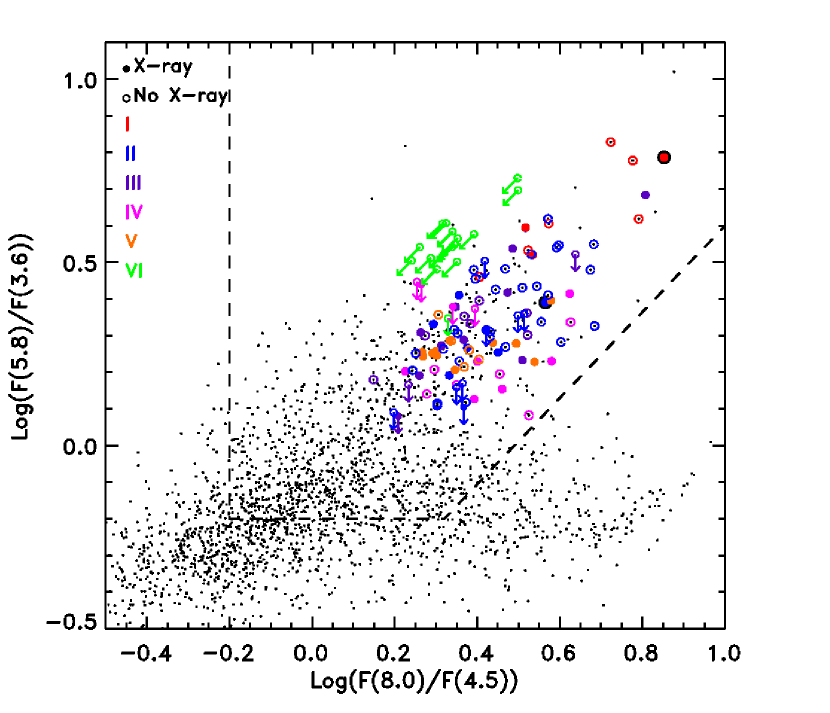
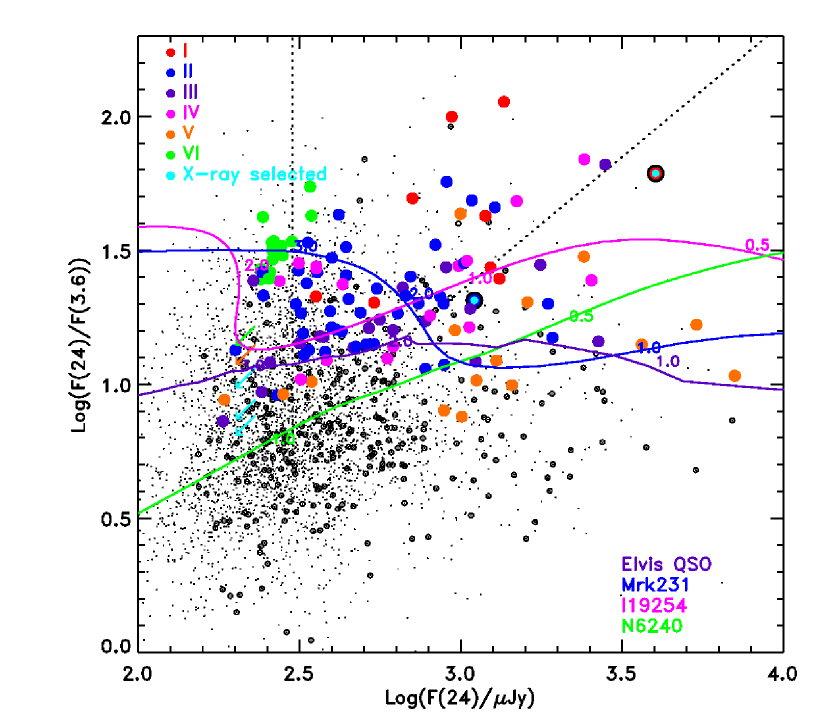
The SEDs of the remaining 181 obscured AGN candidates were fitted using HYPERZ and the library of 12 normal galaxy and 12 AGN templates. Only the sources that did not have any acceptable solutions (a minimum in the distribution) with normal galaxy templates were kept for a final sample of 120 sources. Among the rejected sources, several can be high redshift galaxies whose optical and near-IR emission is due to stellar light. Some of the rejected sources might host an AGN, but in order to increase our sample reliability we decided to remove any dubious cases. This selection removes 7 X-ray sources from the sample, yielding a total of 41 X-ray sources among the IR-selected obscured AGN. The X-ray properties of the 41 X-ray sources out of the 120 IR-selected sample of AGN candidates are reported in Table 5 and described in Section 3.2.1. For all of the selected sources, even for those that are not detected in the optical images, the 3.6µm over optical flux ratio is constrained to be higher than the limits given above. The IRAC colors of the selected sample compared to the rest of IR sources in the Chandra/SWIRE field are shown in Figure 2. The dashed line delimits the region where AGN are most likely to be found (Lacy et al., 2004) (see also Stern et al. (2004); Hatziminaoglou et al. (2005)).
In the initial sample of 4493 sources, less than 9% are X-ray sources, but 34% of the selected sample of obscured AGN candidates are X-ray sources. Among the IR-selected AGN that were rejected because consistent with unobscured AGN, 63% are X-ray sources. These values are consistent with a selection that favors AGN. Only two sources are not detected at 24µm and four have a 24µm flux below the nominal 5 limit. A 24µm detection for these four sources was confirmed after a visual inspections of the images. Note that the sensitivity of the 24µm data varies across the field due to a variation in the number of coverages. The adopted 5 limit of 230Jy is valid for the areas with median coverage in the SWIRE/Chandra field.
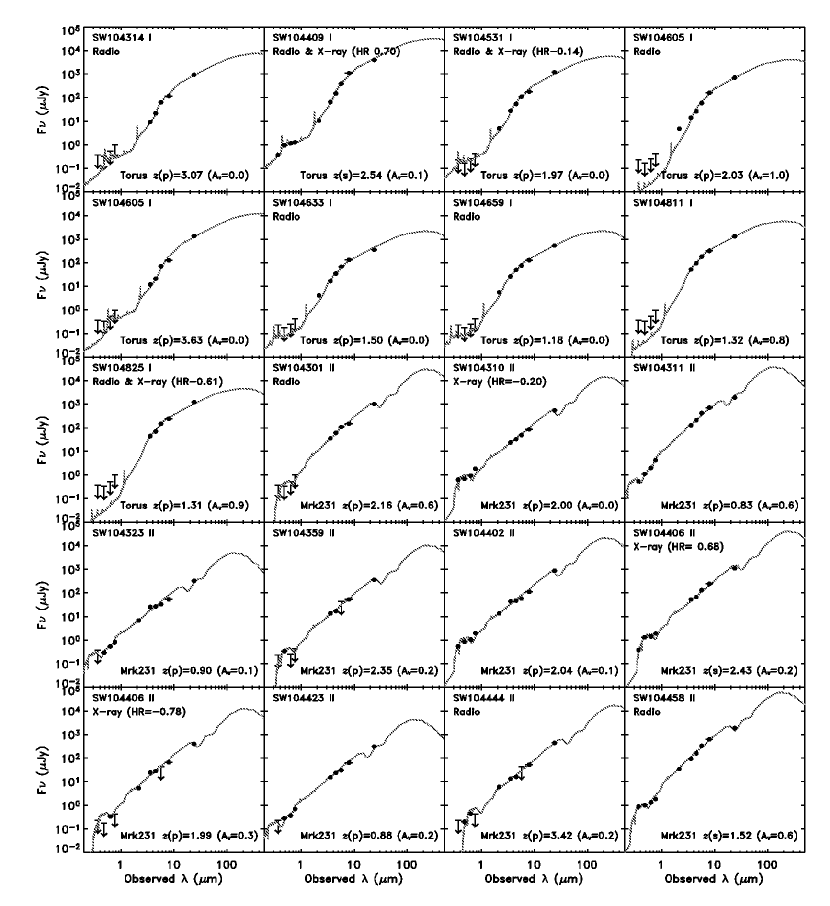
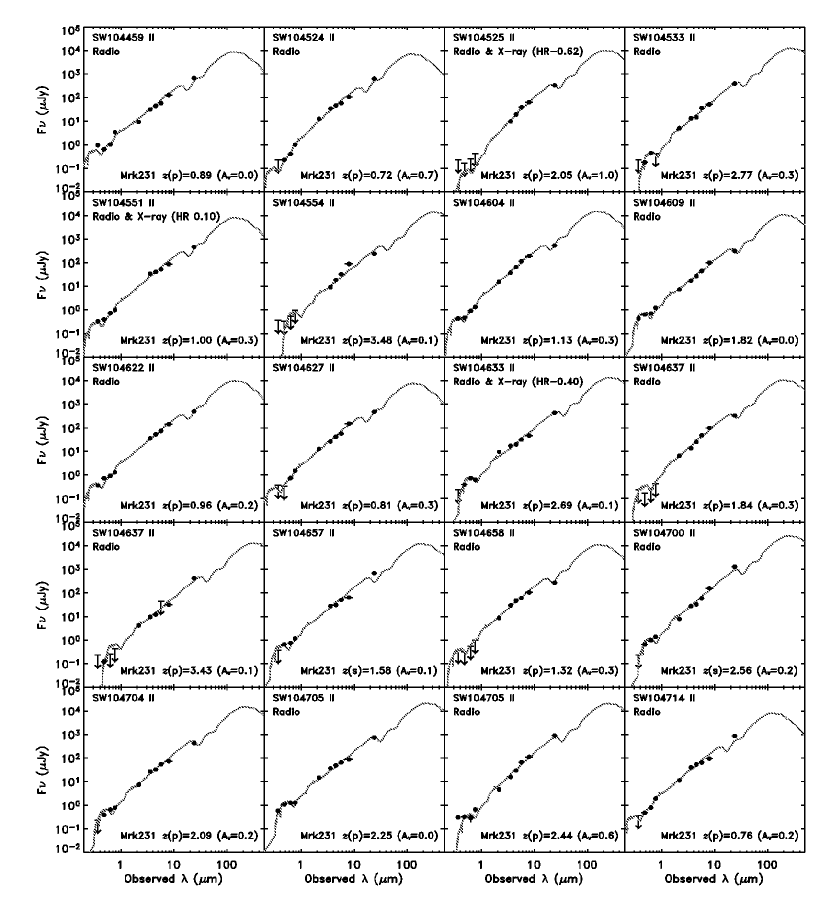
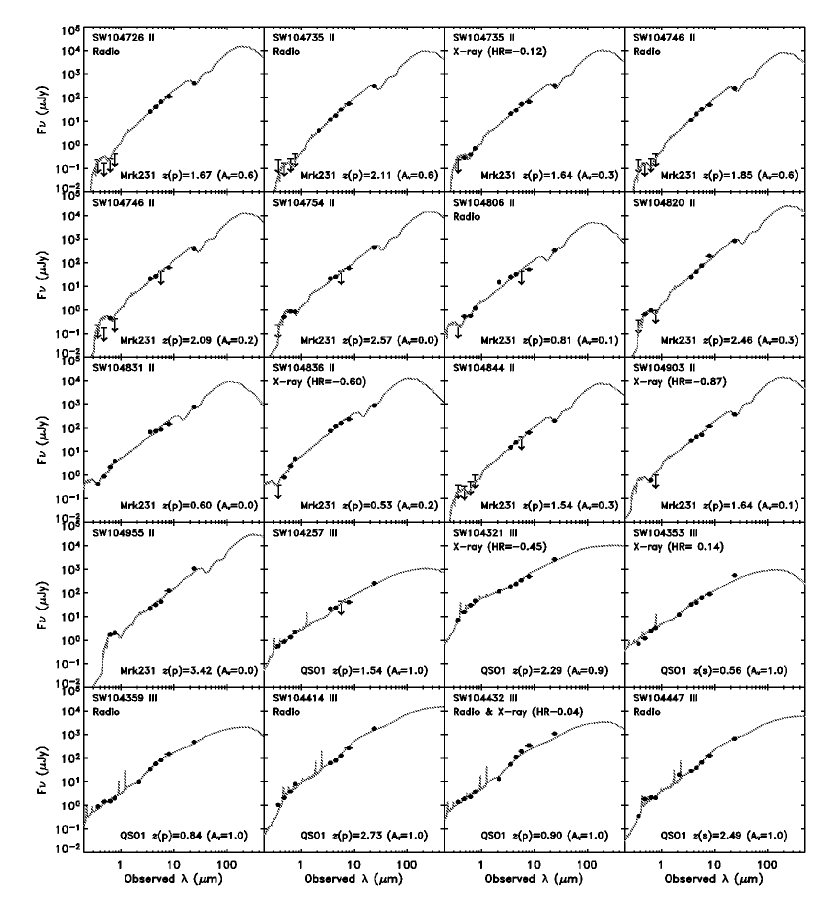
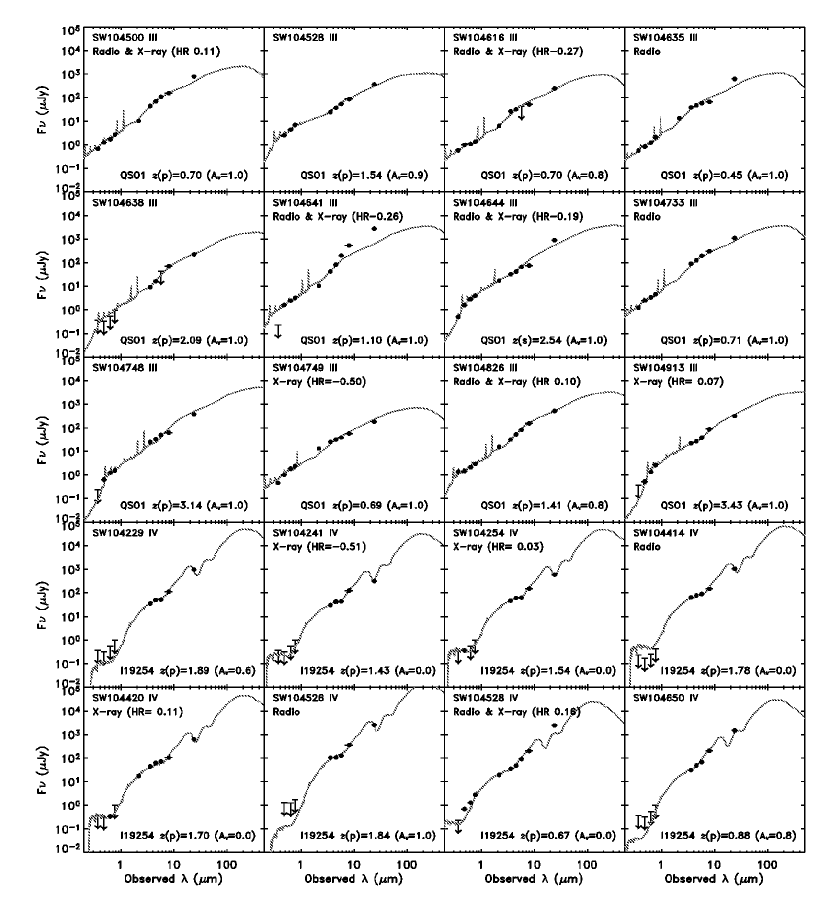
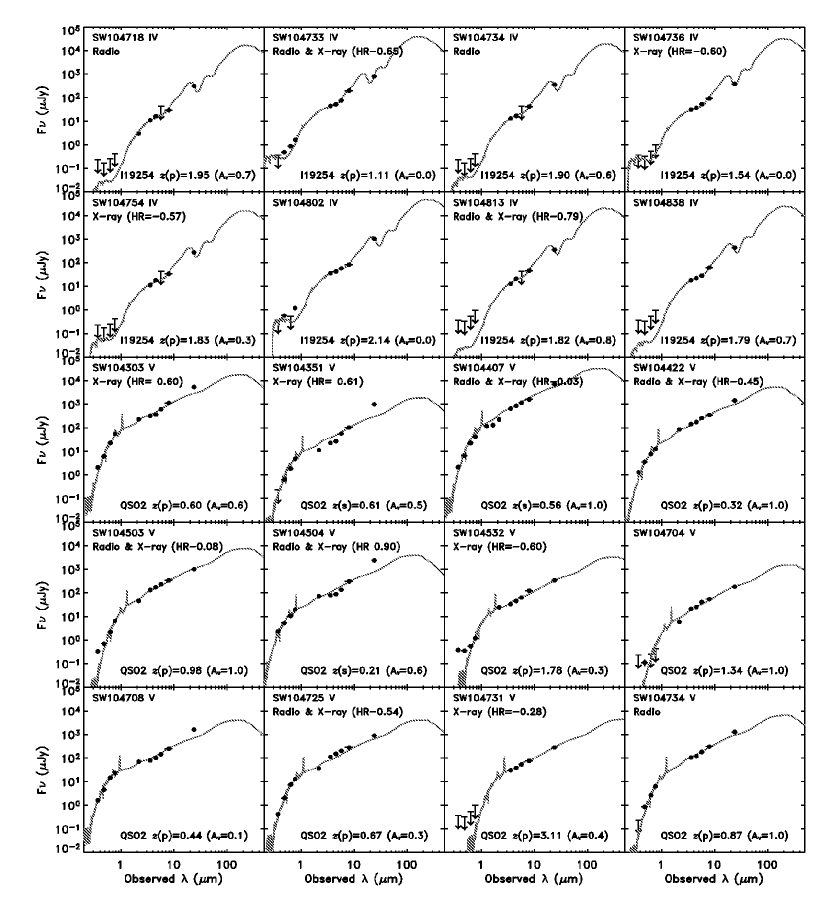
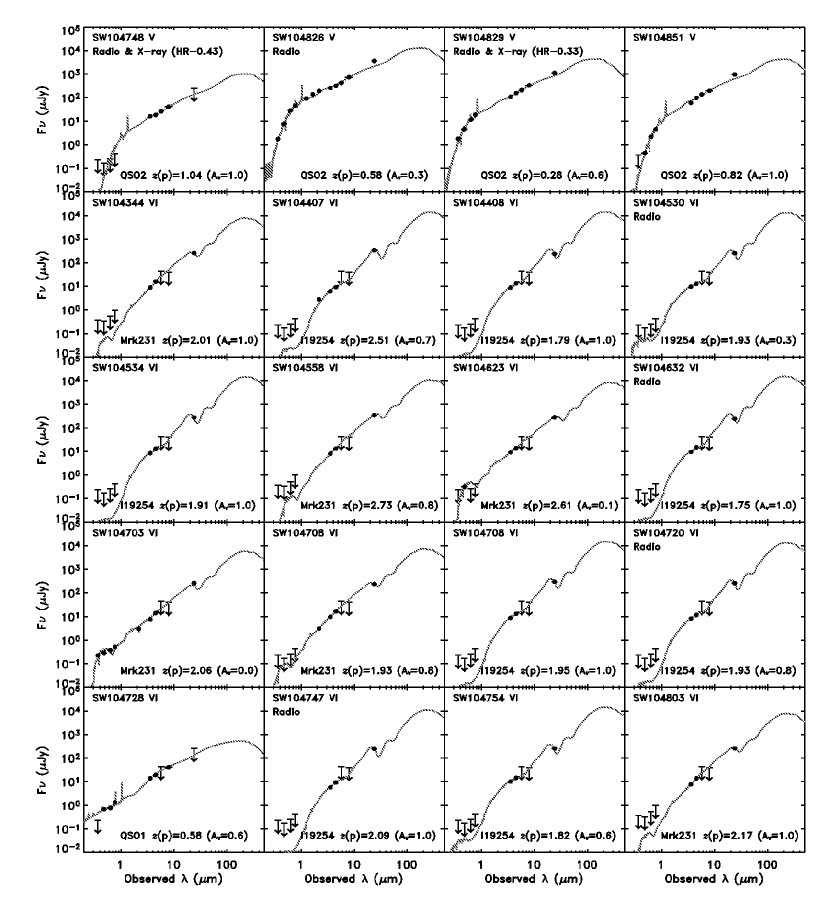
The sample was divided in six categories, from I to VI, five categories (I–V) were defined based on their best-fit template one category (VI) was defined based on the low number (3) of detections in the IR. Class I sources (9) have IR SEDs characterized by a convex shape that are well fitted with a “Torus” template (see Section 5.1). Class II sources (44) show power-law like optical-IR SEDs, similar to Mrk 231 or slightly redder (A1). Similarly, class III sources (19) have power-law like optical-IR SEDs, but not as red as Mrk 231; a reddened QSO template (A0.6–1.0) provides a better fit. Class IV sources (16) show SEDs consistent with templates of composite sources with contributions from both star-forming regions and an AGN component. This interpretation is supported by an excess at 24m with the respect to the extrapolation of the power-law representing the hot dust continuum associated with the AGN, this excess is likely associated to emission from the PAH bands. Class V objects (16) are characterized by a turnover in the SED with optical SEDs much redder than the IR SED. These sources might be composite objects where the optical emission is dominated by stellar light, from either an old or a reddened stellar population, and the IR emission is associated to the AGN. Class VI objects (16) are fainter than the rest of the sample and detected only in three bands from 3.6 to 24m, their SEDs show a distinct signature of AGN in their extreme red F(4.5µm)/F(3.6µm) flux ratios. Upper limits to the flux in the bands are consistent with the models used to describe the other classes. Names, coordinates, magnitudes, IR fluxes and classification of the IR-selected obscured AGN candidates are listed in Table 4 and their SEDs are shown in Figure 3. Photometric redshifts were used to over-plot the best-fit template on each SED when spectroscopic redshifts were not available. The redshifts are used only to visually characterize the SED shape of these sources by comparing them with AGN templates.
Only eleven sources have spectroscopic redshifts. Spectroscopic redshifts are indicated as (s) and photometric redshifts as (p) in Figure 3 and listed in Table 4. The optical spectra of seven sources (SW104351, =0.609; SW104409, =2.540; SW104406, =2.430; SW104447, =2.488; SW104644, =2.542; SW104657, =1.579; and SW104700, =2.562), show emission lines from an AGN, e.g. Ly, C IV 1549, and their width ranges from 1200 to 1700 km/s, typical of narrow-line or type 2 AGN. The optical spectrum of SW104407 (=0.555) is dominated by stellar light typical of a post-starburst galaxy (Balmer absorption line) and high-ionization narrow emission lines, [Ne V] 3426, [Ne III] 3869, from the AGN. Two sources, SW104353 (=0.563) and SW104458 (=1.52), show only one emission line, [O II] 3727, consistent with emission from new-born stars. No AGN signatures are observed, but the optical spectra are characterized by low signal-to-noise. The spectrum of SW104504 (=0.214) shows broad Balmer emission lines, H, H, and the [O III] 5007 forbidden line, typical of a starburst galaxy.
3.2.1 X-ray properties of the IR-selected obscured AGN candidates
A small fraction, 41 sources, corresponding to 34% of the IR-selected obscured AGN candidates are also X-ray detected. Five of these 41 X-ray sources have multiple IR counterparts. However, in all five cases the matched source is at less than 1″ from the X-ray source with a probability of random association 1.3%, and the neighbour sources are more than 2″ distant. Therefore, we consider all these associations reliable. The 41 X-ray sources show all types of optical-IR SEDs, except class VI. Their X-ray spectra (see Table 5) show a wide range of hardness ratios, from 0.87 to 0.90, with a median value of 0.26. Assuming our redshift estimates to derive the intrinsic column density and a photon index =1.7, 26 (63%) sources have column densities larger than 1022 cm-2 and of these, 12 have 1023 . Only two sources are also present in the X-ray selected sample of Compton-thick (1024 ) AGN, SWIRE_J104409.95+585224.8 (SW104409 hereafter) and SWIRE_J104406.30+583954.1 (SW104406 hereafter).
3.2.2 Optical X-ray flux
The optical and broad-band (0.3-8 keV) X-ray fluxes of all of the X-ray sources in the Chandra/SWIRE field and of the IR-selected obscured AGN candidates are compared in the top panel of Figure 4 where the X-ray sample is shown as black open circles and the IR-selected sample as full circles. We use the full band flux to minimize the uncertainty associated with the factors used to convert counts to flux. The distribution of -band fluxes for the IR-selected sample is shown in the bottom panel of Figure 4. The sample of IR-selected obscured AGN candidates is shown as full circles of different colors according to their classification (I in red, II in blue, III in purple, IV in magenta, V in orange and VI in green). The X-ray-selected sources are shown as cyan full circles. In case of no optical detection a left pointing arrow at the 5 -band value is shown and in case of no X-ray detection a downward arrow at 10-15 is shown. We also plot the expected observed fluxes of four AGN templates at various redshifts from 0.1 to 3. The AGN templates correspond to the median of a sample of optically selected quasars (Elvis et al., 1994): “Elvis QSO”, the Compton-thick BAL QSO/Seyfert 1 galaxy Mrk 231 (=0.042; Braito et al. (2004)), and the Compton-thick Seyfert 2 galaxies IRAS 192547245 South (I19254) (=0.0617; Berta et al. (2003); Braito et al. (2003)) and NGC 6240 (N6240) (=0.0244; Vignati et al. (1999); Iwasawa et al. (2001)). All templates other then the “Elvis QSO” are characterized by extreme (Compton-thick) absorption in the X-rays. The hatched area represents the locus of () between 0.1 and 10, which is traditionally considered the locus where “classical” AGN lie (Akiyama et al., 2003). Sources with ()10 are expected to be mostly obscured AGN at high- (Perola et al., 2004), while sources with ()0.1 are expected to be mostly star-forming galaxies whose X-ray emission is not powered by an AGN. However, this simple picture becomes more complex for fainter AGN (Comastri et al. , 2003).
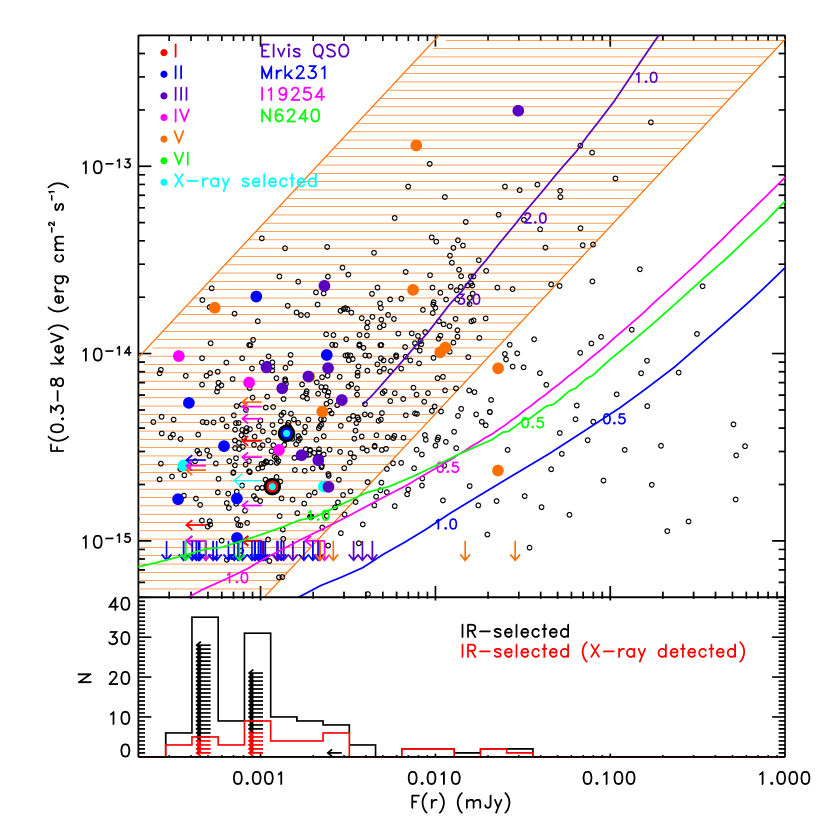
The three Compton-thick AGN templates are characterized by low X-ray over optical flux ratios (() 0.1) at low- and as the redshift increases, they move into the locus of “classical” AGN. Thus, extreme () ratios are not expected for local Compton-thick AGN even at high redshifts. Lower flux ratios (()=0.1–10), consistent with those of classical AGN, are also observed in the X-ray selected Compton-thick AGN sample. The majority (108) of the IR-selected obscured AGN candidates also has ()=0.1–10, 91 of which show () between 0.1 and 1 and 12 sources have ()0.1. It is clear that obscured AGN do not have unique () ratios. Therefore, a selection based on large (10) () values would miss a large fraction of obscured AGN.
3.2.3 Mid-Infrared X-ray flux
The observed mid-IR flux at 24m and the broad-band (0.3-8 keV) X-ray flux for the X-ray sample in the Chandra/SWIRE field are compared in the top panel of Figure 5 where the X-ray sample is shown as black open circles. Downward arrows indicate the full band (0.3-8 keV) flux upper limit of 1 and leftward arrows indicate the 230Jy 5 limit at 24m. The sample of X-ray and IR-selected obscured AGN shown in Figure 4 is also shown in Figure 5 as full circles or downward arrows in colors corresponding to different classes (from I to VI). The curves represent the expected observed fluxes of the four AGN templates shown in Figure 4 at various redshifts from 0.1 to 3. In the bottom panel of Figure 5, the distribution of 24µm fluxes of the IR-selected sample of obscured AGN candidates is shown.
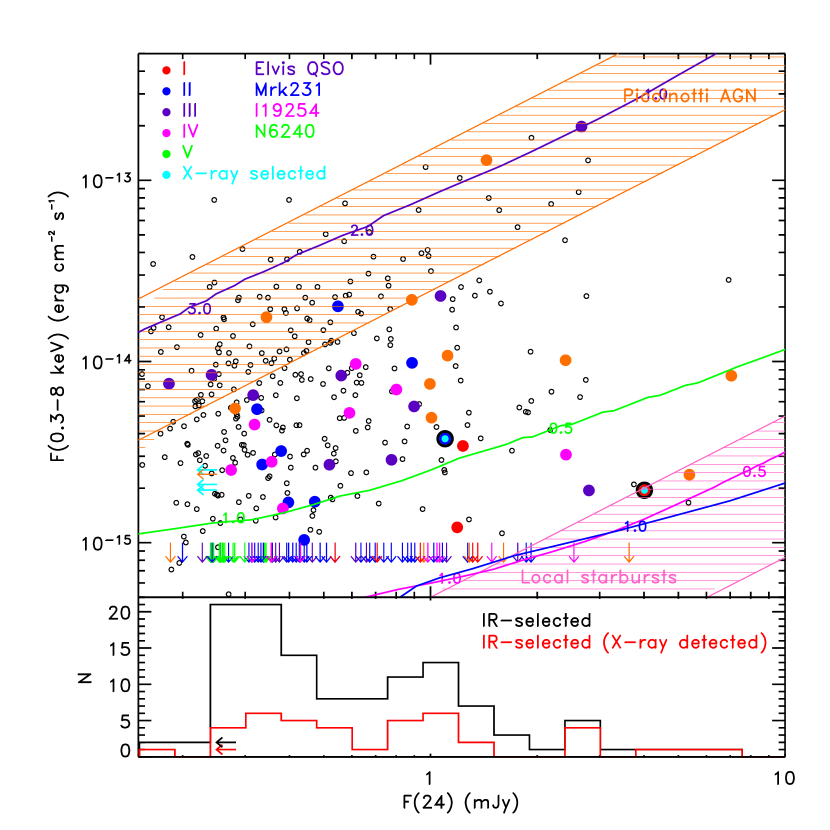
Hard X-rays to mid-IR flux ratios in the local Universe range from 10-3 for starburst galaxies to 1 for unobscured AGN (Alexander et al., 2001; Manners et al., 2004; Lutz et al., 2004). The locus occupied by hard X-ray-selected AGN from the Piccinotti et al. (1982) sample with detected mid-IR emission and 0.12 corresponds to the hatched area in orange (=0.19–1.17). The locus occupied by local starburst galaxies corresponds to the hatched pink area ( = 510-4 – 310-3). The two loci have been adapted from Alonso-Herrero et al. (2004) after correcting the X-ray flux from 2-10 keV to 0.3-8 keV assuming an absorbed power-law model with =1021 cm-2 and spectral index =1.7 for the Piccinotti’s sample and =2.0 for the starbursts. Sources with low or no absorption, such as the Elvis QSO template, show large X-ray over mid-IR flux ratios which are almost constant up to =4 (0.6–0.9). Sources characterized by large column-densities are characterized by a broader range of values, from 610-4 to 0.6 for 4. Their X-ray over mid-IR flux ratios increase at larger redshifts, moving them into the region occupied by unobscured AGN. As absorption increases the X-ray flux decreases, while the 24µm flux is only slightly affected. At higher-, however, the IR flux decreases more rapidly since the observed wavelengths correspond to shorter wavelengths in the rest-frame and the X-ray flux becomes less affected by obscuration as higher energy photons are collected, resulting in larger X-ray/24µm flux ratios (Alexander et al., 2001; Fadda et al., 2002; Manners et al., 2004).
All of the X-ray selected Compton-thick AGN show X-ray/mid-IR flux ratios lower than those of unobscured AGN (=0.001–0.03). Among the IR-selected obscured AGN candidates only 7 sources (SW104310, SW104321, SW104422, SW104532, SW104616, SW104725, SW104749) have 0.19 as the Piccinotti’s sample. Three of these 7 sources are obscured in the X-rays ( ). Thus, obscured AGN do not show unique values, however low values (0.2) are more likely. This results is in agreement with a recent study of X-ray and 24m-selected AGN, which shows that there is no correlation between and the amount of absorption in the X-ray or their optical properties (Rigby et al., 2005).
The range of IR and optical fluxes of the X-ray detected sources are very similar to the values observed in the entire IR-selected sample of obscured AGN candidates (see bottom panels of Figures 4 and 5). However, there is a higher fraction of faint sources in the whole sample compared to the X-ray detected sub-sample, and the majority of sources has smaller X-ray over 24µm flux ratios. Smaller ratios suggest that the fraction of obscured sources and/or the amount of absorption is higher in the non X-ray detected sub-sample. Since we can not quantify the amount of obscuration in the non X-ray detected sources, we assume that the distribution of absorption in the entire IR-selected sample is similar to that observed in the X-ray detected sub-sample (63% with 1022 , 29% with 1023 , and 5% with 1024 ). However, it is plausible that the estimated fractions of obscured sources are only lower limits to the real distribution for the reasons given above.
Although the ratios between the X-ray flux and the optical or the mid-IR flux are affected by absorption, they cannot be used as an effective method to select obscured AGN. As shown in the two previous sections and in previous works (Rigby et al. , 2004), these flux ratios also depend on the AGN luminosity, the host galaxy contribution and redshift, and, therefore, they are not unique for AGN with large amounts of absorption.
3.2.4 Radio properties of the IR-selected obscured AGN candidates
Although a detailed discussion on the radio properties of the AGN in this field and on the radio population in general will be presented in future works, here we give a brief summary of the radio detection rate of the IR-selected obscured AGN candidates. Half (60 sources) of the sample is detected in the radio (see Table 4). The fraction of radio sources per class, I, II, III, IV, V, and VI, is, respectively, 77, 50, 57, 43, 56 and 25%. The fraction of radio sources among the IR-selected obscured AGN candidates is much higher than the fraction of radio sources among either all IR sources or all X-ray sources. More specifically, within 12′ from the center of the radio field, there are 26 IR-selected obscured AGN and 24 (=92%) are radio sources. The fraction of radio sources in this area per class is 100% (2/2) of class I, 92% (11/12) of class II, 100% (6/6) of class III, 100% (1/1) of class IV, 75% (3/4) of class V, and 100% (1/1) of class V. Since large ratio powers are usually associated with the presence of an AGN, the high fraction of radio detection of this sample is consistent with the hypothesis that these sources are mainly powered by an AGN.
4 Photometric and spectroscopic data of SW104409 and SW104406
Having discussed some general properties of the X-ray and IR-selected obscured AGN candidates in the SWIRE/Chandra field, we now focus on the only two sources that are selected by both selection methods, SW104409 and SW104406. These two sources are the only ones among the X-ray sample of Compton-thick AGN for which a spectroscopic redshift is available, providing a confirmation on their Compton-tick nature. In this section we review the available multi-wavelength data for the two sources and in the next section we construct their SEDs, compare them to those of other Compton-thick AGN and present a simple model to explain the observed properties.
Optical and IR photometric fluxes as measured during the observations described in section 2.1 for SW104409 and SW104406 are listed in Table 6 and 7.
4.1 Optical Spectroscopy
Spectroscopic observations for SW104409 and SW104406 were carried out on 2005 March 03 and 04, respectively, with the Low Resolution Imaging Spectrometer (LIRS) (Oke et al., 1995) on the Keck I telescope. The observations were taken in multi-object mode and three equal integrations were performed for a total exposure time of 1.5 hour. The observations were taken with 15 wide slitlets aligned near the parallactic angle. The effective wavelength range of the blue spectrograph of the instrument is 35006700Å. A 300 lines/ grism with a blaze wavelength of 5000Å was used resulting in 1.43 Å dispersion. We used a HgAr lamp spectrum obtained at the same position angle immediately following the observations for wavelength calibration. The night was photometric with 13 seeing and the spectra were calibrated using the observations of the standard star G191B2B from Massey et al. (1988). The spectra of SW104409 and SW104406 are shown in Figures 6 and 7, respectively. The optical flux and spectral shape of SW104409 and SW104406 at the time of the Keck observations are consistent, within 1, with the earlier broad-band and photometric measurements.

The spectrum of SW104409 shows a narrow (FWHM = 132480 ) Ly emission line and two asymmetric emission lines with a broad blue-ward component, C IV 1549 and N V 1240. The spectrum of SW104406 shows several narrow emission lines, e.g.; Ly with FWHM = 136020 and C IV 1549 with FWHM = 148560 . The line identifications and parameters (FWHM, fluxes and the rest-frame equivalent width ()), calculated for single Gaussian fits using IRAF (Kriss , 1994), are listed in Table 8 and 9. In the case of SW104409, since the signal-to-noise is too low to constrain a Gaussian fit for the broad component of the asymmetric emission lines, the total flux and equivalent width were derived by integrating the total spectrum around the lines and subtracting the continuum (see Table 8). The estimated mean redshifts are for SW104409, and for SW104406.
According to the properties of its optical spectrum, SW104406 is a classical type 2 QSO, while SW104409 could be considered a peculiar type 2 QSO because of the superposition of weak asymmetric broad components on top of the stronger narrow emission lines.
A more detailed analysis and an in depth investigation of the spectrum of SW104409 is beyond the scope of this work. The blue-shifted broad components of the C IV 1549 and N V 1240 emission lines suggest the presence of highly ionized gas moving toward the observer as an outflow or wind from the accretion disk as observed in other quasars (Gallagher et al. , 2005). However, this interpretation is difficult to reconcile with a geometry in which the AGN is obscured.
4.2 X-ray Data and Spectral Analysis
Details (seq. N., OBSID and exposure time) on the X-ray observations of SW104409 and SW104406 are listed in Table 10. SW104409, located at an off-axis angle of 36 has 11 broad-band counts, only 2 of which fall in the soft band. SW104406, at an off-axis angle of 58, is brighter in the X-ray than SW104409 with 22 broad-band counts and 3 in the soft band. With so few counts, the error on the source’s hardness ratio is large and spectral modeling would not constrain any parameter. Therefore, in order to constrain the amount of absorption in these sources we applied the Bayesian method described in section 2.2 (van Dyk et al. , 2004). We derive an HR of 0.85 for SW104409 and of 0.61 for SW104406, which correspond to intrinsic column densities of 2.0 for SW104409 and 1.0 for SW104406. These extreme column densities indicate that both sources are borderline Compton-thick AGN. Alternative models, such as a reflection component due to ionized or neutral gas, can not be ruled out, but they would also indicate large column densities (1024). Assuming that the X-ray spectra of SW104409 and SW104406 are due to transmitted components through column densities of =21024 cm-2, and =11024 cm-2, respectively, then the absorption-corrected X-ray luminosities in the rest-frame, assuming a photon index =1.7, are 41045 and 51045 , respectively.
4.3 Radio Data
SW104409, located at 17′ from the center of the radio field, is unresolved, but clearly detected. Its radio flux, measured on an image convolved to 3″ to reduce instrumental effects this far off-axis, is 27315Jy. SW104406, located at the edge of the radio field (26′ off-axis), is not detected in the radio (there is only an apparent 2.4 detection), therefore we assume a 3 upper limit to its radio flux of 162Jy.
5 Spectral Energy Distributions of SW104409 and SW104406
In this section, we analyze the spectral energy distributions (SEDs) from X-ray to radio wavelengths of the two obscured quasars discussed above, SW104409 and SW104406. The SED shapes and luminosities are compared to those of known AGN: Elvis QSO template and the BAL QSO/Seyfert 1 galaxy Mrk 231. The SEDs are interpreted assuming the unification scenario for which the absorbing material is distributed around the central source in a toroidal shape. However, alternative models can not be ruled out by the available data.
5.1 SW104409
The SED of SW104409, from X-ray to radio wavelengths, is shown in Figure 8 and compared to the SED of Mrk 231. SW104409 is characterized by a blue optical spectrum up to 2200Å in the source rest-frame, followed by a rapid rise at longer wavelengths with an observed -=4.13 (Vega), fitting the conventional definition of extremely red object (ERO; ) (Elston et al. , 1988). The U-band drop-out is probably due to intergalactic medium (IGM) attenuation (Madau , 1995), as expected for such a high redshift object. The comparison with Mrk 231 shows how extreme the IR SED of SW104409 is (=94 compared to 9.7 for Mrk 231). However, the mid-IR (10µm) over radio flux ratios are very similar and the mid-IR (10µm) over X-ray flux is only 3 times higher in SW104409 than in Mrk 231.


The X-ray and near-IR properties of SW104409 indicate that the source is heavily obscured. However, the observed optical continuum is blue and the spectrum shows emission lines with broad components. A plausible explanation for the observed optical spectrum could be scattering. The scattered light preserves the spectral shape of the intrinsic component, but its flux corresponds to a fraction of the primary component which depends on the covering factor of the scattering medium (Smith et al. , 2003). The fraction of scattered radiation can be estimated by comparing the observed and the intrinsic (unabsorbed) optical flux. Since the observed optical spectrum is similar to that observed in optically selected quasars and scattering does not modify the spectral shape of the intrinsic spectrum, we estimated the intrinsic optical flux by assuming that the intrinsic, before absorption, SED of SW104409 is similar to that of an unobscured QSO normalized at the observed mid-IR observed flux. In Figure 9, we show the SED of SW104409 and an unobscured QSO template in three cases: 1) normalized at the observed 24µm flux of SW104409 to represent the intrinsic, before absorption, emission of SW104409; 2) scaled to match the observed optical data, to represent the scattered component, and 3) reddened by an extinction AV=4 mag (E(BV)1). Reddening was applied as prescribed in Calzetti & Heckman (1999) assuming a foreground screen of dust at the redshift of the source. According to this scenario, SW104409 resembles an optically selected quasar whose light is reddened by an extinction AV=4 mag and, therefore, completely suppressed at the observed optical wavelengths (ultraviolet in the rest-frame) and reddened in the near-IR (optical in the rest-frame). Assuming that the observed optical blue spectrum is due to scattering, the scattered fraction corresponds to 0.6% of the intrinsic optical emission.

Note that throughout this work, we apply reddening as prescribed in Calzetti & Heckman (1999). We also investigated the use of the Small Magellanic Cloud (SMC) extinction curve (Prevot et al. , 1984; Bouchet et al. , 1985) that well reproduces the optical spectra of dust reddened quasars in SDSS (Richards et al., 2003). The two prescriptions produce similar reddening at 5000Å, but the SMC law produces redder spectra at shorter wavelengths for the same amount of extinction.
Different geometries of the obscuring material were investigated by comparing the observed SED of SW104409 with predictions from radiative transfer models within the AGN unification scenarios. The models assume that the absorbing material is distributed in a toroidal shape around the central heating source. Two geometries were taken into account, flared and tapered disks, as described in detail in Efstathiou & Rowan-Robinson (1995). In flared disks the thickness of the disk increases linearly with distance from the central source. In tapered disks the thickness of the disk in the inner part also increases linearly with distance from the source but stays constant in the outer part. We find that a good fit to the rest-frame ultraviolet to mid-IR spectrum of SW104409 can be obtained with a tapered disk with an opening angle of 60 degrees. The predicted SED for this model is shown in Figure 10 and compared to the observed SED of SW104409. The predicted inclination of the line of sight with respect to the disk axis (61 degrees) implies that it is almost grazing the boundaries of the torus. The line of sight optical depth at 1000 Å rest-frame through the torus is 700 which corresponds to an optical depth =129 or AV=140. The best-fit model also assumes that the emission from the torus suffers additional extinction of 0.5 magnitudes by dust which is located at some distance from the nucleus; e.g. in the host galaxy. The predicted optical emission, which well agrees with the observed optical data, is produced by light scattered by the torus.

Due to the high optical depth to the central source, the optical emission must be scattered light. According to this model, scattering takes place in the inner walls of the disk and its surface, therefore, in order to observe scattered light the inclination must be slightly larger than the opening angle of the disk. In case of larger inclination angles, the disk would obscure the scattered light. For inclination angles smaller than the opening angle, the scattered light would still be visible, however this geometry would be inconsistent with the obscured nature of this source. The similarity between the inclination and opening angles is also suggested by the observed 1–10µm SED, characteristic of emission from hot dust. Since the scattering region and the hot dust region are almost co-spatial, the inclination must be similar to the opening angle, otherwise the disk would obscure the emission from this region. An alternative to this model is scattering produced by electrons or dust in the opening cone of the accretion disk, instead than from the walls of the disk. In this case the similarity between the opening and inclination angles is not required, however it would still be required to explain the shape of the near- to mid-IR continuum. This model is consistent with the simple scenario described above. The large difference in the amount of extinction is likely due to the different assumptions made for the dust distribution. In the simple model of scattering+obscured QSO, we assume a foreground screen of dust absorbing the emitted radiation. This assumption does not take into account re-emission from dust and produces an underestimation of the dust opacity. Radiative transfer models are more accurate in estimating the dust opacity since they take into account the transmission of the intrinsic radiation through the dusty material. According to the results from the radiative transfer model and assuming a Galactic dust to gas ratio, the estimated gas column density surrounding the central regions is 2.61023 , consistent with what is observed in the X-ray. However, since the X-ray emission is produced in the nucleus and the optical and near-IR radiation are emitted in the outer regions, the absorbing gas intercepted by the X-ray photons is expected to be closer to the disk plane and have a larger column density than the material intercepted by the optical/near-IR radiation. In spite of its simplicity, the proposed picture reconciles the multiwavelength observations of SW104409 and agrees well with the unification model.
5.2 SW104406
The spectral energy distribution (SED) of SW104406 is shown in Figure 11. The optical spectrum is characterized by a blue continuum as in the case of SW104409 with no indication for intrinsic reddening. As in the case of SW104409, the optical data are characterized by a U-band drop-out which is probably caused by IGM attenuation. SW104406 also fits within the conventional definition of EROs with an observed -=4.82 (Vega). Its SED is very similar to the SED of Mrk 231 after applying an additional extinction of AV=0.2 as shown in Figure 12. The optical spectrum can be fitted with this reddened template and an additional component, as scattered light, is not required by the data. The X-ray over IR ratio of SW104406 is about 10 times higher than for Mrk 231, but the X-ray spectrum is similarly hard or even harder. Contamination from stellar light emission from the host galaxy or a starburst, which would appear as a broad bump with a peak at 1.6µm in not observed.

In summary, both sources show SEDs where the AGN dominates at all observed wavelengths and any contribution from other energy source is negligible. The observed SED are both consistent with a scenario in which the optical and near-IR sources are obscured. In the X-rays, the observed spectrum is likely due to the transmitted direct component seen through Compton-thick matter.
6 Luminosity, Black-Hole Mass and Accretion Rate of SW104409 and SW104406
The luminosities as a function of wavelength of SW104406 and SW104409 are shown in Figures 12 and 13, respectively. The luminosity distribution of the unobscured quasar template, “Elvis QSO” (Elvis et al., 1994) normalized to the mid-IR flux of the two quasars is also shown for comparison. The template is also shown after applying enough extinction to reproduce the red IR SEDs of SW104409 and SW104406.


Due to the lack of data at 7 we cannot directly measure the total IR luminosity, but we can derive it making some assumptions about the SED shape. Assuming the model shown in Figure 9 for SW104409 and a reddened (A=0.2) Mrk 231 for SW104406 at , the IR luminosities, L(3-1000 ), are 3.4 (=8.8 L⊙) and 1.2 (=3.1 L⊙), respectively. SW104409 is a hyper-luminous IR galaxy (HYLIRG) and SW104406 an ultra-luminous IR galaxy (ULIRG) (Sanders & Mirabel, 1996). The integrated luminosities in different wavelength ranges, as well as the bolometric luminosity of both sources are listed in Table 11. The radio luminosity is derived assuming the radio spectral index typically observed in AGN, (Condon, 1988), where . The implied rest-frame 1.4 GHz radio luminosity density of SW104409 is , and less than 3.0 for SW104406. These high radio powers are a signature of the presence of an AGN.
The bolometric luminosity can be derived by adding the absorption-corrected X-ray luminosity, the estimated radio luminosity (only in the case of SW104409) and the optical-IR luminosity. The derived bolometric luminosities are 3.9 (1.0 L⊙) for SW104409 and 1.9 (4.6 L⊙) for SW104406. Because of the uncertainty associated with the lack of data above =7m, we derived a lower limit to the bolometric luminosity by replacing the optical-IR luminosity with . The obtained values are a factor of 2 lower than the estimates obtained by extrapolating the model to 10µm (see values in Table 11). The absorption-corrected X-ray luminosities of SW104409 and SW104406 correspond, respectively, to 1% and 30% of their bolometric luminosity.
Assuming that the AGN is the main source of the observed bolometric luminosity and that it is accreting at the Eddington limit (), the estimated black-hole mass for SW104409 and SW104406 is M⊙ and 1.4 M⊙, respectively, or 1.2 M⊙ and 6.6 M⊙, if we do not include the energy emitted at 10µm in the estimate of the AGN bolometric luminosity. If we assume an accretion efficiency of 10%, the derived accretion rates are 68 M⊙ yr-1 for SW104409 and 3.4 M⊙ yr-1 for SW104406, or 28 M⊙ yr-1 for SW104409 and 1.5 M⊙ yr-1 for SW104406 if we do not include the energy emitted at 10µm in the estimate of the AGN bolometric luminosity. The black-hole mass of SW104409 is comparable to the highest measured values in the local Universe, i.e. M87 (Ford et al., 1994) and Cyg A (Tadhunter et al., 2003) having M3 M⊙. Its accretion rate is also among the highest observed in quasars at (McLure & Dunlop , 2004). SW104406 is also characterized by a large black-hole mass and accretion rate, but it is not as extreme as SW104409. Since most of the quasars accrete below their Eddington limit (McLure & Dunlop , 2004), it would be more realistic to assume a lower Eddington ratio, however, this would imply even higher black hole masses.
7 Comparison with other Compton-thick AGN at 2
Only a few Compton-thick quasars at 2 are currently known. Here, we compare their properties with those of SW104409 and SW104406 and investigate whether they represent the same population or if the different selection methods are finding objects with different properties. The largest and probably best sampled sample of Compton-thick AGN currently known contains 4 sources (Alexander et al., 2005a, b). These sources were drawn from an X-ray detected sub-millimeter selected sample in a 0.12 field. Optical data from HST, IR data from Spitzer, radio data and optical high-resolution spectra are available for all of the sources. Spectroscopic redshifts range from 2 to 2.5 and broad-band (0.5-8 keV) X-ray fluxes range from 0.7 to 1.310-15 . These sources host both an AGN and a powerful starburst, and their optical-near-IR SEDs are dominated by stellar light (Borys et al., 2005). The optical spectra of all sources are also dominated by a starburst component (Chapman et al. , 2005). The AGN bolometric luminosities, estimated from the observed X-ray flux after correcting it for absorption, range from 2.2 to 4.4 L⊙, the derived black-hole masses range from 0.6 to 1.6 M⊙ and the accretion rates vary from 0.13 to 0.35 M⊙/. The main differences between this sample and the two obscured quasars SW1044090 and SW104406 is in the AGN bolometric luminosity, and thus in the accretion rates and the black-hole masses which are, on average, two order of magnitudes lower. Another important difference is in the presence of a dominant starburst component which is absent or negligible in SW104409 and SW104406. It is clear that the two quasars presented in this work and these AGN/sub-millimeter galaxies show some major differences and might be very different objects. However, before deriving any conclusions on the differences between these two samples, we should evaluate how the different methods applied to estimate the AGN bolometric luminosity affect these results.
We tried to reproduce Alexander et al. (2005b)’s estimates using their energy ranges and found that their correction for absorption to the rest-frame X-ray luminosity is about 4 times smaller than ours for =1024. The most likely explanation for the observed difference is the difference in the assumed X-ray model used to derive the K-correction. Alexander et al. (2005a, b) adopt a model which includes an absorbed power-law component with =1.8, a neutral reflection component, a scattered component of ionized gas, and a Fe K mission line at 6.4 keV. We also notice a discrepancy in the column density estimates, their values being on average 2.5 times larger than what we would predict with our method. Although this would yield larger luminosities, their correction factor due to the different spectral model is much smaller than ours, thus their absorption-corrected rest-frame luminosities are lower that what we would estimate. If we apply our method to their sample, the derived absorption-corrected rest-frame X-ray luminosities are, on average, higher by a factor of 8 (from 3 to 12.5 times higher). Their smaller X-ray luminosities imply smaller AGN bolometric luminosities, black-hole masses and accretion rates by the same factors. A third difference between our methods is in the derivation of bolometric luminosity. They assume a constant factor between the absorption-corrected rest-frame X-ray luminosity and the bolometric luminosity of 6%, while we add the luminosity measured throughout the whole spectrum (30% for SW104409 and 1% for SW104406; see Section 6). Even after correcting by the factors described above, the differences in AGN luminosity, SMBH mass and accretion rate between the two quasars presented in this work and the sample in Alexander et al. (2005a, b) are still significant, more than one order of magnitude compared to almost two order of magnitude initially measured. Thus, we conclude that the four sources in Alexander et al. (2005b) and our two quasars are different.
Other examples of Compton-thick AGN at high- are the type 2 quasars, CXO-52 (=3.288; Stern et al. (2002)), CDFS-202 (=3.700; Norman et al. (2001)) and CDFS-263 (=3.660; Mainieri et al. (2005)). The former two sources show similar characteristics to SW104409 and SW104406. The X-ray selected type 2 QSO detected at sub-millimeter wavelengths, CDFS-263, is instead more similar to the sub-millimeter selected AGN discussed above. The SEDs of these quasars at 2.5µm are not currently available, but at shorter wavelengths CXO-52 and CDFS-202 show very similar SEDs to those of SW104409 and SW104406 with AGN-dominated optical spectra and red optical-near-IR colors. Assuming that the absorption-corrected X-ray luminosity corresponds to 10% of the AGN bolometric luminosity (Elvis et al., 1994), we derive a bolometric luminosity, , of 3.31045 for CXO-52 and of 21046 for CDFS-202. Assuming accretion at the Eddington limit, the black-hole masses are 2.5107 M⊙ and 1.1108 M⊙ respectively. These values are also lower than what we derive for SW104409 and similar to those derived for SW104406, but higher that those measured in (Alexander et al., 2005a)’s sub-millimeter selected Compton-thick AGN. In CXO-52 and CDFS-202, as in SW104409 and SW104406, the AGN dominates over the host galaxy and the associated luminosity and SMBH mass are one order of magnitude higher than observed in sub-millimeter selected Compton-thick AGN.
The two Compton-thick AGN discussed in this work also differ from a sample of high-, heavily obscured, and luminous AGN candidates selected at IR and radio wavelength (Martínez-Sansigre et al., 2005). We applied the same selection criteria to the complete IR and X-ray samples, to the IR-selected obscured AGN candidates and to the X-ray selected Compton-thick AGN in Figure 14. Only one source among the IR-selected obscured AGN candidates satisfies their selection criteria, SWIRE_J104641.38+585213.9 and none of the X-ray selected Compton-thick AGN. Although the two Compton-thick AGN, SW104409 and SW104406, are luminous and obscured AGN at 2 (see section 4), they do not pass either the 3.6m or the radio limit (see large black circles in Figure 14) required by Martínez-Sansigre et al. (2005). In the entire field only 6 sources satisfy their selection criteria, of which 2 show power-law like IR SEDs and are also detected in the X-ray. One is SWIRE_J104641.38+585213.9 which we classify as class III source (see table 4), the other source is characterized by an SED consistent with an unobscured QSO. The remaining 4 sources are characterized by SEDs more similar to those in class IV. Although both selection methods are based on IR-colors derived from Spitzer there is little overlap among the two samples.
A compilation of all heavily obscured AGN selected by different methods and a systematic analysis of their multi-wavelength properties is necessary to understand the differences among these sources and their origin, e.g. a different evolutionary stage, SMBH mass, accretion rate or environment.
8 Statistical predictions for Compton-thick AGN
The two selection methods described in Sections 3.1 and 3.2 were defined for samples of obscured AGN based on their X-ray and optical-IR properties, respectively. The X-ray selected sample includes X-ray detected AGN with hard X-ray spectra and estimated column densities 1024 (5 sources). The IR-selected sample contains AGN with red optical-IR colors and whose emission dominates in the near- and mid-IR over the host galaxy light (120 sources). The first selection method is biased against Compton-thick AGN whose primary X-ray radiation is completely absorbed in the observed energy range, i.e. sources at low- or with column densities 1025 , and against sources that are fainter than 10-15 at 0.3-8 keV. The second method is biased against AGN that are too faint to be detected in 3 IR bands at our sensitivity limits or whose host galaxy is brighter than the AGN in the optical-IR wavelength range. Because of these selection effects, we can only estimate a lower limit to the surface density of IR detected Compton-thick AGN in the Chandra/SWIRE field.
In the sub-sample of 41 IR-selected obscured AGN candidates which are detected in the X-rays, only two sources, 5%, are confirmed Compton-thick AGN, SW104409 and SW104406. If we assume that this fraction does not depend on the X-ray flux and is the same for the entire IR selected sample of obscured AGN candidates (but see discussion in Section 3.2.3), we estimate about 6 sources (5% of 120 sources) to be Compton-thick AGN. Since only two out of five X-ray selected Compton-thick AGN are also selected by the IR-selected criteria, we assume that our IR selection identifies only 40% (2 out of 5) of all Compton-thick AGN in the field. Thus, the estimated total number of Compton-thick AGN in the field is about 15 (6/0.4) or 25 sources deg-2. The estimated number of sources (15) should be considered a lower limit to the total number of Compton-thick AGN detected in the IR at our sensitivity limits in the Chandra/SWIRE field. Due to the lack of X-ray data for most of the sources, the identification of these 15 Compton-thick AGN is not possible because of lack of constraints on their column densities. The only exceptions are the 5 X-ray selected Compton-thick AGN presented in Section 3.1. The fraction of Compton-thick AGN detected in the X-ray at our depth (F(0.3-8 keV)10-15) is 33% (5 out of 15). This fraction is consistent with the value estimated by Treister et al. (2004) of 30% of all Compton-thick AGN detected at the X-ray limit of the Chandra deep surveys.
We compared our results with the number of obscured AGN detected in the IR and in the X-rays predicted by various models (Silva, Maiolino & Granato , 2004; Treister & Urry, 2005; Xu et al. , 2003; Polletta et al., 2003). Since our selection is very similar to a 24µm flux selection, we compared our results with those predicted for AGN with a 24µm flux greater than our 5 limit, 230Jy. However, our selection is more restricted due to the additional requirements on the properties of the IR SED and, therefore, we expect our numbers to be lower than those expected from a limited-flux sample of AGN. Silva, Maiolino & Granato (2004) predicts about 670 AGN deg-2, of which 500 are obscured (1022) (obscured:unobscured=2.9:1) and about 300 are Compton-thick. Treister & Urry (2005) predicts about 1000 AGN deg-2, of which 765 are obscured (1022) (obscured:unobscured=3:1) and no prediction for Compton-thick AGN is given. Xu et al. (2003) and Polletta et al. (2003) predict about 1100 AGN deg-2, of which 810 are obscured (1022) (obscured:unobscured=2.8:1). Although these models are different and have not been fully tested with respect to the available IR and X-ray observables, they are all consistent with a surface density of about 700–1000 AGN deg-2, a ratio between obscured and unobscured AGN of 3:1, and about 300 Compton-thick AGN. Our IR selection of AGN yields 120 (200 deg-2) obscured AGN candidates and 61 (100 deg-2) unobscured AGN candidates, corresponding to only about 20% of the expected number of AGN, and to an obscured to unobscured ratio of 2:1. The total number of AGN and the ratio between obscured and unobscured AGN would likely increase if the selection was not limited to sources with AGN-dominated and red IR SEDs. Our lower limit to the surface density of Compton-thick AGN is less than 10% the expected value, indicating that even in the mid-IR a large fraction of these sources are elusive.
9 Conclusions
Theoretical models, simulations and indirect observations predict the presence of a large population of highly obscured luminous AGN at moderate and high redshifts. The quest for these objects has been hindered by the difficulty of detecting and identifying them and, thus, very few examples are currently known. In this work, we show how the combined high sensitivity and spatial resolution of the Spitzer Space Telescope and of the Chandra X-ray Observatory are overcoming these difficulties, offering the capability of detecting and identifying heavily obscured AGN up to high redshifts, providing constraints on their surface density and characterizing their properties.
Using the dataset in the Chandra/SWIRE field (0.6 deg2 in the Lockman Hole), we conducted a search for Compton-thick AGN. We selected, independently, two samples of Compton-thick AGN candidates based on their X-ray spectral properties and optical-IR SED. The X-ray and IR selected samples contain, respectively, 5 and 120 sources. Based on the properties of the X-ray selected Compton-thick AGN, we estimate that only 40% of the population of heavily obscured AGN shows distinct AGN signatures in their optical-IR SEDs, the rest being dominated by the host-galaxy emission. The number of Compton-thick AGN detectable in the Chandra/SWIRE field is of at least 25 sources deg-2 and only 33% of them are detected in the X-ray down to a flux limit of 10-15. The X-ray over optical flux ratios of the selected obscured AGN cover a similar range as the rest of the X-ray sample and well overlap with those observed for “classical” AGN, indicating that searches for heavily obscured AGN among X-ray sources with extreme X-ray over optical flux ratios might miss a large fraction of these sources.
The complete sample of AGN selected on the basis of a red power-law like IR SED contains 181 sources, of which 61 show SEDs similar to those of unobscured AGN, and 120 are obscured AGN candidates. The complete sample corresponds to only about 20% of the total number of AGN expected to be detected in the mid-IR at our sensitivity. The observed ratio between obscured and unobscured AGN is 2:1, still lower than the models predictions, 3:1. The estimated surface density of Compton-thick AGN is only 10% the expected value. These results suggest that even in the mid-IR, heavily obscured AGN are elusive.
Optical spectroscopy of two obscured AGN candidates confirmed that they are high redshift, SW104409 at =2.54 and SW104406 at =2.43, Compton-thick QSOs. These sources, characterized by type 2 AGN spectra, very red optical-IR SEDs and high X-ray luminosities ( ), have properties (SEDs, luminosities and SMBH masses) similar to those observed in the high- Compton-thick quasars CXO-52 (=3.288; Stern et al. (2002)), and CDFS-202 (=3.700; Norman et al. (2001)). However, they differ from sub-millimeter selected Compton-thick AGN (Alexander et al., 2005b) where emission from a starburst dominates at most wavelengths and black-hole masses and accretion rates are one order of magnitude lower. SW104409 represents the most luminous ( L⊙) Compton-thick QSOs at high- currently known with a SMBH mass comparable to the most massive local SMBH (3M⊙). Such a rare object can be found when large volumes are sampled as in the SWIRE/Chandra field (0.6).
References
- Akiyama et al. (2003) Akiyama, M., Ueda, Y., Ohta, K., Takahashi, T., & Yamada, T. 2003, ApJS, 148, 275
- Alexander et al. (2001) Alexander, D. M., La Franca, F., Fiore, F., Barcons, X. et al., 2001, ApJ, 554, 18
- Alexander et al. (2005a) Alexander, D. M., Bauer, F. E., Chapman, S. C., Smail I., Blain, A. W., &, Ivison, R. J. 2005a, ApJ, 632, 736
- Alexander et al. (2005b) Alexander, D. M., Smail, I., Bauer, F. E., Chapman, S. C. et al. 2005b, Nature, 434, 738
- Alonso-Herrero et al. (2004) Alonso-Herrero, A., Pérez-González, P. G., Rigby, J., Rieke, G. H et al. 2004, ApJS, 154, 155
- Alonso-Herrero et al. (2005) Alonso-Herrero, A., Pérez-González, P. G., Alexander, D. M., Rieke, G. H et al. 2005, ApJ accepted, (astro-ph/0511507)
- Antonucci (1993) Antonucci, R., 1993, ARA&A, 31, 473
- Babbedge (2004a) Babbedge, T.S.R. 2004a, PhD Thesis, Imperial College, London, U.K.
- Babbedge (2004b) Babbedge, T.S.R. et al. 2004b, MNRAS, 353, 654
- Barger et al. (2002) Barger, A. et al. 2002, ApJ, 124, 1839
- Barger et al. (2005) Barger, A. J., Cowie, L. L., Mushotzky, R. F., Yang, Y., Wang, W.-H., Steffen, A. T. & Capak, P. 2005, AJ, 129, 578
- Bassani et al. (1999) Bassani, L., Dadina, M., Maiolino, R., Salvati, M., Risaliti, G., Della Ceca, R., Matt, G. & Zamorani, G. 1999, ApJS, 121, 473
- Berta et al. (2003) Berta, S., Fritz, J., Franceschini, A., Bressan, A., & Pernechele, C. 2003, A&A, 403, 199
- Bertin & Arnouts (1996) Bertin, E., & Arnouts, S. 1996, A&AS, 117, 393
- Bolzonella et al. (2000) Bolzonella M., Miralles J.-M. & Pelló R. 2000, A&A, 363, 476
- Borys et al. (2005) Borys, C., Smail, I., Chapman, S. C., Blain, A. W., Alexander, D. M., & Ivison, R.J. 2005, ApJaccepted (astro-ph/0507610)
- Bouchet et al. (1985) Bouchet, P., Lequeux, J., Maurice, E., Prevot, L., & Prevot-Burnichon, M. L. 1985, A&A, 149, 330
- Braito et al. (2003) Braito, V., Franceschini, A., Della Ceca, R., Severgnini, P. et al. 2003, A&A, 398, 107
- Braito et al. (2004) Braito, V., Della Ceca, R., Piconcelli, E., Severgnini, P. et al. 2004, A&A, 420, 79
- Calzetti & Heckman (1999) Calzetti, D. & Heckman, T. M. 1999, ApJ, 519, 27
- Cattaneo et al. (2005) Cattaneo, A., Blaizot, J., Devriendt, J. & Guiderdoni, B. 2005, MNRAS, 364, 407
- Chapman et al. (2005) Chapman, S. C., Blain, A. W., Smail, I., & Ivison, R. J. 2005, ApJ, 622, 772
- Comastri et al. (1995) Comastri, A., Setti, G., et al., 1995, A&A, 296, 1
- Comastri et al. (2003) Comastri, A., Brusa, M., & Mignoli, M. 2003, Astron. Nach., 324, 28
- Comastri (2004) Comastri, A., 2004 in “Supermassive Black Holes in the Distant Universe”, ed. A. J. Barger, Kluwer Academic Press (astro-ph/0403693)
- Condon (1988) Condon, J.J. 1988, in “Galactic and Extragalactic Radio Astronomy”, Second edition, eds. G. L. Verschuur and K. I. Kellermann (Springer-Verlag), 641
- Cutri et al. (2002) Cutri, R. M., Nelson, B. O., Francis, P. J., & Smith, P. S. 2002, Proceedings of IAU Colloquium 184, ASP Conference Proceedings, 284, 127
- Cutri et al. (2003) Cutri, R. M., et al. 2003, Explanatory Supplement to the 2MASS All Sky Data Release (Pasadena: Caltech)
- Della Ceca et al. (2004) Della Ceca, R., Maccacaro, T., et al., 2004, A&A, 428, 383
- De Luca & Molendi (2004) De Luca, A., Molendi, S., 2004, A&A, 419, 837
- Dickey & Lockman (1990) Dickey, J. M. & Lockman, F.J. 1990, ARA&A, 28, 215
- Di Matteo et al. (2005) Di Matteo, T., Springel, V., & Hernquist, L. 2005, Nature, 433, 604
- Donley et al. (2005) Donley, J. L., Rieke, G. H., Rigby, J. R., Pérez-González, P. G. 2005, ApJ, 634, 169
- Dwelly et al. (2005) Dwelly, T., Page, M. J., Loaring, N. S., Mason, K. O. et al. 2005, MNRAS, 360, 1426
- Efstathiou & Rowan-Robinson (1995) Efstathiou, A., & Rowan-Robinson, M. 1995, MNRAS, 273, 649
- Elston et al. (1988) Elston, R., Rieke, G. H. and Rieke, M. J. 1988, ApJ, 331, 77
- Elvis et al. (1994) Elvis, M., Wilkes, B. J., McDowell, J. C. et al. 1994, ApJS, 95, 1
- Fabian (1999) Fabian, A. C. 1999, MNRAS, 308, L39
- Fadda et al. (2002) Fadda, D., Flores, H., Hasinger, G., Franceschini, A. et al. 2002, A&A, 383, 838
- Fazio et al. (2004) Fazio, G. G., et al. 2004, ApJS, 154, 10
- Fiore et al. (2003) Fiore, F. et al. 2003, A&A, 409, 79
- Ford et al. (1994) Ford, H.C. et al. 2004, 1994, ApJ, 435, L27
- Franceschini et al. (2005) Franceschini, A., Manners,J., Polletta, M. et al. 2005, AJ, 129, 2074
- Freeman et al. (2001) Freeman, P. E., Doe, S., Siemiginowska, A. 2001, SPIE Proceedings, 4477, 76
- Freeman et al. (2002) Freeman, P. E., Kashyap, V., Rosner R., & Lamb, D. Q. 2002, ApJS, 138, 185
- Gallagher et al. (2005) Gallagher, S. C., Richards, G. T., Hall, P. B., Brandt, W. N., Schneider, D. P., Vanden Berk, D. E. 2005, AJ, 129, 567
- Granato et al. (2004) Granato, G., De Zotti, G., Silva, L., Bressan, A., Danese, L. et al. 2004, ApJ, 600, 580
- Hao et al. (2005) Hao, L. et al. 2005, ApJ, 625, 75
- Hatziminaoglou et al. (2005) Hatziminaoglou, E., Perez-Fournon, I., Polletta M. et al. 2005, AJ, 129, 1198
- Houck et al. (2005) Houck, J. R., et al. 2005,ApJ, 622, 105
- Hopkins et al. (2005) Hopkins, P. F.,Hernquist, L., Martini, P., Cox, T. J., Robertson, B., Di Matteo, T., & Springel, V. 2005, ApJ, 625, 71
- Iwasawa et al. (2001) Iwasawa, K., Matt, G., Guainazzi, M., & Fabian, A.C. 2001, MNRAS, 326, 894
- Kim et al. (2004) Kim, D-W., et al., 2004, ApJS, 150, 19
- Kriss (1994) Kriss, G. A. 1994, ASP Conference Series, 61, 437, eds.: D.R. Crabtree, R.J. Hanisch, J. Barnes
- Krolik (1999) Krolik, J. H. 1999, Active Galactic Nuclei: From the Central Black Hole to the Galactic Environment, Princeton University Press
- La Franca et al. (2005) La Franca, F. et al. 2005, ApJ, 635
- Lacy et al. (2004) Lacy, M. et al. 2004, ApJS, 154, 166
- Longair et al. (1992) Longair, M. S. 1992, High Energy Astrophysics (Cambridge Univ. Press), Vol. 2
- Lonsdale et al. (2003) Lonsdale, C. J. et al. 2003, PASP, 115, 897
- Lonsdale et al. (2004) Lonsdale, C. J., Polletta, M., Surace, J., D., Fang, F., et al. 2004, ApJS, 154, 54
- Lutz et al. (2004) Lutz, D., Maiolino, R., Spoon, H. W. W., & Moorwood, A. F. M. 2004, A&A, 418,465
- Madau, Ghisellini, & Fabian (1994) Madau, P., Ghisellini, G., & Fabian, A. C. 1994, MNRAS, 270, L17
- Madau (1995) Madau, P. 1995, ApJ, 441, 18
- Mainieri et al. (2002) Mainieri, V., Bergeron, J., et al., 2002, A&A, 393, 425
- Mainieri et al. (2005) Mainieri, V. et al. 2005, MNRAS, 356, 1571
- Maiolino & Rieke (1995) Maiolino, R., Rieke, G. H., 1995, ApJ, 454, 95
- Maiolino et al. (2003) Maiolino, R., Comastri, A., Gilli, R., Nagar, N. M. et al. 2003, MNRAS, 344, L59
- Manners et al. (2004) Manners, J. C., Serjeant, S., Bottinelli, S., Vaccari, M. et al. 2004, MNRAS, 355, 97
- Martínez-Sansigre et al. (2005) Martínez-Sansigre, A. et al. 2005, Nature, in press (astro-ph/0505486)
- Massey et al. (1988) Massey, P., Strobel, K., Barnes, J.V., & Anderson, E. 1988, ApJ, 328, 315
- Matt et al. (2000) Matt, G., Fabian, A. C., Guainazzi, M. Iwasawa, K., Bassani, L., & Malaguti, G. 2000, MNRAS, 318, 173
- McLure & Dunlop (2004) McLure, R. J., & Dunlop, J. S. 2004, MNRAS, 352, 1390
- Moran, Filippenko, & Chornock (2002) Moran, E. C., Filippenko, A. V., & Chornock, R. 2002, ApJ, 579, L71
- Moretti et al. (2003) Moretti, A., Campana, S., et al., 2003, ApJ, 588, 696
- Morrison & McCammon (1983) Morrison, R., & McCammon, D. 1983, ApJ, 270, 119
- Nandra & Pounds (1994) Nandra, K., & Pounds, K. A. 1994, MNRAS, 268, 405
- Norman et al. (2001) Norman, C. et al. 2002, ApJ, 571, 218
- Oke et al. (1995) Oke, J. B., Cohen, J. G., Carr, M., Cromer, J. et al. 1995, PASP, 107, 375
- Osterbrock & Shaw (1988) Osterbrock, D. E., & Shaw, R. A. 1988, ApJ, 327, 89
- Padovani et al. (2004) Padovani, P., Allen, M. G., Rosati, P., & Walto, A. 2004, A&A, 424, 545
- Peeters et al. (2004) Peeters, E., Spoon, H. W. W., & Tielens, A. G. G. M. 2004, ApJ, 613, 986
- Perola et al. (2004) Perola, G. C., Puccetti, S., et al., 2004, A&A, 421, 491
- Piccinotti et al. (1982) Piccinotti, G., Mushotzky, R. F., Boldt, E. A., Holt, S. S. et al. 1982, ApJ, 253, 485
- Piconcelli et al. (2003) Piconcelli, E., Cappi, M., et al., 2003, A&A, 412, 689
- Polletta et al. (2003) Polletta, M., Lonsdale, C. J., Xu, C. & Wilkes, B. J. 2003, AN, 324, 170
- Prevot et al. (1984) Prevot, M. L., Lequex, J., Prevot, L., Maurice, E., & Rocca-Volmerange, B. 1984, A&A, 132, 389
- Richards et al. (2003) Richards, G.T. et al. 2003, AJ, 126, 1131
- Richards et al. (2005) Richards, G.T. et al. 2005, MNRAS, 360, 825
- Rieke et al. (2004) Rieke, G. et al. 2004, ApJS, 154,
- Rigby et al. (2004) Rigby, J. R. et al. 2004, ApJS, 154, 160
- Rigby et al. (2005) Rigby, J. R., Rieke, G. H., Pérez-González, P. G., Donley, J. L., Alonso-Herrero, A., Huang, J.-S., Barmby, P., & Fazio, G. G. 2005, ApJ, 627, 134
- Rigopoulou et al. (1999) Rigopoulou, D., Spoon, H. W. W., Genzel, R. Lutz, D., Moorwood, A. F. M., & Tran, Q. D. 1999, AJ, 188, 2625
- Risaliti et al. (1999) Risaliti, G., Maiolino, R., & Salvati, M. 1999, ApJ, 522, 157
- Sanders & Mirabel (1996) Sanders, D. B., & Mirabel, I. F. 1996, ARA&A, 34, 749
- Silk & Rees (1998) Silk, J. & Rees, M. J. 1998, A&A, 331, L1
- Silva, Maiolino & Granato (2004) Silva, L., Maiolino, R., & Granato, G.L. 2004, MNRAS, 355, 973
- Smith & Done (1996) Smith, D. A., & Done C. 1996, MNRAS, 280, 355
- Smith et al. (2003) Smith. P. S., Schmidt, G. D., & Hines, D. C. 2003, ApJ, 593, 676
- Spergel et al. (2003) Spergel, D. N. et al. 2003, ApJS, 148, 175
- Springel et al. (2005) Springel, V., Di Matteo, T., & Hernquist, L. 2005, MNRAS, 361, 776
- Stern et al. (2002) Stern, D. et al. 2002, ApJ, 568, 71
- Stern et al. (2004) Stern, D. et al. 2004, ApJ, 631, 163
- Surace et al. (2005) Surace, J. A. et al. 2005, SWIRE Data Delivery Document II, Spitzer Science Center, Caltech
- Szokoly et al. (2004) Szokoly, G. P. et al. 2004, ApJS, 155, 271
- Tadhunter et al. (2003) Tadhunter, C., Marconi, A., Axon, D., Wills, K. et al. 2003, MNRAS, 342, 861
- Treister et al. (2004) Treister, E., Urry, C.M., et al., 2004, ApJ, 616, 123
- Treister & Urry (2005) Treister, E. & Urry, C.M. 2005, ApJ, 630, 15
- Ueda et al. (2003) Ueda, Y., Akiyama, M., Ohta, K., & Miyaji, T. 2003, ApJ, 598, 886
- Urrutia et al. (2005) Urrutia, T., Lacy, M., Gregg, M.D., & Becker, R.H. 2005, ApJ, 627, 75
- van Dyk et al. (2004) van Dyk, D. A. et al. 2004, HEAD, 8, 1627
- Van Duyne et al. (2004) Van Duyne, J. et al. 2004, AAS, 20516, 309
- Vignati et al. (1999) Vignati, P. et al. 1999, A&AL, 349, 57
- Xu et al. (2003) Xu C., Lonsdale C.J., Shupe D.L., Franceschini A., Martin C., Schiminovich D. 2003, ApJ, 587, 90
- Webster et al. (1995) Webster, R. L., Francis, P. J., Peterson, B. A., Drinkwater, M. J., & Masci, F. J. 1995, , 375, 469
- Weedman et al. (2005) Weedman, D. W., Hao, L., Higdon, S. J. U., Devost, D., Wu, Y., Charmandaris, V., Brandl, B., Bass, E., & Houck, J.R. 2005, ApJ, 633, 706
- Weisskopf, O’dell, & van Speybroeck (1996) Weisskopf, M. C., O’dell, S. L., & van Speybroeck, L. P. 1996, SPIE, 2805, 2
- Werner et al. (2004) Werner, M. W., Roellig, T. L., Low, F. J., Rieke, G. H. et al. 2004, ApJS, 154, 1
- White et al. (2003) White, R.L., Helfand, D.J., Becker, R.H., Gregg, M.D., Postman, M., Lauer, T.R., & Oegerle, W. 2003, AJ, 126, 706
- Wilkes et al. (2002) Wilkes, B. J., Schmidt, G. D., Cutri, R. M., Ghosh, H., Hines, D. C., Nelson, B., Smith, & Paul S. 2002, ApJ, 564, 65
- Wilson et al. (2003) Wilson, J. C., Eikenberry, S., Henderson, C., et al. 2003, “A Wide-Field Infrared Camera for the Palomar 200-inch Telescope”, Proceedings of the SPIE, Volume 4841, pp. 451-458.
- Wolf et al. (2003) Wolf, C., Wisotzki, L., Borch, A., Dye, S., Kleinheinrich, M., & Meisenheimer, K. 2003, A&AS, 408, 499
- Worsley et al. (2004) Worsley, M. A., Fabian, A. C., Barcons, X., Mateos, S., Hasinger, G., & Brunner, H. 2004, MNRAS, 353, L28
- Worsley et al. (2005) Worsley, M. A., Fabian, A. C., Bauer, F. E., Alexander, D. M., Hasinger, M. S., Brunner, H., Brandt, W. N., & Schneider, D. P. 2005, MNRAS, 357, 1281
- Zakamska et al. (2004) Zakamska, N.L., Strauss, M. A., Heckman, T. M., Ivezic, Z., Krolik, J. H. 2004, AJ, 128, 1002
| Telescope/Instrument | Area | Observing date | Band | Exp. Time | 5 limit | ||
|---|---|---|---|---|---|---|---|
| (h m) | (∘ ′) | (sec) | Jy/Vega mag | ||||
| KPNO: Mayall 4mt/Mosaic | 10 46 | +59 00 | 30′30′ | 2004 Jan | U | 21,600 | 24.8 |
| KPNO: Mayall 4mt/Mosaic | 10 46 | +59 03 | 60′54′ | 2004 Jan | U | 7200 | 24.3 |
| KPNO: Mayall 4mt/Mosaic | 10 46 | +59 00 | 30′30′ | 2002 Feb | , , | 10,800 | 25.9, 25.2, 24.4 |
| KPNO: Mayall 4mt/Mosaic | 10 46 | +59 03 | 60′54′ | 2002 Feb | , | 3000 | 25.2, 24.4 |
| KPNO: Mayall 4mt/Mosaic | 10 46 | +59 03 | 60′54′ | 2002 Feb | 1800 | 23.5 | |
| KPNO: Mayall 4mt/Mosaic | 10 46 | +58 33 | 60′6′ | 2002 Feb | , , | 1800 | 23.7, 23.5, 22.9 |
| Palomar: 200″ Hale/WIRC | 10 46 | +59 00 | 36′43′ | 2004 Mar 29 | Ks | 4320 | 20.5 |
| VLA | 10 46 | +59 01 | 40′40′ | 2001, 2002 & 2003 | 20 | 500,000 | 13.5 |
| Chandra/ACIS-I | 10 46 | +59 01 | 47′47′ | 2004 Sep 12-26 | 0.3–8 keV | 70,000 | 10-15 |
| Spitzer/IRAC | 10 45 | +58 00 | 3.69∘3.01∘ | 2003 Dec & 2004 Apr | 3.6, 4.5, 5.8, 8.0 µm | 120–480 | 5, 9, 43, 40 |
| Spitzer/MIPS | 10 45 | +58 00 | 3.66∘3.00∘ | 2003 Dec & 2004 May | 24 µm | 160–360 | 230 |
| Source name | aaIR coordinates | aaIR coordinates | mag() | bbUpper limits correspond to 5. | |||||
|---|---|---|---|---|---|---|---|---|---|
| (degrees) | (degrees) | (Vega) | (Jy) | (Jy) | (Jy) | (Jy) | (Jy) | (Jy) | |
| SWIRE_J104311.22+591128.2 | 160.79675 | 59.191170 | 22.81 | 20 | 20 | 43 | 40 | 230 | 87 |
| SWIRE_J104322.07+590648.7 | 160.84196 | 59.113541 | 24.83 | 26 | 29 | 43 | 40 | 230 | 6417 |
| SWIRE_J104406.30+583954.1 | 161.02626 | 58.665039 | 23.35 | 53 | 67 | 131 | 244 | 1099 | 162 |
| SWIRE_J104407.67+584011.3 | 161.03194 | 58.669800 | 25.2 | 30 | 34 | 43 | 40 | 230 | 154 |
| SWIRE_J104409.95+585224.8 | 161.04146 | 58.873550 | 23.55 | 65 | 152 | 401 | 1082 | 4011 | 27315 |
Note. — Typical uncertainties to the IR fluxes are around 10% of the measured fluxed and to the optical magnitudes are around 0.04 mag.
| Source name | aaX-ray coordinates | aaX-ray coordinates | Total counts | FluxbbX-ray flux in 10-16 derived assuming an absorbed power-law model with photon index, equal to 1.7 and Galactic (61019 ). Uncertainties reflect only the statistical errors from the observed counts and do not include uncertainties in the spectral model. | FluxbbX-ray flux in 10-16 derived assuming an absorbed power-law model with photon index, equal to 1.7 and Galactic (61019 ). Uncertainties reflect only the statistical errors from the observed counts and do not include uncertainties in the spectral model. | FluxbbX-ray flux in 10-16 derived assuming an absorbed power-law model with photon index, equal to 1.7 and Galactic (61019 ). Uncertainties reflect only the statistical errors from the observed counts and do not include uncertainties in the spectral model. | HR | zphot | obscc in the observer rest-frame in 1022 cm-2. | restdd in the source rest-frame in 1022 cm-2. | Log(L)eeLogarithm of the 0.3-8 keV absorption-corrected rest-frame luminosity in . |
|---|---|---|---|---|---|---|---|---|---|---|---|
| (degrees) | (degrees) | (0.3-8 keV) | (0.3-8 keV) | (0.3-2.5 keV) | (2.5-8 keV) | ||||||
| SWIRE_J104311.22+591128.2 | 160.79686 | 59.191322 | 125 | 208 | 03 | 3815 | 1.00 | 2.27 | 30 | 863 | 45.9 |
| SWIRE_J104322.07+590648.7 | 160.84201 | 59.113667 | 165 | 259 | 03 | 5017 | 1.00 | 1.41 | 30 | 312 | 45.5 |
| SWIRE_J104406.30+583954.1 | 161.02638 | 58.665276 | 226 | 3711 | 44 | 6320 | 0.61 | 2.43ffSpectroscopic . Photometric are reported in Table 4. | 4 | 99 | 45.7 |
| SWIRE_J104407.67+584011.3 | 161.03212 | 58.670094 | 125 | 219 | 03 | 4117 | 1.00 | 1.42 | 20 | 200 | 45.4 |
| SWIRE_J104409.95+585224.8 | 161.04143 | 58.873802 | 115 | 198 | 23 | 3315 | 0.85 | 2.54ffSpectroscopic . Photometric are reported in Table 4. | 8 | 214 | 45.6 |
| Source name | aaIR coordinates | aaIR coordinates | mag() | ClassbbClass I sources are characterized by convex IR SED fitted by a “Torus” template. Class II sources show power-law like optical-IR SEDs, similar to Mrk 231 or slightly redder (A1). Class III sources have power-law like optical-IR SED fitted by a reddened QSO template (A0.6–1.0). Class IV sources show signatures from both a starburst and an AGN component. Class V sources area characterized by very red optical SEDs and power-law like IR SEDs. Class VI objects are detected only in three bands from 3.6 to 24m. | ||||||||
|---|---|---|---|---|---|---|---|---|---|---|---|---|
| (degrees) | (degrees) | (Vega) | (Jy) | (Jy) | (Jy) | (Jy) | (Jy) | (Jy) | ||||
| SWIRE_J104314.93+585606.3 | 160.81221 | 58.935070 | 24.4 | 9 | 22 | 63 | 116 | 936 | 9023 | 3.07 | I | |
| SWIRE_J104409.95+585224.8 | 161.04146 | 58.873550 | 23.55 | 65 | 152 | 401 | 1082 | 4011 | 27315 | 2.540 | 2.67 | IccX-ray source |
| SWIRE_J104531.45+591027.0 | 161.38103 | 59.174160 | 25.2 | 28 | 54 | 110 | 179 | 1189 | 103 5 | 1.97 | IccX-ray source | |
| SWIRE_J104605.11+584310.8 | 161.52130 | 58.719662 | 25.2 | 14 | 26 | 59 | 162 | 707 | 5811 | 2.03 | I | |
| SWIRE_J104605.54+583742.5 | 161.52309 | 58.628460 | 24.4 | 12 | 21 | 72 | 127 | 1359 | 91 | 3.63 | I | |
| SWIRE_J104633.45+590016.7 | 161.63937 | 59.004631 | 25.2 | 17 | 35 | 67 | 131 | 355 | 33 3 | 1.50 | I | |
| SWIRE_J104659.42+584624.1 | 161.74757 | 58.773350 | 25.2 | 27 | 50 | 77 | 128 | 538 | 22316 | 1.18 | I | |
| SWIRE_J104811.23+592206.8 | 162.04680 | 59.368561 | 24.4 | 53 | 96 | 181 | 319 | 1315 | 198 | 1.32 | I | |
| SWIRE_J104825.76+591338.9 | 162.10732 | 59.227470 | 24.4 | 45 | 70 | 150 | 241 | 1234 | 15423 | 1.31 | IccX-ray source | |
| SWIRE_J104301.13+591214.4 | 160.75470 | 59.204010 | 24.4 | 36 | 61 | 109 | 150 | 1022 | 18544 | 2.16 | II | |
| SWIRE_J104310.29+585916.0 | 160.79289 | 58.987789 | 23.78 | 24 | 33 | 50 | 87 | 548 | 68 | 2.00 | IIccX-ray source | |
| SWIRE_J104311.81+590649.9 | 160.79923 | 59.113850 | 22.97 | 129 | 210 | 428 | 714 | 1921 | 217 | 0.83 | II | |
| SWIRE_J104323.61+590218.3 | 160.84839 | 59.038422 | 24.40 | 25 | 27 | 33 | 54 | 326 | 146 | 0.90 | II | |
| SWIRE_J104359.77+585811.3 | 160.99904 | 58.969810 | 25.2 | 14 | 17 | 43 | 53 | 358 | 27 | 2.35 | II | |
| SWIRE_J104402.02+584504.9 | 161.00841 | 58.751362 | 23.65 | 44 | 48 | 58 | 112 | 882 | 30 | 2.04 | II | |
| SWIRE_J104406.30+583954.1 | 161.02626 | 58.665039 | 23.35 | 53 | 67 | 131 | 244 | 1099 | 162 | 2.430 | 2.14 | IIccX-ray source |
| SWIRE_J104406.71+585130.8 | 161.02797 | 58.858551 | 24.90 | 24 | 28 | 43 | 66 | 397 | 94 | 1.99 | IIccX-ray source | |
| SWIRE_J104423.99+584638.3 | 161.09996 | 58.777302 | 24.82 | 15 | 24 | 30 | 64 | 307 | 119 | 0.88 | II | |
| SWIRE_J104444.84+585019.5 | 161.18681 | 58.838749 | 24.63 | 14 | 16 | 43 | 52 | 440 | 55 8 | 3.42 | II | |
| SWIRE_J104458.45+590314.0 | 161.24353 | 59.053890 | 23.42 | 93 | 157 | 328 | 623 | 1861 | 33 4 | 1.520 | 1.58 | II |
| SWIRE_J104459.07+590705.3 | 161.24612 | 59.118141 | 23.68 | 31 | 45 | 58 | 132 | 674 | 40 4 | 0.89 | II | |
| SWIRE_J104524.91+591626.7 | 161.35379 | 59.274071 | 24.69 | 35 | 47 | 59 | 106 | 636 | 14015 | 0.72 | II | |
| SWIRE_J104525.21+585949.3 | 161.35506 | 58.997040 | 25.2 | 10 | 19 | 39 | 64 | 335 | 24 3 | 2.05 | IIccX-ray source | |
| SWIRE_J104533.47+590541.1 | 161.38947 | 59.094749 | 24.60 | 13 | 15 | 37 | 52 | 398 | 33 3 | 2.77 | II | |
| SWIRE_J104551.81+590345.3 | 161.46588 | 59.062592 | 24.06 | 34 | 41 | 53 | 88 | 472 | 21 5 | 1.00 | IIccX-ray source | |
| SWIRE_J104554.47+592322.2 | 161.47697 | 59.389488 | 24.4 | 9 | 19 | 33 | 89 | 242 | 216 | 3.48 | II | |
| SWIRE_J104604.78+591625.3 | 161.51993 | 59.273701 | 23.80 | 38 | 66 | 115 | 193 | 538 | 72 | 1.13 | II | |
| SWIRE_J104609.55+590849.0 | 161.53979 | 59.146938 | 24.09 | 17 | 27 | 45 | 101 | 319 | 44 3 | 1.82 | II | |
| SWIRE_J104622.31+585036.0 | 161.59294 | 58.843330 | 23.79 | 36 | 53 | 74 | 143 | 509 | 7912 | 0.96 | II | |
| SWIRE_J104627.46+584049.2 | 161.61443 | 58.680328 | 24.04 | 26 | 42 | 57 | 150 | 488 | 154 | 0.81 | II | |
| SWIRE_J104633.29+584820.3 | 161.63870 | 58.805641 | 24.05 | 17 | 20 | 32 | 47 | 440 | 47 6 | 2.69 | IIccX-ray source | |
| SWIRE_J104637.25+585252.4 | 161.65520 | 58.881222 | 25.2 | 14 | 25 | 48 | 99 | 332 | 25 4 | 1.84 | II | |
| SWIRE_J104637.57+590014.6 | 161.65654 | 59.004059 | 25.2 | 10 | 12 | 43 | 32 | 418 | 24 7 | 3.43 | II | |
| SWIRE_J104657.15+592152.8 | 161.73814 | 59.364658 | 24.04 | 28 | 31 | 51 | 64 | 698 | 89 | 1.579 | 2.56 | II |
| SWIRE_J104658.67+584042.4 | 161.74446 | 58.678440 | 24.4 | 30 | 47 | 61 | 105 | 269 | 19243 | 1.32 | II | |
| SWIRE_J104700.21+590107.6 | 161.75087 | 59.018780 | 23.72 | 28 | 33 | 59 | 158 | 1273 | 279 6 | 2.562 | 2.85 | II |
| SWIRE_J104704.98+585849.7 | 161.77074 | 58.980469 | 24.18 | 27 | 33 | 55 | 74 | 427 | 35 | 2.09 | II | |
| SWIRE_J104705.31+584420.3 | 161.77211 | 58.738960 | 23.47 | 37 | 49 | 66 | 87 | 738 | 21923 | 2.25 | II | |
| SWIRE_J104705.49+590919.4 | 161.77287 | 59.155380 | 25.06 | 16 | 30 | 66 | 111 | 903 | 53 6 | 2.44 | II | |
| SWIRE_J104714.84+591916.5 | 161.81181 | 59.321259 | 23.98 | 41 | 54 | 65 | 94 | 862 | 26236 | 0.76 | II | |
| SWIRE_J104726.03+591305.5 | 161.85844 | 59.218189 | 25.2 | 26 | 41 | 68 | 114 | 409 | 16916 | 1.67 | II | |
| SWIRE_J104735.76+584707.3 | 161.89902 | 58.785370 | 25.2 | 12 | 17 | 32 | 56 | 313 | 8912 | 2.11 | II | |
| SWIRE_J104735.93+590549.7 | 161.89970 | 59.097149 | 24.74 | 21 | 29 | 54 | 67 | 324 | 55 | 1.64 | IIccX-ray source | |
| SWIRE_J104746.64+585113.5 | 161.94432 | 58.853760 | 25.2 | 11 | 20 | 32 | 50 | 244 | 4110 | 1.85 | II | |
| SWIRE_J104746.79+591759.2 | 161.94496 | 59.299770 | 24.59 | 21 | 27 | 43 | 62 | 393 | 196 | 2.09 | II | |
| SWIRE_J104754.20+590956.3 | 161.97582 | 59.165630 | 23.84 | 22 | 26 | 43 | 58 | 448 | 91 | 2.57 | II | |
| SWIRE_J104806.02+584456.4 | 162.02510 | 58.749001 | 24.34 | 25 | 33 | 43 | 52 | 338 | 12624 | 0.81 | II | |
| SWIRE_J104820.64+592436.6 | 162.08600 | 59.410160 | 23.75 | 25 | 42 | 76 | 196 | 833 | 1064 | 2.46 | II | |
| SWIRE_J104831.65+592004.6 | 162.13188 | 59.334621 | 22.87 | 68 | 73 | 87 | 147 | 775 | 596 | 0.60 | II | |
| SWIRE_J104836.72+585414.7 | 162.15300 | 58.904072 | 22.77 | 75 | 117 | 161 | 231 | 887 | 176 | 0.53 | IIccX-ray source | |
| SWIRE_J104844.25+585139.4 | 162.18439 | 58.860931 | 24.4 | 15 | 24 | 43 | 64 | 200 | 248 | 1.54 | II | |
| SWIRE_J104903.66+590006.9 | 162.26524 | 59.001930 | 24.24 | 29 | 42 | 51 | 119 | 379 | 276 | 1.64 | IIccX-ray source | |
| SWIRE_J104955.03+584742.8 | 162.47929 | 58.795219 | 23.10 | 22 | 31 | 43 | 125 | 1080 | 3.42 | II | ||
| SWIRE_J104257.62+590438.9 | 160.74010 | 59.077469 | 23.39 | 21 | 23 | 43 | 40 | 256 | 281 | 1.54 | III | |
| SWIRE_J104321.34+590943.0 | 160.83891 | 59.161942 | 20.03 | 184 | 239 | 345 | 492 | 2665 | 209 | 2.29 | IIIccX-ray source | |
| SWIRE_J104353.42+585316.2 | 160.97260 | 58.887840 | 22.75 | 32 | 39 | 62 | 90 | 560 | 103 | 0.563 | 0.69 | IIIccX-ray source |
| SWIRE_J104359.52+590156.3 | 160.99800 | 59.032310 | 23.25 | 34 | 58 | 84 | 148 | 464 | 103 8 | 0.84 | III | |
| SWIRE_J104414.18+584644.6 | 161.05907 | 58.779049 | 22.26 | 63 | 81 | 126 | 268 | 1762 | 43525 | 2.73 | III | |
| SWIRE_J104432.03+590457.7 | 161.13344 | 59.082691 | 22.80 | 56 | 111 | 192 | 339 | 1067 | 104 8 | 0.90 | IIIccX-ray source | |
| SWIRE_J104447.56+585918.7 | 161.19815 | 58.988529 | 22.90 | 29 | 38 | 66 | 127 | 660 | 120 4 | 2.488 | 2.44 | III |
| SWIRE_J104500.71+591353.4 | 161.25297 | 59.231491 | 23.13 | 45 | 70 | 108 | 156 | 776 | 6413 | 0.70 | IIIccX-ray source | |
| SWIRE_J104528.33+583651.8 | 161.36803 | 58.614391 | 22.12 | 24 | 37 | 54 | 87 | 366 | 325 | 1.54 | III | |
| SWIRE_J104616.93+585457.1 | 161.57056 | 58.915871 | 23.63 | 26 | 32 | 43 | 52 | 241 | 60 7 | 0.70 | IIIccX-ray source | |
| SWIRE_J104635.87+590748.8 | 161.64946 | 59.130219 | 23.48 | 39 | 48 | 58 | 67 | 615 | 97 3 | 0.45 | III | |
| SWIRE_J104638.87+591931.4 | 161.66196 | 59.325378 | 24.4 | 9 | 16 | 43 | 71 | 227 | 124 | 2.09 | III | |
| SWIRE_J104641.38+585213.9 | 161.67242 | 58.870529 | 22.75 | 42 | 84 | 204 | 541 | 2797 | 10048 | 1.10 | IIIccX-ray source | |
| SWIRE_J104644.18+590027.8 | 161.68407 | 59.007710 | 22.56 | 33 | 42 | 67 | 77 | 899 | 30 6 | 2.542 | 2.79 | IIIccX-ray source |
| SWIRE_J104733.37+591200.9 | 161.88902 | 59.200241 | 22.39 | 91 | 127 | 196 | 307 | 1110 | 49 9 | 0.71 | III | |
| SWIRE_J104748.20+590905.7 | 161.95082 | 59.151581 | 23.48 | 25 | 33 | 50 | 63 | 375 | 78 | 3.14 | III | |
| SWIRE_J104749.61+584845.7 | 161.95670 | 58.812691 | 23.03 | 25 | 32 | 39 | 58 | 183 | 114 | 0.69 | IIIccX-ray source | |
| SWIRE_J104826.99+585438.8 | 162.11246 | 58.910782 | 22.89 | 32 | 53 | 84 | 156 | 519 | 8714 | 1.41 | IIIccX-ray source | |
| SWIRE_J104913.37+585946.3 | 162.30569 | 58.996181 | 23.41 | 22 | 27 | 38 | 88 | 316 | 356 | 3.43 | IIIccX-ray source | |
| SWIRE_J104229.75+591154.6 | 160.62396 | 59.198490 | 24.4 | 36 | 51 | 52 | 114 | 983 | 281 | 1.89 | IV | |
| SWIRE_J104241.45+591357.2 | 160.67270 | 59.232559 | 24.4 | 31 | 43 | 44 | 124 | 319 | 816 | 1.43 | IVccX-ray source | |
| SWIRE_J104254.46+591013.3 | 160.72691 | 59.170361 | 24.4 | 47 | 61 | 63 | 152 | 591 | 411 | 1.54 | IVccX-ray source | |
| SWIRE_J104414.37+584320.4 | 161.05988 | 58.722340 | 25.2 | 65 | 79 | 90 | 149 | 1061 | 75422 | 1.78 | IV | |
| SWIRE_J104420.22+583948.0 | 161.08424 | 58.663342 | 24.89 | 44 | 62 | 71 | 104 | 615 | 346 | 1.70 | IVccX-ray source | |
| SWIRE_J104526.75+583526.0 | 161.36145 | 58.590542 | 23.5 | 104 | 104 | 126 | 349 | 2538 | 62245 | 1.84 | IV | |
| SWIRE_J104528.29+591326.7 | 161.36789 | 59.224079 | 23.45 | 35 | 47 | 91 | 199 | 2410 | 1437910 | 0.67 | IVccX-ray source | |
| SWIRE_J104650.27+592602.8 | 161.70947 | 59.434120 | 24.4 | 31 | 48 | 67 | 203 | 1488 | 147 | 0.88 | IV | |
| SWIRE_J104718.10+585526.2 | 161.82542 | 58.923931 | 25.2 | 11 | 16 | 43 | 29 | 314 | 60 5 | 1.95 | IV | |
| SWIRE_J104733.46+592108.1 | 161.88942 | 59.352242 | 23.88 | 44 | 52 | 75 | 199 | 801 | 9230 | 1.11 | IVccX-ray source | |
| SWIRE_J104734.47+591332.9 | 161.89362 | 59.225819 | 25.2 | 13 | 17 | 43 | 42 | 356 | 9410 | 1.90 | IV | |
| SWIRE_J104736.92+591941.3 | 161.90385 | 59.328152 | 24.4 | 31 | 37 | 53 | 93 | 383 | 220 | 1.54 | IVccX-ray source | |
| SWIRE_J104754.78+590810.4 | 161.97826 | 59.136211 | 25.2 | 11 | 18 | 43 | 34 | 274 | 26 | 1.83 | IVccX-ray source | |
| SWIRE_J104802.42+592656.5 | 162.01010 | 59.449020 | 24.4 | 36 | 42 | 58 | 83 | 1043 | 423 | 2.14 | IV | |
| SWIRE_J104813.49+590340.7 | 162.05620 | 59.061310 | 24.4 | 13 | 21 | 43 | 46 | 356 | 4110 | 1.82 | IVccX-ray source | |
| SWIRE_J104838.01+591702.6 | 162.15836 | 59.284050 | 24.4 | 18 | 22 | 28 | 63 | 430 | 438 | 1.79 | IV | |
| SWIRE_J104303.50+585718.1 | 160.76460 | 58.955029 | 20.32 | 322 | 364 | 611 | 1136 | 5371 | 244 | 0.60 | VccX-ray source | |
| SWIRE_J104351.87+584953.7 | 160.96614 | 58.831589 | 23.02 | 23 | 27 | 57 | 103 | 996 | 139 | 0.609 | 0.59 | VccX-ray source |
| SWIRE_J104407.97+584437.0 | 161.03319 | 58.743622 | 20.32 | 655 | 858 | 1148 | 1595 | 7053 | 21348 | 0.555 | 0.58 | VccX-ray source |
| SWIRE_J104422.64+591304.1 | 161.09435 | 59.217819 | 21.49 | 145 | 176 | 262 | 352 | 1439 | 12317 | 0.32 | VccX-ray source | |
| SWIRE_J104503.56+585109.9 | 161.26485 | 58.852741 | 22.83 | 133 | 176 | 237 | 344 | 1006 | 8619 | 0.98 | VccX-ray source | |
| SWIRE_J104504.96+585947.3 | 161.27066 | 58.996479 | 21.15 | 80 | 89 | 136 | 309 | 2404 | 13711 | 0.214 | 0.13 | VccX-ray source |
| SWIRE_J104532.93+584638.6 | 161.38722 | 58.777382 | 24.37 | 34 | 45 | 64 | 124 | 345 | 66 | 1.78 | VccX-ray source | |
| SWIRE_J104704.33+591142.9 | 161.76802 | 59.195240 | 25.2 | 21 | 25 | 41 | 55 | 185 | 57 | 1.34 | V | |
| SWIRE_J104708.05+585026.3 | 161.78352 | 58.840641 | 20.79 | 79 | 101 | 144 | 242 | 1607 | 58 | 0.44 | V | |
| SWIRE_J104725.94+591025.5 | 161.85806 | 59.173759 | 21.54 | 111 | 150 | 200 | 277 | 886 | 73 7 | 0.67 | VccX-ray source | |
| SWIRE_J104731.84+592432.9 | 161.88266 | 59.409149 | 24.4 | 31 | 38 | 54 | 76 | 281 | 483 | 3.11 | VccX-ray source | |
| SWIRE_J104734.57+584338.7 | 161.89404 | 58.727409 | 22.68 | 105 | 119 | 180 | 302 | 1286 | 11821 | 0.87 | V | |
| SWIRE_J104748.27+590534.7 | 161.95113 | 59.092960 | 25.2 | 16 | 19 | 26 | 41 | 230 | 199 7 | 1.04 | VccX-ray source | |
| SWIRE_J104826.92+592116.1 | 162.11218 | 59.354469 | 20.08 | 258 | 316 | 423 | 738 | 3632 | 45079 | 0.58 | V | |
| SWIRE_J104829.49+591249.1 | 162.12288 | 59.213631 | 21.07 | 108 | 155 | 208 | 333 | 1117 | 12523 | 0.28 | VccX-ray source | |
| SWIRE_J104851.80+591019.8 | 162.21584 | 59.172161 | 22.87 | 60 | 97 | 137 | 196 | 957 | 295 | 0.82 | V | |
| SWIRE_J104344.33+585102.5 | 160.93469 | 58.850689 | 24.4 | 9 | 16 | 43 | 40 | 260 | 144 | 2.01 | VI | |
| SWIRE_J104407.69+585125.9 | 161.03204 | 58.857189 | 25.2 | 6 | 9 | 43 | 40 | 341 | 93 | 2.51 | VI | |
| SWIRE_J104408.30+590455.4 | 161.03458 | 59.082062 | 25.2 | 9 | 13 | 43 | 40 | 240 | 67 | 1.79 | VI | |
| SWIRE_J104530.65+585936.8 | 161.37772 | 58.993549 | 25.2 | 10 | 13 | 43 | 40 | 256 | 19 3 | 1.93 | VI | |
| SWIRE_J104534.22+591400.3 | 161.39259 | 59.233410 | 25.2 | 8 | 13 | 43 | 40 | 277 | 56 | 1.91 | VI | |
| SWIRE_J104558.79+583812.9 | 161.49496 | 58.636909 | 24.4 | 8 | 13 | 43 | 40 | 344 | 233 | 2.73 | VI | |
| SWIRE_J104623.23+584410.9 | 161.59677 | 58.736351 | 25.2 | 9 | 14 | 43 | 40 | 280 | 90 | 2.61 | VI | |
| SWIRE_J104632.92+590820.9 | 161.63716 | 59.139141 | 25.2 | 10 | 15 | 43 | 40 | 245 | 36 4 | 1.75 | VI | |
| SWIRE_J104703.99+585039.9 | 161.76662 | 58.844410 | 24.79 | 8 | 14 | 43 | 40 | 263 | 55 | 2.06 | VI | |
| SWIRE_J104708.15+585721.1 | 161.78397 | 58.955860 | 25.2 | 10 | 17 | 43 | 40 | 240 | 38 | 1.93 | VI | |
| SWIRE_J104708.92+584524.1 | 161.78716 | 58.756691 | 25.2 | 9 | 13 | 43 | 40 | 299 | 102 | 1.95 | VI | |
| SWIRE_J104720.43+590107.9 | 161.83514 | 59.018871 | 25.2 | 8 | 12 | 43 | 40 | 260 | 39 4 | 1.93 | VI | |
| SWIRE_J104728.64+585346.1 | 161.86932 | 58.896141 | 24.02 | 14 | 19 | 43 | 41 | 230 | 57 | 0.58 | VI | |
| SWIRE_J104747.72+585903.9 | 161.94882 | 58.984421 | 25.2 | 6 | 9 | 43 | 40 | 243 | 122 7 | 2.09 | VI | |
| SWIRE_J104754.71+591137.2 | 161.97797 | 59.193661 | 25.2 | 10 | 14 | 43 | 40 | 254 | 106 | 1.82 | VI | |
| SWIRE_J104803.66+592252.5 | 162.01524 | 59.381248 | 24.4 | 8 | 14 | 43 | 40 | 259 | 564 | 2.17 | VI |
Note. — Typical uncertainties to the IR fluxes are 10% of the measured fluxes and to the optical magnitudes are around 0.04 mag. Upper limits correspond to 5 values.
| Source name | Total counts | F0.3-8keVaaX-ray flux in 10-16 derived assuming an absorbed power-law model with photon index, equal to 1.7 and Galactic (61019 ). Uncertainties reflect only the statistical errors from the observed counts and do not include uncertainties in the spectral model. | F0.3-2.5keVaaX-ray flux in 10-16 derived assuming an absorbed power-law model with photon index, equal to 1.7 and Galactic (61019 ). Uncertainties reflect only the statistical errors from the observed counts and do not include uncertainties in the spectral model. | F2.5-8keVaaX-ray flux in 10-16 derived assuming an absorbed power-law model with photon index, equal to 1.7 and Galactic (61019 ). Uncertainties reflect only the statistical errors from the observed counts and do not include uncertainties in the spectral model. | HR | obsbb in the observer rest-frame in 1022 cm-2. | restcc in the source rest-frame in 1022 cm-2. | ddLogarithm of the 0.3-8 keV absorption-corrected rest-frame luminosity in . | Class | |
|---|---|---|---|---|---|---|---|---|---|---|
| (0.3-8 keV) | ||||||||||
| SWIRE_J104409.95+585224.8 | 11 5 | 19 8 | 2 3 | 33 15 | 0.85 | 2.540fffootnotemark: | 8.0 | 214.0 | 45.637 | I |
| SWIRE_J104531.45+591027.0 | 7 4 | 12 7 | 5 4 | 10 11 | 0.14 | 1.973 | 0.7 | 11.6 | 43.986 | I |
| SWIRE_J104825.76+591338.9 | 21 7 | 34 12 | 19 7 | 13 16 | 0.61 | 1.307 | 0.1 | 0.1 | 43.497 | I |
| SWIRE_J104310.29+585916.0 | 118 13 | 202 22 | 84 12 | 162 30 | 0.20 | 1.997 | 0.6 | 10.0 | 45.186 | II |
| SWIRE_J104406.30+583954.1 | 22 6 | 37 11 | 4 4 | 63 20 | 0.61 | 2.430fffootnotemark: | 4.3 | 99.0 | 45.738 | II |
| SWIRE_J104406.71+585130.8 | 10 5 | 17 8 | 10 5 | 4 10 | 0.78 | 1.991 | 0.1 | 0.2 | 43.645 | II |
| SWIRE_J104525.21+585949.3 | 16 5 | 27 9 | 15 6 | 10 12 | 0.62 | 2.045 | 0.1 | 0.2 | 43.882 | II |
| SWIRE_J104551.81+590345.3 | 10 5 | 17 8 | 5 4 | 19 13 | 0.10 | 0.999 | 1.3 | 7.8 | 43.363 | II |
| SWIRE_J104633.29+584820.3 | 6 4 | 10 7 | 5 4 | 6 10 | 0.40 | 2.693 | 0.2 | 6.4 | 44.102 | II |
| SWIRE_J104735.93+590549.7 | 34 7 | 55 11 | 21 6 | 48 16 | 0.12 | 1.644 | 0.8 | 9.4 | 44.412 | II |
| SWIRE_J104836.72+585414.7 | 59 9 | 98 15 | 54 9 | 39 16 | 0.60 | 0.533 | 0.1 | 0.1 | 43.002 | II |
| SWIRE_J104903.66+590006.9 | 19 7 | 32 12 | 21 7 | 4 16 | 0.87 | 1.641 | 0.1 | 0.1 | 43.716 | II |
| SWIRE_J104321.34+590943.0 | 1227 36 | 1980 58 | 993 34 | 1092 63 | 0.45 | 2.294 | 0.1 | 2.9 | 46.108 | III |
| SWIRE_J104353.42+585316.2 | 49 8 | 84 14 | 25 7 | 95 22 | 0.14 | 0.563fffootnotemark: | 1.4 | 4.5 | 43.380 | III |
| SWIRE_J104432.03+590457.7 | 134 14 | 230 23 | 83 12 | 221 34 | 0.04 | 0.896 | 0.9 | 4.9 | 44.308 | III |
| SWIRE_J104500.71+591353.4 | 16 5 | 29 9 | 9 5 | 32 15 | 0.11 | 0.700 | 1.3 | 5.3 | 43.161 | III |
| SWIRE_J104616.93+585457.1 | 49 8 | 84 15 | 37 8 | 62 19 | 0.27 | 0.705 | 0.4 | 1.8 | 43.494 | III |
| SWIRE_J104641.38+585213.9 | 12 5 | 19 8 | 9 5 | 14 12 | 0.26 | 1.095 | 0.4 | 3.1 | 43.367 | III |
| SWIRE_J104644.18+590027.8 | 33 7 | 56 12 | 23 7 | 46 17 | 0.19 | 2.542fffootnotemark: | 0.6 | 15.7 | 44.976 | III |
| SWIRE_J104749.61+584845.7 | 45 8 | 75 14 | 39 8 | 37 16 | 0.50 | 0.695 | 0.05 | 0.2 | 43.237 | III |
| SWIRE_J104826.99+585438.8 | 16 5 | 27 9 | 8 5 | 30 14 | 0.10 | 1.410 | 1.3 | 12.8 | 44.019 | III |
| SWIRE_J104913.37+585946.3 | 39 9 | 65 15 | 21 7 | 70 23 | 0.07 | 3.435 | 1.2 | 58.8 | 45.861 | III |
| SWIRE_J104241.45+591357.2 | 28 7 | 45 12 | 23 7 | 22 15 | 0.51 | 1.434 | 0.04 | 0.4 | 43.812 | IV |
| SWIRE_J104254.46+591013.3 | 32 7 | 52 11 | 18 6 | 53 17 | 0.03 | 1.541 | 1.1 | 12.3 | 44.385 | IV |
| SWIRE_J104420.22+583948.0 | 56 9 | 97 15 | 30 7 | 107 23 | 0.11 | 1.700 | 1.3 | 17.5 | 44.842 | IV |
| SWIRE_J104528.29+591326.7 | 18 5 | 31 10 | 9 5 | 35 15 | 0.16 | 0.669 | 1.5 | 5.5 | 43.153 | IV |
| SWIRE_J104733.46+592108.1 | 40 8 | 70 13 | 40 8 | 24 14 | 0.65 | 1.107 | 0.1 | 0.1 | 43.628 | IV |
| SWIRE_J104736.92+591941.3 | 9 4 | 15 8 | 9 5 | 6 10 | 0.60 | 1.543 | 0.1 | 0.1 | 43.332 | IV |
| SWIRE_J104754.78+590810.4 | 16 5 | 25 9 | 14 5 | 11 11 | 0.57 | 1.826 | 0.1 | 0.1 | 43.728 | IV |
| SWIRE_J104813.49+590340.7 | 17 5 | 28 9 | 17 6 | 6 10 | 0.79 | 1.818 | 0.1 | 0.1 | 43.769 | IV |
| SWIRE_J104303.50+585718.1 | 14 7 | 24 11 | 3 5 | 38 19 | 0.60 | 0.595 | 3.6 | 12.0 | 43.073 | V |
| SWIRE_J104351.87+584953.7 | 44 8 | 75 14 | 10 5 | 121 25 | 0.61 | 0.609fffootnotemark: | 3.6 | 12.5 | 43.605 | V |
| SWIRE_J104407.97+584437.0 | 48 8 | 83 14 | 30 8 | 81 21 | 0.03 | 0.555fffootnotemark: | 1.0 | 3.0 | 43.306 | V |
| SWIRE_J104422.64+591304.1 | 800 29 | 1292 48 | 649 28 | 711 52 | 0.45 | 0.323 | 0.1 | 0.3 | 43.730 | V |
| SWIRE_J104503.56+585109.9 | 29 8 | 49 14 | 18 7 | 45 20 | 0.08 | 0.981 | 0.8 | 4.9 | 43.729 | V |
| SWIRE_J104504.96+585947.3 | 59 9 | 102 16 | 3 5 | 193 31 | 0.90 | 0.214fffootnotemark: | 8.7 | 14.3 | 42.736 | V |
| SWIRE_J104532.93+584638.6 | 101 12 | 176 20 | 98 12 | 69 22 | 0.60 | 1.781 | 0.1 | 0.1 | 44.545 | V |
| SWIRE_J104725.94+591025.5 | 136 13 | 219 21 | 116 13 | 102 23 | 0.54 | 0.668 | 0.1 | 0.1 | 43.585 | V |
| SWIRE_J104731.84+592432.9 | 31 7 | 55 12 | 24 7 | 40 17 | 0.28 | 3.108 | 0.4 | 16.6 | 45.174 | V |
| SWIRE_J104748.27+590534.7 | 15 5 | 24 9 | 12 5 | 14 12 | 0.43 | 1.041 | 0.2 | 1.1 | 43.292 | V |
| SWIRE_J104829.49+591249.1 | 67 10 | 108 16 | 50 9 | 72 21 | 0.33 | 0.280 | 0.3 | 0.6 | 42.577 | V |
| Observed | Rest-frame | Magnitude | Flux Density | Instrument |
|---|---|---|---|---|
| Bandpass | Bandpass | (Vega) | (erg cm-2 s-1/Jy) | |
| 0.32.5 keV | 1.18.8 keV | ( 2 3) | Chandra/ACIS | |
| 2.58.0 keV | 8.828.3 keV | (3315) | Chandra/ACIS | |
| 0.38.0 keV | 1.128.3 keV | (19 8) | Chandra/ACIS | |
| 3647 Å | 1031 Å | 24.290.10 | 0.3690.033 | KPNO/Mosaic |
| 4782 Å | 1351 Å | 24.000.07 | 0.9830.060 | KPNO/Mosaic |
| 6288 Å | 1777 Å | 23.550.04 | 1.1660.040 | KPNO/Mosaic |
| 7665 Å | 2166 Å | 23.220.07 | 1.2790.071 | KPNO/Mosaic |
| 2.153m | 6085 Å | 19.370.14 | 10.551.42 | Palomar/WIRC |
| 3.6 m | 1.01 m | 65.50.9 | Spitzer/IRAC | |
| 4.5 m | 1.27 m | 1522 | Spitzer/IRAC | |
| 5.8 m | 1.61 m | 4015 | Spitzer/IRAC | |
| 8.0 m | 2.25 m | 10826 | Spitzer/IRAC | |
| 24. m | 6.74 m | 401120 | Spitzer/MIPS | |
| 1.4 GHz | 4.95 GHz | 27315 | VLA |
| Observed | Rest-frame | Magnitude | Flux Density | Instrument |
|---|---|---|---|---|
| Bandpass | Bandpass | (Vega) | (erg cm-2 s-1/Jy) | |
| 0.32.5 keV | 1.038.6 keV | ( 4 4) | Chandra/ACIS | |
| 2.58.0 keV | 8.627.4 keV | (6320) | Chandra/ACIS | |
| 0.38.0 keV | 1.0327.4 keV | (3710) | Chandra/ACIS | |
| 3647 Å | 1063 Å | 24.270.17 | 0.3760.033 | KPNO/Mosaic |
| 4782 Å | 1394 Å | 23.680.05 | 1.3230.060 | KPNO/Mosaic |
| 6288 Å | 1833 Å | 23.350.06 | 1.4070.040 | KPNO/Mosaic |
| 7665 Å | 2235 Å | 22.760.13 | 1.9540.071 | KPNO/Mosaic |
| 2.153m | 6278 Å | 18.590.17 | 24.523.25 | Palomar/WIRC |
| 3.6 m | 1.04 m | 53.41.3 | Spitzer/IRAC | |
| 4.5 m | 1.31 m | 67.61.2 | Spitzer/IRAC | |
| 5.8 m | 1.66 m | 1317 | Spitzer/IRAC | |
| 8.0 m | 2.32 m | 2445 | Spitzer/IRAC | |
| 24. m | 6.95 m | 109918 | Spitzer/MIPS | |
| 1.4 GHz | 4.95 GHz | 162 | VLA |
| Flux | FWHM | ||||
|---|---|---|---|---|---|
| Line | (Å) | Redshift | ( ) | () | (Å) |
| LyaaGaussian fit to narrow component | 4304.5 | 2.540 | 12.51.3 | 132480 | 10511 |
| N V 1240aaGaussian fit to narrow component | 4389.5 | 2.540 | 1.880.56 | 1366300 | 165 |
| C IV 1549aaGaussian fit to narrow component | 5479.3 | 2.537 | 2.230.45 | 1367200 | 214 |
| Ly/N V 1240bbTotal integration. | 23.02.3 | 31131 | |||
| Si IV/O IV] 1400bbTotal integration. | 2.340.47 | 296 | |||
| C IV 1549bbTotal integration. | 4.150.62 | 396 |
Note. — Rest-frame equivalent widths assume .
| Flux | FWHM | ||||
|---|---|---|---|---|---|
| Line | (Å) | Redshift | ( ) | () | (Å) |
| Ly | 4171.3 | 2.431 | 14.91.5 | 136020 | 18418 |
| N V 1240 | 4254.8 | 2.431 | 9.820.29 | 203740 | 1204 |
| Si IV 1397 | 4777.4 | 2.430 | 1.150.35 | 1684200 | 165 |
| O IV] 1402 | 4809.4 | 2.430 | 1.230.12 | 1120100 | 172 |
| C IV 1549 | 5310.7 | 2.428 | 7.140.14 | 148560 | 862 |
| He II 1640 | 5618.9 | 2.425 | 1.500.08 | 1278100 | 201 |
Note. — All parameters are derived for Gaussian fits. Rest-frame equivalent widths assume .
| Source Name | Sequence No. | OBSID | Date | Exp. Time |
|---|---|---|---|---|
| (ksec) | ||||
| SW104406 | 900331 | 5024 | 16 Sept 2004 | 57.97 |
| SW104409 | 900334 | 5027 | 20 Sept 2004 | 67.96 |
| Source Name | aa Derived assuming the model shown in Figure 9 for SW104409 and in Figure 11 for SW104406. | aa Derived assuming the model shown in Figure 9 for SW104409 and in Figure 11 for SW104406. | aa Derived assuming the model shown in Figure 9 for SW104409 and in Figure 11 for SW104406. | bb Absorption-corrected X-ray luminosity between 0.3 and 8 keV. | cc Bolometric luminosity derived as the sum of , and if available. The value in parenthesis does not include the luminosity emitted at 10µm and was obtained by replacing with in the calculation. | dd Black-hole mass derived from and assuming that the source is accreting at the Eddington limit. The value in parenthesis was derived using the value shown in parenthesis in column 7. | eeSpectroscopic . Photometric are reported in Table 4. | |
|---|---|---|---|---|---|---|---|---|
| 1.4 GHz | M⊙ | M⊙ | ||||||
| SW104406 | 40.07 | 45.48 | 46.08 | 46.14 | 45.74 | 46.29 (45.93) | 1.4 (0.7) | 3.4 (1.5) |
| SW104409 | 40.32 | 47.19 | 47.53 | 47.58 | 45.64 | 47.59 (47.21) | 29.9 (12.4) | 68 (28) |
Note. — All luminosities are in logarithmic scale and units of . See section 6 for more details.