Interferometric Images of High Redshift Submillimeter Galaxies
Abstract
We present high resolution images of two 20 mJy submillimeter galaxies, SMMJ123711+622212 and MIPS J142824.0+352619, obtained using the Submillimeter Array (SMA). Using submillimeter interferometric observations with an angular resolution of , the coordinates of these high redshift sources are determined with an accuracy of . The new SMA data on SMMJ123711+622212 reveal an unresolved submm source offset to the east by from an optical galaxy found in deep images, suggesting either a large galaxy with a dusty central region, or an interacting galaxy system. The SMA image of hyper-luminous (L L⊙) source MIPS J142824.0+352619 provides a firm upper limit to the source size of . This constraint provides evidence that the foreground lens is only weakly affecting the observed high FIR luminosity.
1 Introduction
The discovery of high redshift submillimeter sources has significantly improved our understanding of the star formation history in the early universe. Negative k-correction allows observation of the thermal dust emission at almost independent of the redshift up to (Blain et al., 2002). Deep observations using the SCUBA bolometer on the James Clerk Maxwell Telescope (JCMT) have unveiled the presence of distant submm sources (Smail, Ivison & Blain, 1997; Barger et al., 1998; Hughes et al., 1998; Eales et al., 2000; Cowie, Barger & Kneib, 2002; Scott et al., 2002; Borys et al., 2003; Webb et al., 2003; Wang, Cowie & Barger, 2004). The primary origin of the submm emission is believed to be the reprocessed dust emission from newborn stars in young galaxies. While these discoveries are attended by a great number of high resolution follow-up optical/NIR imaging studies, the resolution of the JCMT at 850 yields a large error circle which is too coarse for a precise determination of the optical/NIR counterparts to these sources. Deep optical imaging typically shows several optical/NIR sources within the SCUBA beam. To date, the most successful ways to obtain precise astrometry on the target are to obtain high resolution, deep 1.4 GHz radio images (Ivison et al., 1998; Barger, Cowie & Richards, 2000; Chapman et al., 2001; Ivison et al., 2002; Dunlop et al., 2004), or to obtain interferometric 1.3 mm continuum images (e.g. Downes et al., 1999). The former, however, does not identify robust optical/NIR counterparts for all of the sources, revealing counterparts for of the mJy sources with Jy (e.g. Ivison et al., 2002; Chapman et al., 2003; Borys et al., 2004; Greve et al., 2004; Wang, Cowie & Barger, 2004). Precise astrometry obtained using mm or submm interferometers can unambiguously identify the correct counterpart for the remaining radio-faint sources, and sources with multiple radio counterparts. High angular resolution submm observations also allow us to understand the true nature of the submm sources with established optical counterparts in which gravitational lensing is a possibility.
We present recent Submillimeter Array (SMA; Ho, Moran & Lo, 2004) detections of two mJy sources, SMMJ123711+622212 (hereafter GN 20; Pope et al., 2005) and MIPS J142824.0+352619 (hereafter MIPS-J1428; Borys et al., 2005). The 20.3 mJy source GN 20 was discovered in the recent SCUBA observations of the GOODS North Field (Giavalisco et al., 2004). GN 20, with its detection (Pope et al., 2005) and 1.3 mm detection at IRAM PdBI (Pope et al. in preparation) make this one of the strongest submm sources discovered to date. It has very weak radio and undetectable emission, suggesting it lies at high redshift. MIPS-J1428 was discovered in the Spitzer MIPS images of the NDWFS Boötes field (Jannuzi & Dey, 1999; Soifer et al., 2004). It was detected (Borys et al., 2005) at using SHARC-II (Dowell et al., 2003) on the CSO, 1.4 GHz radio continuum at the VLA, and subsequent followup observations (Borys et al., 2005) revealed that it is an extremely luminous starburst dominated galaxy at . Recent Keck-DEIMOS spectroscopy has revealed a galaxy directly aligned with MIPS-J1428 (Borys et al., 2005), possibly lensing it. High angular resolution submm observations allow us to determine whether or not the submm emission is coincident with the optical emission, and thereby search for any evidence for amplification of the FIR luminosity by gravitational lensing. We adopt km s-1 Mpc-1, = 0.3, = 0.7.
2 Observation and Data Reduction
GN 20 was observed on February 20 (track 1) and March 5, 2005 (track 2), and MIPS-J1428 was observed on March 8 (track 3) and April 4 (track 4), 2005 using 5 – 7 antennas in the compact configuration of the SMA. The SIS receivers were tuned to a center frequency of 342.883 GHz in the upper sideband (USB), yielding 332.639 GHz in the lower sideband (LSB). This tuning frequency was chosen to facilitate the receiver tuning and to achieve the optimal receiver performance. The target coordinates were obtained from the 1.3 mm IRAM PdBI detection of GN 20 ( (J2000) , (J2000) ; Pope et al. in preparation), and the position of the proposed MIR galaxy of MIPS-J1428 ( (J2000) , (J2000) ; Borys et al., 2005). All tracks were taken under good atmospheric opacity (i.e. – ).
The SMA data were calibrated using the Caltech software package MIR, modified for the SMA. Antenna based passband calibration was done using all of the planets and bright QSOs observed in a given track. For GN 20, antenna based time-dependent phase calibration was done using 1153+495, a 0.7 Jy QSO 14∘ away from the target. In addition, a 0.6 Jy QSO near GN 20, 1048+717 (14∘ from GN 20, 23∘ from 1153+495) was observed for a total of 12 minutes during each track. The detection of 1048+717 at the phase center empirically verifies and constrains the accuracy of the phase calibration referenced to 1153+495 (see §3). Similarly for the MIPS-J1428 tracks, two QSOs 1310+323 (0.6 Jy; 16∘ away from MIPS-J1428) and 1635+381 (1.0 Jy; 25∘ away from MIPS-J1428) were used together to calibrate the time dependent phase, and 1419+543 (0.4 Jy; 3∘ away from MIPS-J1428) was used to check the astrometry. Finally, absolute flux calibration was performed using Callisto and Mars. Imaging was carried out in MIRIAD (Sault, Teuben & Wright, 1995). Maximum sensitivity was achieved by adopting natural weighting, which gave a synthesized beam size of (P.A.= ) for GN 20 and (P.A. = ) for MIPS-J1428. The rms noise after combining the two sidebands in two tracks was 2.1 mJy (GN 20) and 2.2 mJy (MIPS-J1428).
3 Results and Discussion
3.1 SMMJ123711+622212 (GN 20)
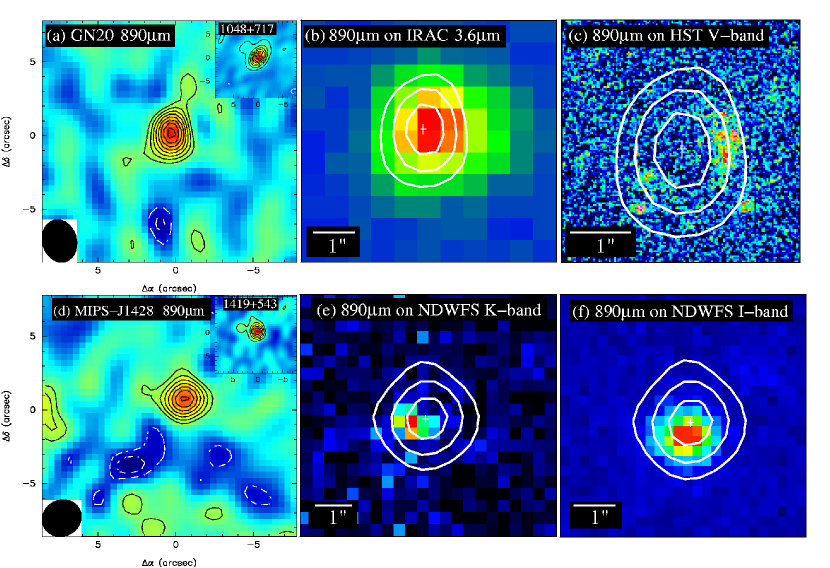
The SMA image of GN 20 is shown in Figure 1 (a). The real part of the visibility amplitudes do not decline as a function of projected baseline length, indicating that the emission is not spatially resolved (Figure 2). The upper limit on the source size is . The derived total flux from a point source model is mJy, consistent with the flux of mJy extrapolated from the SCUBA flux of mJy (Pope et al., 2005). The derived coordinates for GN 20 are (J2000) , (J2000) , with statistical uncertainties in the fit of for both and . These are consistent with estimated errors of in and in from a detection and a beam of .
In order to check the robustness of our phase calibration and to estimate the systematic uncertainties in the SMA astrometry, we have imaged the test QSO (1048+717) using the same phase calibration we used to map GN 20. The resultant QSO map after adding the two sidebands and two tracks is shown in Figure 1 (a)(inset). A point source fit to the visibilities of 1048+717 gave a positional offset from the phase center of and . The coordinates of this and all of the QSOs used in these observations were adopted from the Radio Reference Frame (Johnston et al., 1995), which are accurate to better than 3 mas. Hence the precise detection of 1048+717 at the phase center ensures that our phase calibration referenced to 1154+379 is robust.
As an additional check, we fit a point source model to the visibilities of 1048+717 in each sideband of each track separately. The results show that the offsets from the phase center are consistent among the different sidebands and tracks in R.A. ( – ), and slightly larger in Dec. for track 2 ( – ), and a factor 10 larger in Dec. for track 1 (). The overall average offset from the phase center is and . The uncertainties in Dec. in track 2 are larger than the uncertainties in R.A. due to beam elongation in the north-south direction, while the source of the factor 10 larger error in track 1 is not obvious from the data. These errors are consistent with the uncertainties of – expected from a maximum baseline error of at 230 GHz using a phase calibrator that is away from the target. These systematic tests prove the robustness of our phase calibration in each track and lend high confidence to the resulting positional accuracy of in R.A. and – in Dec. for GN 20.
The new astrometric coordinates allow us to compare the submm source with high resolution images in the publicly available deep IRAC (Fazio et al., 2004) (Figure 1 (b)) and ACS (Ford et al., 1998) (Figure 1 (c)) images of the GOODS North Field. The absolute astrometric accuracy of both of these images is , and they are both tied to the coordinate frame defined by the VLA positions in Richards (2000)111After applying the known positional offset in Dec. of between the GOODS-N images and the VLA catalog positions. See http://data.spitzer.caltech.edu/popular/goods/Documents/ for details.. The IRAC 3.6 image reveals a source centered west of the submm coordinates, while the higher resolution -band image reveals a faint optical source to the west. From the analysis of available ACS images, it is found that this optical source is a B-dropout galaxy (, , ) which gives constraints on the probable redshift to be –4. We believe that the offset between the SMA position and the HST position is significant, and there are several possible astrophysical explanations for this difference. The submm emission may arise from part of a large galaxy where -band emission is completely obscured. Alternatively, GN 20 might be an interacting system where the optical galaxy is a companion to the dusty, more actively star forming galaxy. Although the observed FIR luminosities are significantly different, the apparent separation of these galaxies ( kpc at ) suggest a close similarity to the Antennae system (NGC 4038/39), where the optical galaxies are separated by 7.5 kpc and most of the starburst activity is occurring in the medium between the two galaxies (e.g. Wang et al., 2004).
GN 20 was suggested to be a two component source, GN 20.1 (20.3 mJy) and GN 20.2 (11.7 mJy), separated by (140 kpc) in the low resolution SCUBA image (Pope et al., 2005). The flux agreement between our SMA observation and the SCUBA measurement of GN 20.1 implies that GN 20 may be a two component source. However, the suggested position of GN 20.2 is beyond the half power point of the SMA primary beam, where the sensitivity is reduced by more than a factor of two. Detailed discussion in the context of multi-wavelength observations of this source will be provided in a forthcoming paper (Pope et al. in preparation).
3.2 MIPS J142824.0+352619 (MIPS-J1428)
The SMA map of MIPS-J1428 is shown in Figure 1 (d). The derived total flux is mJy and shows excellent agreement with the flux of mJy extrapolated from the SCUBA flux of mJy. MIPS-J1428 is not spatially resolved with the beam (see Figure 2), and the derived coordinates from a point source fit are , , with uncertainties in the fit of for both and . The strong detection allows us to make a higher resolution image using the visibilities of the longest baselines. The resulting unresolved image provides a firm upper limit to the source size of (10 kpc at ), which is smaller than the size constraint given by the VLA 1.4 GHz resolution.
The map of the test QSO 1419+543 after adding the two sidebands and two tracks is shown in Figure 1 (d) (inset). A point source fit to the visibilities gave a positional offset from the phase center of and for 1419+543. As with 1048+717 for GN 20, we fit a point source model to the visibilities of 1419+543 in each sideband of each track separately. The results show that the offsets from the phase center had a wide range of values ( and ) with the overall average offset from the phase center of and . These uncertainties are larger than those found in 1048+717 for GN 20, and are slightly larger than the uncertainties expected from baseline errors. It is possible that other factors such as image smearing due to large phase noise may have introduced a small error in the source positions. Thus, we assess an uncertainty of in R.A. and in Dec. for MIPS-J1428.
Figure 1 (e) and (f) show the SMA contours of MIPS-J1428 overlaid on the NOAO Deep Wide Field Survey K-band and I-band images. The astrometry of both of these images is tied to the reference frame defined by the USNO-A2.0 catalog, and the typical rms of the residuals is (Jannuzi et al., 2005). The optical/NIR galaxy seen here is unambiguously the galaxy aligned with the strong submm emission. The accurate astrometry of the submm emission provided by the SMA allows tight constraints on the separation between the bright optical/NIR position, and rules out fainter IRAC sources detected nearby (Borys et al., 2005). Hence MIPS-J1428 could lie directly behind the foreground galaxy, which would potentially result in a large amplification of the submm source. Borys et al. (2005) use size/luminosity relationships to argue that despite the alignment, the amplification is likely modest since the Einstein ring is of comparable size to the known physical scales of local ULIRGs. Assuming that the lensing is modest, the size is comparable to that of other high-redshift submm sources (Chapman et al., 2004). Using the star-formation rate estimated in Borys et al. (2005), our limit on the angular size, , of the object, we derive a lower limit on the SFR density of M⊙yr-1kpc-2 where is the lensing amplification. This is larger than local ULIRGs (Meurer et al., 1997) and comparable to other high-redshift submm galaxies (Chapman et al., 2004).
4 Summary
We present SMA observations of two 20 mJy submm sources, GN 20 and MIPS-J1428. The positions of the submm sources are determined with accuracy with these data, allowing precise identification of the correct optical galaxy counterpart to the bright submm emission in GN 20, and providing evidence that the foreground lens is only weakly affecting the observed high FIR luminosity in MIPS-J1428. If many of the bright submm galaxies are slightly lensed objects similar to MIPS-J1428, then the implied source counts of inherently bright submm galaxies are over-predicted. Detailed studies, however, exist for only a few sources, and future surveys such as SHADES (Mortier et al., 2005) will provide important information about the star formation properties at high-redshifts.
The Submillimeter Array is a joint project between the Smithsonian Astrophysical Observatory and the Academia Sinica Institute of Astronomy and Astrophysics, and is funded by the Smithsonian Institution and the Academia Sinica. This work made use of observations made with the Spitzer Space Telescope, which is operated by JPL, California Institute of Technology under NASA contract 1407. This work made use of images provided by the NOAO Deep Wide-Field Survey (Jannuzi & Dey, 1999) which is supported by the National Optical Astronomy Observatory (NOAO). NOAO is operated by AURA, Inc., under a cooperative agreement with the National Science Foundation.
References
- Alexander et al. (2003) Alexander, D. M., et al. 2003, AJ, 126, 539
- Barger et al. (1998) Barger, A. J., et al. 1998, Nature, 394, 248
- Barger, Cowie & Richards (2000) Barger, A. J., Cowie, L. L. & Richards, E. A. 2000, AJ, 119, 2092
- Borys et al. (2003) Borys, C., Chapman, S., Halpern, M. & Scott, D. 2003, MNRAS, 344, 385
- Borys et al. (2004) Borys, C., et al. 2004, MNRAS, 352, 759
- Borys et al. (2005) Borys, C., et al., 2005, ApJ, accepted (astro-ph/0509361)
- Blain et al. (2002) Blain, A. W., Smail, I., Ivison, R. J., Kneib, J. -P. & Frayer, D. T. 2002, PhR, 369, 111
- Chapman et al. (2001) Chapman, S. C., Richards, E. A., Lewis, G. F., Wilson, G. & Barger, A. J. 2001, ApJ, 548, 147
- Chapman et al. (2003) Chapman, S. C., et al. 2003, ApJ, 585, 57
- Chapman et al. (2004) Chapman, S. C., Smail, I., Windhorst , R., Muxlow, T., & Ivison, R. J. 2004, ApJ, 611, 732
- Cowie, Barger & Kneib (2002) Cowie, L. L., Barger, A. J. & Kneib, J. -P. 2002, AJ, 123, 2197
- Dowell et al. (2003) Dowell et al. 2003, SPIE, 4855, 73
- Downes et al. (1999) Downes et al. 1999, A&A, 347, 809
- Dunlop et al. (2004) Dunlop et al. 2004, MNRAS, 350, 769
- Eales et al. (2000) Eales, S., Lilly, S., Webb, T., Dunne, L., Gear, W., Clements, D. & Yun, M. S. 2000, AJ, 120, 2244
- Fazio et al. (2004) Fazio, G. G. et al. 2004, ApJS, 154, 10
- Ford et al. (1998) Ford, H. C. et al. 1998, SPIE, 3356, 234
- Greve et al. (2004) Greve, T. R., Ivison, R. J., Bertoldi, F., Stevens, J. A., Dunlop, J. S., Lutz, D. & Carilli, C. L. 2004, MNRAS, 354, 779
- Giavalisco et al. (2004) Giavalisco M. et al. 2004, ApJ, 600, L93
- Ho, Moran & Lo (2004) Ho, P. T. P., Moran, J. M. & Lo, K. Y. 2004, ApJ, 616, 1
- Hughes et al. (1998) Hughes, D. H., et al. 1998, Nature, 394, 241
- Ivison et al. (1998) Ivison, R. J., et al. 1998, MNRAS, 298, 583
- Ivison et al. (2002) Ivison, R. J., et al. 2002, MNRAS, 337, 1
- Jannuzi & Dey (1999) Jannuzi, B. T. & Dey, A., 1999, in ”Photometric Redshifts and the Detection of High Redshift Galaxies”, ASP Conference Series, Vol. 191, Edited by R. Weymann, L. Storrie-Lombardi, M. Sawicki, and R. Brunner. ISBN: 158381-017-X, p. 111
- Jannuzi et al. (2005) Jannuzi, B. T. et al. 2005, in prep.
- Johnston et al. (1995) Johnston, K. J. et al. 1995, AJ, 110, 880
- Meurer et al. (1997) Meurer, G. R., Heckman, T. M., Lehnert , M. D., Leitherer, C., & Lowenthal, J., 1997, AJ, 114, 54
- Mortier et al. (2005) Mortier, A. M. J., et al. 2005, MNRAS in press
- Pope et al. (2005) Pope, A., Borys, C., Scott, D., Conselice, C., Dickinson, M. & Mobasher, B. 2005, MNRAS, 358, 149
- Richards (2000) Richards, E. A. 2000, ApJ, 533, 611
- Sault, Teuben & Wright (1995) Sault, R. J., Teuben, P. J., & Wright, M. C. H. 1995, in ASP Conf. Ser. 77, Astronomical Data Analysis Software and Systems IV, ed. R. A. Shaw, H.E. Payne, & J. J. E. Haynes (San Francisco:ASP), 433
- Scott et al. (2002) Scott et al. 2002, MNRAS, 331, 817
- Soifer et al. (2004) Soifer, B. T., Spitzer/NOAO Team, 2004, AAS, 204, 4805
- Smail, Ivison & Blain (1997) Smail, I., Ivison, R. J. & Blain, A. W. 1997, ApJ, 490, 5
- Wang, Cowie & Barger (2004) Wang, W.-H., Cowie, L. L. & Barger, A. J. 2004, ApJ, 613, 655
- Wang et al. (2004) Wang, Z., et al. 2004, ApJS, 154, 193
- Webb et al. (2003) Webb, T. M., et al. 2003, ApJ, 587, 41