The Evolution of Galaxy Mergers and Morphology
at in the Extended Groth Strip
Abstract
We present the quantitative rest-frame morphological evolution and galaxy merger fractions at as observed by the All-wavelength Extended Groth Strip International Survey (AEGIS). We use the Gini coefficent and to identify major mergers and classify galaxy morphology for a volume-limited sample of 3009 galaxies brighter than , assuming pure luminosity evolution of 1.3 per unit redshift. We find that the merger fraction remains roughly constant at % for . The fraction of E/S0/Sa increases from % at to % at , while the fraction of Sb-Ir decreases from % at to % at . The majority of Spitzer MIPS 24 m sources with L(IR) are disk galaxies, and only 15% are classified as major merger candidates. Edge-on and dusty disk galaxies (Sb-Ir) are almost a third of the red sequence at , while E/S0/Sa make up over 90% of the red sequence at . Approximately 2% of our full sample are red mergers. We conclude (1) the merger rate does not evolve strongly between ; (2) the decrease in the volume-averaged star-formation rate density since is a result of declining star-formation in disk galaxies rather than a disappearing population of major mergers; (3) the build-up of the red sequence at can be explained by a doubling in the number of spheroidal galaxies since .
Subject headings:
galaxies:evolution – galaxies:high-redshift – galaxies:interacting – galaxies:structure1. INTRODUCTION
Although the evidence for a cold dark-matter dominated universe in which structure grows hierarchically is overwhelming (e.g. Spergel et al. 2003, 2007), the role of mergers in galaxy assembly and star-formation remains unclear. Simulations of major mergers (Mihos & Hernquist 1996; Cox et al. 2006), and observations of local gas-rich mergers (e.g., the Antennae; Schweizer 1982) indicate that the merger process can trigger violent starbursts and transform disks into spheroids. The correlation between galaxy morphology and color (e.g., de Vaucouleurs 1961; Blanton et al. 2003) suggests that a galaxy’s star-formation history is closely tied to its morphological evolution. However, recently it has been recognized that there may be different timescales for the formation of stars and the assembly of those stars into massive spheroidals (e.g., Kauffmann & Charlot 1998; De Lucia et al. 2006). Moreover, mergers may be not the only way to produce spheroids – galaxy harassment, virial shock heating, and explosive feedback from active galactic nuclei could all result in spheroidal galaxies (e.g. Moore, Lake, & Katz et al. 1998, Birnboim, Dekel & Neistein 2007; Hopkins et al. 2006). Tracking the galaxy merger rate and the evolution of galaxy morphology as a function of redshift and color can constrain the contribution of mergers to the formation of stars and spheroidal systems.
The galaxy merger rate is estimated from the number density of morphologically disturbed galaxies or kinematically close pairs. Accurate merger rates from kinematic pair statistics are challenging, requiring spectroscopic velocities for both companions, and are therefore observationally expensive and suffer from incompleteness. Recent work has attempted to derive the close pair statistics from the two-point correlation function of large numbers of galaxies (Masjedi et al. 2006; Bell et al. 2006b), which also requires high quality redshifts and suffers from sampling problems at very small scales. Morphology studies, especially with deep and high resolution Hubble Space Telescope () images, do not suffer from the same incompleteness problems, yet the morphological merger fraction is also elusive. Morphological disturbances which are the result of recent or on-going mergers can be determined via visual classifications or by identifying outliers in quantitative morphology distributions. The visual classification of galaxy morphology is time-consuming and subjective. Also, not all visually ‘peculiar’ galaxies are necessarily major mergers (e.g. some are irregulars) and high-redshift disks are more likely to be mis-classified as peculiars due to surface-brightness effects and wavelength-dependent morphologies (Brinchmann et al. 1998; Marcum et al. 2001; Windhorst et al. 2002; Papovich et al. 2003; Kampczyk et al. 2007). Automated morphological analysis is a promising technique for identifying mergers that has developed in recent years (e.g. Abraham et al. 1996, Conselice et al. 2003, Lotz et al. 2004, Scarlata et al. 2007a). Most previous quantitative morphology studies aimed at finding merger candidates have used concentration and asymmetry measurements (e.g. Abraham et al. 1996; Conselice et al. 2003; Cassata et al. 2005; Menanteau et al. 2006). However, asymmetry measures are less sensitive to merger remnants in late stages, and require high signal-to-noise images to overcome noisy background residuals. In this paper, we use the Gini coefficient () and the second-order moment of the brightest 20% of a galaxy’s pixels () which has been shown to be more effective than concentration and asymmetry at identifying late-stage mergers and classifying galaxies (Lotz, Primack, & Madau 2004, hereafter LPM04). The Gini coefficient and are also more robust at low signal-to-noise ratios (LPM04; Lotz et al. 2006). Recent attempts to combine , , , and using a principal component analysis also have yielded promising results (Scarlata et al. 2007a).
The initial results of morphological studies revealed a population of visually disturbed, star-forming galaxies (Driver et al. 1995; Glazebrook et al. 1995; Abraham et. al 1996). This discovery led to the claim that the increase in the volume-averaged star-formation rate density from to (e.g., Lilly et al. 1996; Madau et al. 1996; Hopkins 2004) was partially the result of a dramatic increase in the merger rate at higher redshift (Le Fèvre et al. 2000; Bridge et al. 2007). Pair count studies also indicated strong evolution in the number of close pairs at (Patton et. al. 2002; Le Fèvre et al. 2000 but see Carlberg et al. 2000 and Lin et al. 2004). However, these results suffered from cosmic variance and small-number statistics (typically tens of merger candidates in a sample of a few hundred).
With recent Spitzer Space Telescope infrared surveys and high-resolution Hubble Space Telescope () morphologies, the conclusion that high-redshift star formation is driven by mergers has been re-examined. Infrared luminous galaxies dominate the star-formation density at (Le Floc’h et al. 2005), but the trigger for their star-formation remains strongly debated. The majority of these galaxies at have been visually classified as spirals, not peculiars or mergers (Flores et al. 1999; Bell et al. 2005; Melbourne, Koo, & Le Floc’h 2005). However, these galaxies have higher asymmetries than normal spirals (Shi et al. 2006; Bridge et al. 2007) and may be more likely to be found in interacting close pairs (Lin et al. 2007; Bridge et al. 2007).
Another question the merger rate may address is the formation of red spheroidal galaxies. Recent studies have shown that the color distribution of galaxies out to is bi-modal, and that the number density of luminous red galaxies has increased by a factor of 2-4 since (Bell et al. 2004a; Faber et al. 2007; Brown et al. 2007), implying a large influx of red galaxies. The majority of red galaxies at are spheroid-dominated systems (Blanton et al. 2003; Bell et al. 2004b; Weiner et al. 2005; Scarlata et al. 2007b). Several mechanisms may be responsible for moving galaxies onto and along the red sequence, including merging of massive gas-rich galaxies, the “quenching” of disk galaxies via gas-stripping or AGN feedback, and the merging of red galaxies (Bell et al. 2004a; Faber et al. 2007). A number of low redshift E/S0 show residual disturbances (e.g., van Dokkum 2005; Schweizer et al. 1990), suggesting that many have experienced mergers in previous Gyr. However, the amount of stellar mass in massive spheroids appears to have changed very little since (Bundy et al. 2005; Brinchmann & Ellis 2000), although there is evidence that less massive early-types may have assembled more recently (Bundy et al. 2005; Treu et al. 2005; Papovich et al. 2006).
In this paper, we apply a new method for identifying major merger candidates to the recent Survey of the Extended Groth Strip (EGS), which is part of the All-Wavelength Extended Groth strip International Survey (AEGIS) collaboration (Davis et al. 2007). We use the Gini coefficient , which is a measure of the relative distribution of galaxy pixel flux values, and , the relative second-order moment of the brightest 20% of a galaxy’s pixels, to classify galaxies as major mergers, E/S0/Sa, or Sb/Sc/Ir out to . In our previous work, we have demonstrated that and are robust morphological classifiers for galaxies as distant as (Lotz et al. 2006), and are an effective way to find major merger candidates (LPM04). Using spectroscopic redshifts from the DEEP2 survey and photometric redshifts from the Canada-France-Hawaii Telescope Legacy Survey (CFHTLS), we construct a volume-limited sample of 3009 galaxies brighter than at , assuming pure luminosity evolution of 1.3 per unit redshift (Faber et al. 2007). We identify 312 merger candidates brighter than and find that the fraction of major merger candidates is roughly constant at 10% for for both samples. We discuss the evolution of morphology for the bright galaxy population, luminous infrared galaxies, and the red sequence, and the implications for the build up of red spheroidals at . Throughout this paper, we use the term “morphologically disturbed” to refer to objects whose visual or quantitative morphologies classify them as merger candidates. We use the term “morphological merger fraction” and “fraction of morphologically disturbed objects” interchangeably to refer to the fraction of merger candidates identified via their morphologies as opposed to the merger fraction determined by close pair statistics. We adopt a , , cosmology throughout this work.
2. Extended Groth Strip Observations
2.1. ACS imaging and morphologies
Deep images of the EGS were taken with the Advanced Camera for Surveys (ACS) as part of GO Program 10134 (PI M. Davis; Davis et al. 2007) and the AEGIS collaboration. The EGS was imaged in (F606W, 2260s) and (F814W, 2100s) over 63 tiles in a 10.1′ 70.5′ strip centered at J2000 RA= 14h19m18s, Dec=+52 49 25. Each tile was observed with 4 pointings per filter and combined with the STSDAS.multidrizzle package using a square kernel. The final images have a pixel scale of per pixel and PSF of FWHM. The drizzling procedure results in correlated pixels in the output image; therefore the true sky noise for object photometry and morphology was calculated from the weight maps output by multidrizzle. The 5- limiting magnitudes for a point source are (AB) and (AB) within a circular aperture of radius ( 50 pixels). For an extended object, the 5- limiting magnitudes are (AB) and (AB) assuming a circular aperture of radius ( pixels). Hereafter all references to ACS photometry in and are in the AB system.
We detected objects in summed ACS images and constructed initial galaxy segmentation maps using the SExtractor galaxy photometry software (Bertin & Arnouts 1996) and a detection threshold of and 50 pixels. These detection maps and the ACS zeropoints (Sirianni et al. 2005) were applied to each band separately to create the ACS photometric catalogs. ACS isophotal magnitudes are known to suffer from significant aperture corrections (Sirianni et al. 2005), therefore we use SExtractor ‘BEST’ magnitudes which attempt to correct for missing light and are in better agreement with ground-based magnitudes from DEEP and CFHTLS.
We selected all non-stellar objects with SExtractor CLASS_STAR and that did not lie within 50 pixels of a tile edge for our automated morphology analysis, covering an effective area of 710.9 arcmin2 in the ACS images. For each galaxy the automated morphology analysis code uses the SExtractor segmentation map to mask out background and foreground objects. Then it calculates the Petrosian radius and assigns pixels brighter than the surface brightness at to the galaxy, and computes and using these pixels (see Lotz et al. 2006 for details of the morphology analysis code). Out of 18831 galaxies brighter than more than 50 pixels from the image edge, we obtained morphologies for 10832 () and 11465 () EGS galaxies with per pixel , , and contiguous segmentation maps (Figure 1). About 3% of all measured objects were flagged as having non-continuous segmentation maps, usually the result of bad foreground/background object masks. Those flagged objects which meet our final sample criteria (§2.4) were reanalyzed by hand to properly mask out foreground/background objects. Another 6% had Petrosian radii and were too compact to derive morphologies. The majority of low per pixel objects are low-surface brightness galaxies with or (see Section §2.4).
2.2. Redshifts
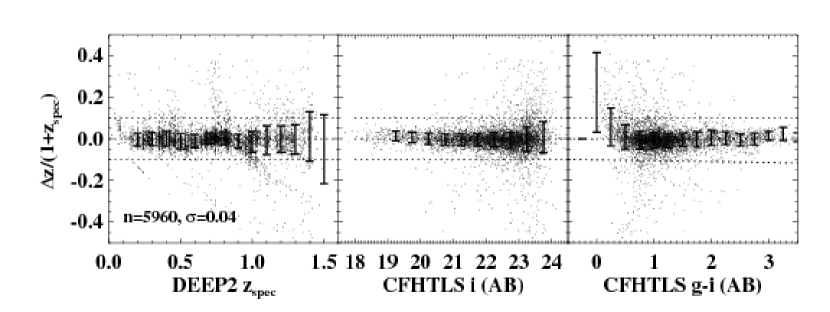
The EGS is one of four DEEP2 Galaxy Redshift Survey fields – see Davis et al. 2002, Coil et al. 2004, Davis et al. 2004, and Willmer et al. 2006 for a description of the DEEP2 survey, catalog construction, and data reduction. Unlike the other DEEP2 fields, no color pre-selection was applied, therefore objects were not excluded as spectroscopic targets. About seventy percent of objects brighter than were targeted by DEEP2, with 80% of those yielding 95% confidence (quality ) redshifts, for a total spectroscopic redshift completeness 56% (Willmer et al. 2006). We have 3839 matches of quality DEEP2 redshifts to the ACS photometry catalog, and 3000 matches of quality DEEP2 redshifts to ACS galaxies with good morphologies. Because we do not require high precision redshifts to examine the morphological evolution with redshift, we supplemented our spectroscopic redshift catalog with photometric redshifts determined by Ilbert et al. (2006) using the CFHTLS in . The CFHTLS Deep Field D3 surveys the EGS region down to a limiting (AB) 26.2, but has small gaps in its coverage due to gaps in the MegaCam CCDs. We use only photometric redshifts calculated with 3 or more CFHTLS bands including the band. We have 52548 matches of CFHTLS photometric redshifts with more than 2 bands to the ACS photometry catalog, and 10140 matches to ACS galaxies with good morphologies. 5960 CFHTLS galaxies with more than 2 bands have been matched to DEEP2 quality 3 redshifts; 2634 of these have good ACS morphologies. The CFHTLS photometric redshifts from Ilbert et al. (2006) are reliable to for , , and , with typical (Figure 1). The catastrophic failure rate where when compared to the DEEP2 quality 3 redshifts is less than 4% at . This rate increases to 8% for with typical . Catastrophic photometric redshift errors have a negligible effect on our morphological fractions (§3.2). We performed bootstrapped simulations of the photometric redshifts and morphological distributions as a function of redshift (§3.2) and find that the photometric redshift errors have no effect on observed morphological evolution.
Although the DEEP2 and CFHTLS redshift catalogs probe out to , we select objects at where the ACS images sample rest-frame optical (Å ) morphologies to minimize rest-frame wavelength-dependent morphology biases. Galaxies appear significantly more irregular in rest-frame ultra-violet than in rest-frame optical images, and strong biases in the fraction of disturbed objects can occur when the wavelength dependence on morphology is not taken into account (e.g. Hibbard & Vacca 1997, Marcum et al. 2001, Windhorst et al. 2002). In order to consistently sample rest-frame ( 4500 Å) morphologies across the full redshift range, we use the observed morphologies at and the morphologies at for our morphological classifications (§3). The change in morphology between rest-frame 5100Å (for at and at ) and rest-frame 3700Å (for at and at ) is small for most local galaxies (LPM04). However we do note that the and sample have slightly higher merger fractions, possibly the result of this shift in rest-frame wavelength.
2.3. Completeness Issues
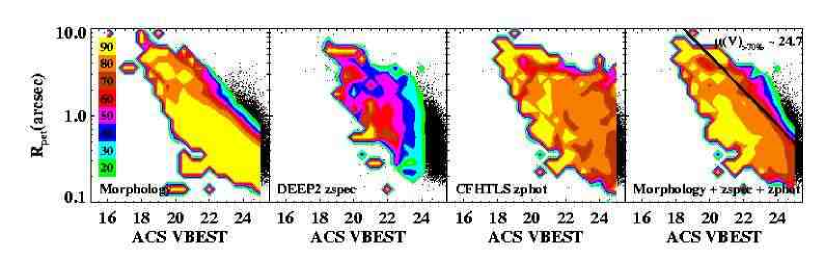
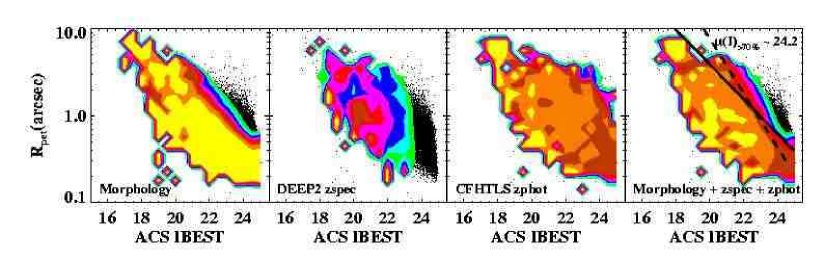
Galaxies in our final morphological sample must have (1) reliable rest-frame optical morphological measurements, i.e. per pixel , , and contiguous segmentation maps and (2) a reliable spectroscopic or photometric redshift, i.e. quality for DEEP2 or 3 or more bands used for CFHTLS . Therefore the completeness of our matched morphology-redshift catalog depends on the detection limits in the ACS images, the surface-brightness and size limits of our morphological measurements, and the completeness of the DEEP2 and CFHTLS redshift catalogs which may be a function of observed color as well as magnitude. The detection limits of the ACS data are substantially deeper than our morphology and redshift catalogs, thus we use the ACS photometric catalog to compute completeness as a function of SExtractor ’BEST’ magnitude, , and color for the morphology and redshift catalogs (Figures 2 and 3). Stars are excluded from the ACS photometric catalog by removing objects with SExtractor stellarity class .
The completeness of the combined morphology and redshift catalogs as a function of Petrosian radius and magnitude are shown in and in the right-hand panels of Figure 2. The Gini coefficient and become unreliable at per pixel 2.5 (LPM04, Lotz et al. 2006). This per pixel limit corresponds to average surface brightness within the Petrosian radius 24.7 AB magnitudes per arcsec2 in and 24.2 in for face-on galaxies (solid line, right-hand panels in Figure 2). Brighter than these surface brightness limits, the joint morphology-redshift catalog is 70% complete when compared to the ACS photometric catalog. Compact distant galaxies are also excluded because it becomes impossible to recover and for galaxies with less than 0.3 in ACS images (Lotz et al. 2006). However, these are less than 6% of the sample and are mostly at (Figures 2 and 4). The DEEP2 spectroscopic redshift targeting selection excludes objects with surface brightnesses fainter than (Davis et al. 2007), while the CFHTLS photometric redshift catalog has no strong selection against low surface brightness objects when compared to the ACS detections (Figure 2). Therefore the dominant selection effect is the surface-brightness limit of the morphology catalog.
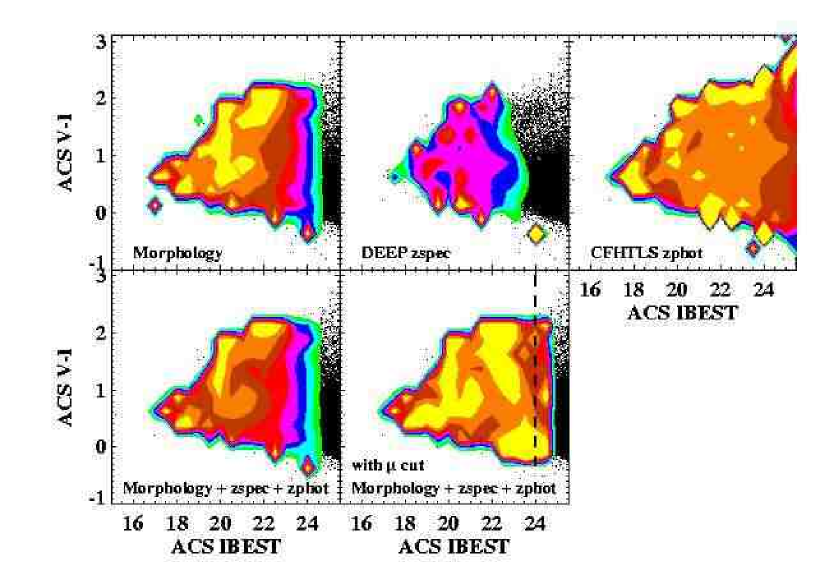
One may expect the redshift completeness to be a function of observed color for both the spectroscopic and photometric redshift catalogs. DEEP2 spectroscopic redshifts are determined using either strong emission lines found in blue star-forming galaxies (e.g. [OII] 3727, H, [OII]5007, H) or absorption lines in older red stellar populations, while photometric redshifts are most reliable for older and redder stellar population with strong spectral breaks (e.g. 4000Å break). However we do not find a strong net bias ( completeness 10%) against galaxies with either red or blue observed colors in our final morphology-redshift catalog (last panel, Figure 3). The DEEP2 spectroscopic catalog is more likely to miss faint () red () galaxies; however, the CFHTLS photometric redshift catalog is complete at , . Hence the final combined catalog including both spectroscopic and photometric redshifts is not strongly biased against red galaxies. In fact, we are slightly biased against blue galaxies (lower left hand panel of Figure 3). This is because the lowest surface brightness galaxies missing from the morphology catalog are more likely to be blue. We will discuss the implications for the observed morphology evolution in the next section. For objects with surface brightnesses greater than the 70% completeness limit found in Figure 2 (dashed line), we do not find a significant dependence of completeness on observed color (last panel, Figure 3).
2.4. Volume-limited sample selection
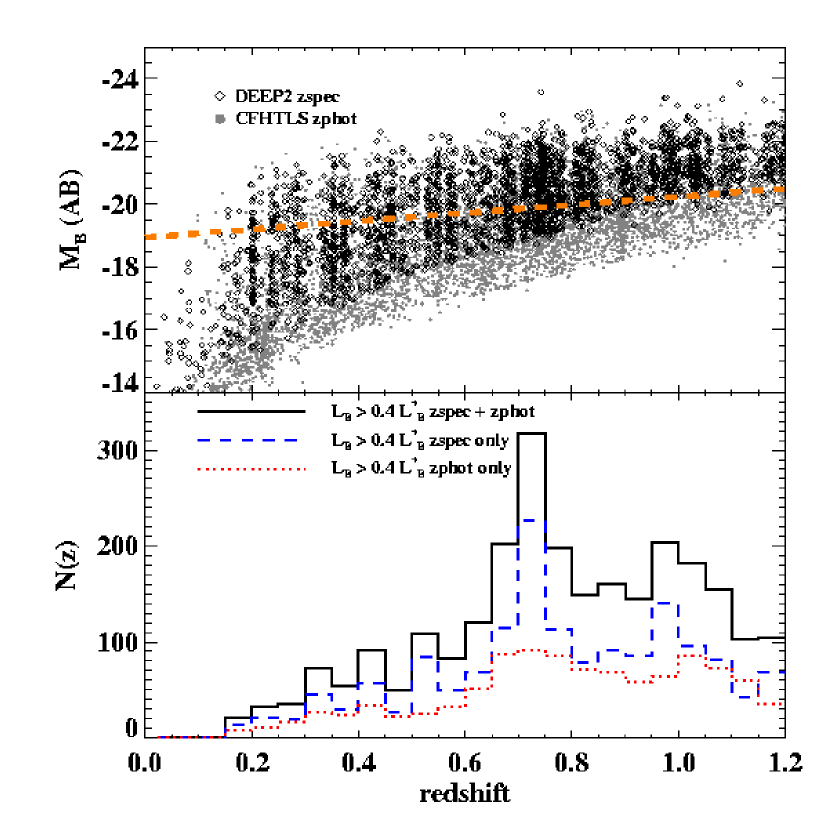
To track the evolution of galaxy morphology with redshift, we must first define a galaxy sample that is statistically complete in morphology and redshift measurements and probes the same population of galaxies (in terms of mass or luminosity) across the entire redshift range. In the previous sections, we found that the EGS matched morphology-redshift catalog is 70% complete for objects with and with no color biases within this surface brightness limit. At , corresponds to an absolute magnitude limit of (AB) (approximately 0.4 , adopting (AB) = -21.44 from Faber et al. 2007). Absolute and rest-frame colors are computed from the DEEP photometry with empirical SED templates and from the ACS photometry where the DEEP photometry is not available (see Willmer et al. 2006 for k-correction methodology).
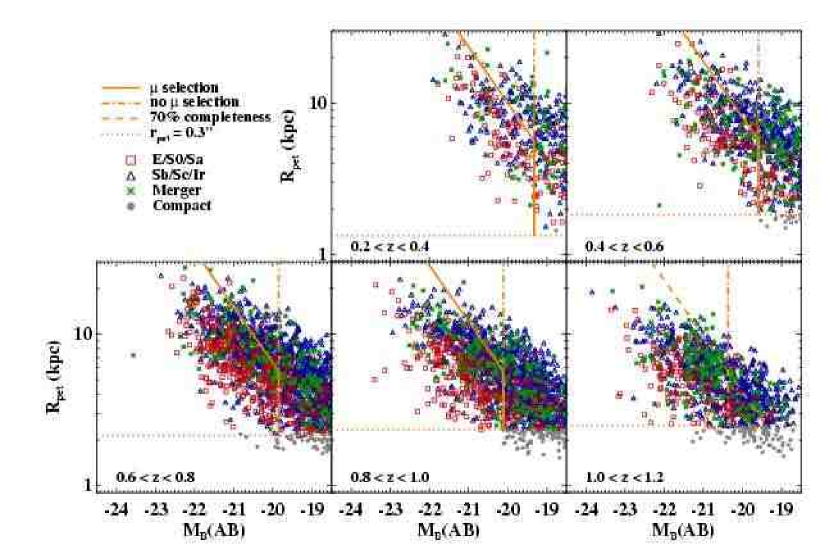
We have constructed a volume-limited sample to study the morphology evolution from by applying the 70% completeness size-magnitude cut to our highest redshift bin () and making certain assumptions about how these galaxies evolve in luminosity and size with time (Figure 4). We assume no size evolution. We assume pure luminosity evolution with an increase of 1.3 per unit redshift for all galaxies (Faber et al. 2007), and apply a cut of . These limits correspond to , and log10(rp) (Figure 4). Our final volume-limited sample has 2565 galaxies. We find that our results are not strongly dependent on the magnitude of the assumed luminosity evolution, which may be between 1.0 and 1.5 magnitudes (e.g. Barden et al. 2005, Brown et al 2006, Faber et al. 2007, Melbourne et al. 2007). Roughly 60% of this sample has DEEP2 spectroscopic redshifts, and we use CFHTLS photometric redshifts for the remaining 40% of the sample. The redshift distributions of our luminosity evolution sample with the 70% completeness size-magnitude cut are shown in Figure 5. The spectroscopic and photometric redshift sub-samples show similar redshift distributions. The photometric redshift distributions do not detect over-densities at and found by the DEEP2 survey and contribute 50% of the sample at . If we do not apply the 70% completeness size-magnitude cut, we have a sample of 3009 galaxies.
The disadvantage of the size-magnitude completeness cut is that we exclude many objects with perfectly good redshifts and morphologies with lower surface-brightnesses from the lowest redshift bins (Figures 4 and 5). We stress that the conclusions of this paper apply only within the sample selection criteria – i.e. for galaxies with relatively bright optical magnitudes and high surface-brightnesses. With the EGS data alone, we cannot know how these excluded objects evolve because we cannot observe the progenitors of these objects in our highest redshift bin if their surface-brightnesses evolve passively. We note that this limitation is a problem for all morphological analyses (including visual classifications) which properly take into account the surface-brightness selection effects and biases. Most of the excluded objects are classified as late-type spirals and have blue colors (Figures 3 and 4); late-types have larger Petrosian radii and lower-surface brightnesses than early-types at a given magnitude. Some excluded objects are mergers, but we find mergers are just as likely to have high surface brightnesses as low-surface brightnesses and so are not preferentially removed from our samples in the lower redshift bins. Therefore the 70% completeness cut effectively lowers the ratio of late-types to early-types. A preliminary morphological analysis of the Great Observatories Origins Survey (GOODS) ACS data (Giavalisco et al. 2004), which probes lower-surface brightnesses but a smaller volume at , supports this conjecture. We calculate the morphological fractions for a sample that includes all low surface brightness objects in §3.2 (dot-dashed lines shown in Figure 4) and compare to the 70% complete volume-limited sample described above.
For each object we determine the completeness for its magnitude, size, and color using the contours in Figures 2 and 3. The average completeness for each redshift bin and morphological type are given in Table 1. We also compute a correction factor for the morphological fraction W(type) C(total)C(type). These corrections are quite small, and never result in changes of more than 2%. The fractions given in Table 2 are corrected by the values given in Table 1.
| z | C(tot) | C(E-Sa) | C(Sb-Ir) | C(M) | W(E-Sa) | W(Sb-Ir) | W(M) |
|---|---|---|---|---|---|---|---|
| with completeness cut | |||||||
| 0.30 | 0.88 | 0.86 | 0.90 | 0.81 | 1.01 | 0.97 | 1.08 |
| 0.50 | 0.83 | 0.82 | 0.83 | 0.86 | 1.01 | 1.00 | 0.96 |
| 0.70 | 0.85 | 0.87 | 0.84 | 0.85 | 0.98 | 1.01 | 1.00 |
| 0.90 | 0.80 | 0.86 | 0.78 | 0.76 | 0.93 | 1.03 | 1.06 |
| 1.10 | 0.72 | 0.80 | 0.70 | 0.70 | 0.91 | 1.03 | 1.03 |
| with no completeness cut | |||||||
| 0.30 | 0.86 | 0.86 | 0.87 | 0.81 | 0.99 | 0.98 | 1.05 |
| 0.50 | 0.78 | 0.81 | 0.78 | 0.84 | 0.97 | 1.00 | 0.93 |
| 0.70 | 0.81 | 0.86 | 0.79 | 0.81 | 0.94 | 1.02 | 1.00 |
| 0.90 | 0.76 | 0.85 | 0.74 | 0.73 | 0.90 | 1.03 | 1.05 |
| 1.10 | 0.70 | 0.79 | 0.68 | 0.67 | 0.88 | 1.02 | 1.04 |
| 0.30 | 0.91 | 1.00 | 0.97 | 0.80 | 0.91 | 0.94 | 1.14 |
| 0.50 | 0.82 | 0.75 | 0.79 | 0.92 | 1.09 | 1.04 | 0.90 |
| 0.70 | 0.82 | 0.82 | 0.83 | 0.84 | 1.00 | 0.99 | 0.98 |
| 0.90 | 0.79 | 0.86 | 0.78 | 0.79 | 0.92 | 1.01 | 1.00 |
| 1.10 | 0.73 | 0.81 | 0.73 | 0.73 | 0.90 | 1.00 | 1.00 |
Note. — The mean completeness for each redshift bin and morphological type and the correction factors to the morphological fractions W(type) C(tot)/C(type) are given.
2.5. MIPS 24 m sample
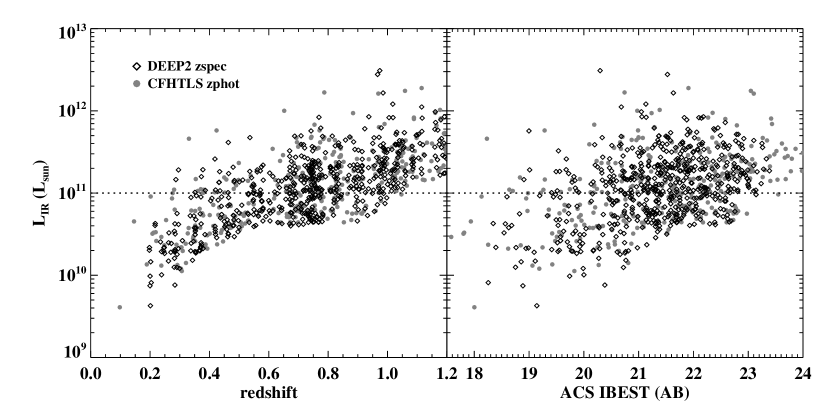
Spitzer Space Telescope Multiband Imaging Photometer for Spitzer (MIPS) data in the 24 m band was obtained for the EGS as part of the GTO program (PI Rieke, Fazio). We matched the ACS detections to the MIPS 24 m catalog (see Papovich et al. 2004 for details of the catalog construction), and found 2902 unique matches brighter than 60 Jy and within 1.5″ of an ACS detection. These were then matched to the redshift catalogs: 889 have spectroscopic redshifts with quality 3, while an additional 898 have photometric redshifts. Infrared luminosities (8-1000m, Sanders & Mirabel 1996) were derived using the Chary & Elbaz (2001) templates in the same manner as Le Floc’h et al. (2005). Our final LIRG sample of 515 objects was selected to have , L(IR), per pixel , ″, and meet the same 70% completeness criteria shown in Figure 4. Above , the 24m sample is incomplete at L(IR) (Figure 6). Most of the LIRGs in our sample are 1 magnitude brighter than our cutoff magnitude.
3. Morphology Evolution at
3.1. Morphological classification at high redshifts
Visual classification of nearby galaxies has a long and distinguished history (see Sandage 2005 for a recent review). However, visual classification assigns galaxies into discrete categories while real galaxies lie along a continuum of morphological properties. Visual classification is inherently subjective and human classifiers of local well-resolved galaxies often disagree by one or more classes. Finally, visual classification of distant galaxies become increasingly difficult as the spatial resolution and signal-to-noise of the image decreases and mis-classification become more common (e.g. Brinchmann et al 1998).
With quantitative morphology measures, one may avoid the issues of subjectivity and can quantify the effects of low signal-to-noise and resolution on the measured values. But quantitative measures have their own difficulties. Quantitative measurements often show a good deal of scatter when compared to visual classifications. This is perhaps unsurprising given the uncertainty in visual classifications and given that a single quantitative measurement is unable to capture the full richness of visual classification. With quantitative measurements, one can choose whether to classify an object into discrete categories by comparing to visual classifications or to characterize the natural distribution of values (e.g. Blanton et al. 2004). We explore both approaches to the classification scheme.
The Gini coefficient and the second-order moment of the brightest 20% of the light, , are two non-parametric measures of galaxy morphology put forth in LPM04. With these two quantities measured in rest-frame , it is possible to identify local galaxy merger candidates and classify early- and late-type galaxies (LPM04). is a statistic used frequently in economics to quantify the distribution of wealth in a population, and was first used to quantify the distribution of light among a galaxy’s pixels by Abraham et al. (2003). Although generally correlated with concentration for normal galaxies, it is not sensitive to the location of the brightest pixels and hence shows high values for galaxies with multiple bright nuclei as well as highly centrally-concentrated spheroidals. A efficient way to compute is to first sort the pixel flux values into increasing order and calculate
| (1) |
where is the number of pixels assigned to a galaxy. For uniform surface-brightness galaxies, is zero; and if one pixel has all the flux, is unity (Glasser 1962).
is anti-correlated with concentration, with highly concentrated galaxies having low values. Unlike concentration which is measured in circular apertures, directly traces the spatial extent of the brightest pixels in a galaxy and is more sensitive to merger signatures like double nuclei. It is also normalized to the total moment of the galaxy, and thus is less sensitive to inclination. It is defined as
| (2) |
and
| (3) |
where is the galaxy’s center (LPM04). The center is computed by finding such that is minimized.
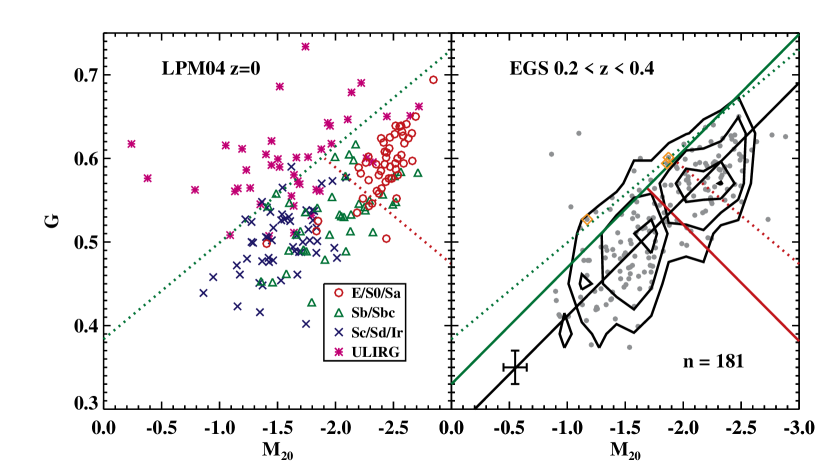
In the left-hand side of Figure 7, we plot the values for a heterogeneous sample of local galaxies measured by LPM04. The images of normal Hubble types (E-Ir) are from the Frei et al. (1996) catalog and the SDSS; the - values are measured at rest-frame (Frei galaxies) or (SDSS) and the visual classifications come from the Carnegie Atlas (Sandage & Bedke 1994). The normal galaxies lie along a well-defined sequence in -, with early-types (E/S0/Sa) exhibiting high and low values and late-types (Sb-dI) exhibiting low to moderate and higher values. Although there is significant scatter in the - values of a particular visual classification, most local E/S0/Sa lie above and to the right of the dashed red line while most spiral and late-types lie below and to the left of the dashed red line.
We have also plotted a sample of ultra-luminous infrared galaxies (ULIRGS) from Borne et al. (2000) with - values measured by LPM04. Over 90% of the ULIRGs show visual characteristics of merger activity such as multiple nuclei and/or tidal tails (e.g. Cui et al. 2001, Borne et al. 2000), and they span a range of merger stages from close pairs to ongoing mergers with double nuclei to recently merged objects with tidal tails and bright single nuclei. Detailed kinematic studies of a smaller sample of ULIRGs indicate that many ULIRGs are mergers of roughly equal mass galaxies (Dasyra et al. 2006). We find that the majority of ULIRGs lie above the sequence of normal Hubble types. In LPM04, we estimated the upper limit of the local normal galaxy - sequence with the dotted green line where major-merger candidates fall above this line.
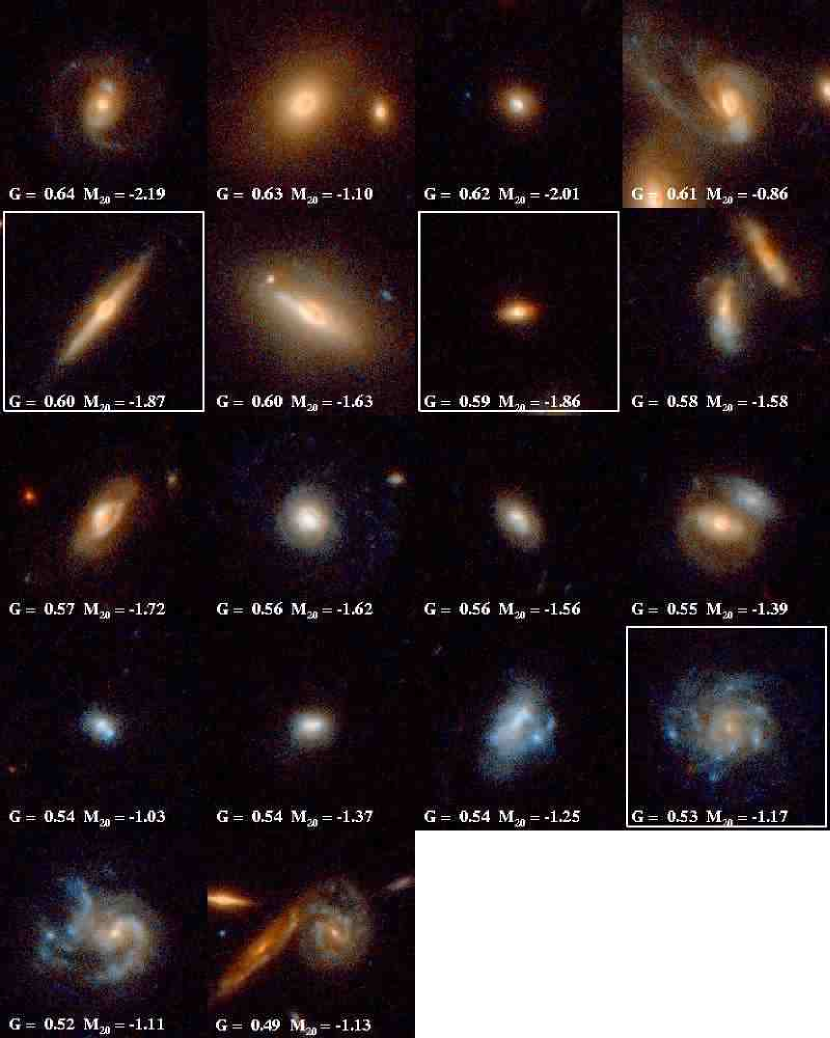
In the right-hand side of Figure 7, we plot the rest-frame - values for our 70% complete sample at (see also first panel in Figure 10). Unlike the local galaxy sample studied in LPM04, this sample is 88% complete (Table 1) and we can look for features in the distribution of - space and use any such features to classify galaxy morphologies. We again find the most galaxies lie along a well-defined sequence in - (fit by the solid black line). The distribution shows evidence for bi-modality (solid contours), with one peak corresponding to the region where local Sb/Sc/Ir fall and the second peak slightly below where local E/S0/Sa fall. The solid red line indicates the minimum between these two peaks. The solid green line has the same slope as the line fit to the locus, but is has a zeropoint shifted in (three times the typical uncertainty in ). Objects above the solid green line lie in roughly the same region as the major-merger candidates measured by LPM04 (dashed green line).
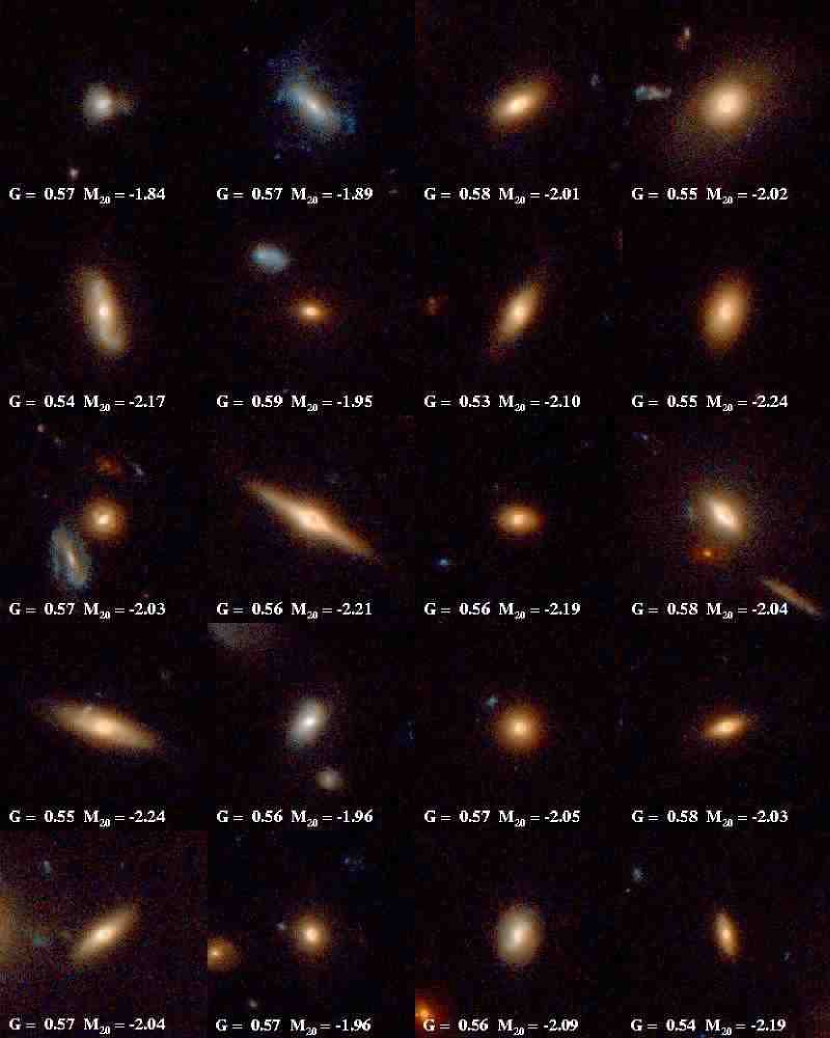
We visually inspected the sample to determine how well the classification based on the features of the - distribution corresponded with visual morphologies. In Figure 8, we show the 18 merger candidates above the solid green line in Figure 7, including those objects where the two classification cuts disagreed. We find that all but 3 objects show morphological merger signatures in the form of very close pairs, off-center nuclei, or asymmetries (orange diamonds, right panel of Figure 7). One undisturbed object is an edge-on disk, one is an early-type galaxy with an uncorrected cosmic-ray, and one is a face-on spiral with very knotty star-formation. In Figure 9, we show 20 objects that lie between the solid and dashed red lines in Figure 7. Almost all of these objects appear to be red S0 or Sa galaxies with a significant bulge and a disk component but little evidence for spiral arms. We conclude that the classification cuts based on the natural distribution of - space do a better job of identifying early-type galaxies and finds slightly more merger candidates than the visual classification scheme. We adopt the following classifications for EGS galaxies:
| (7) |
The merger classification cut is shown as the green line in the right panel of Figure 7, the division between E/S0/Sa and Sb-Ir is shown as the red line in the same figure. Changes in the positions of these cuts will change the relative fractions of mergers, E/S0/Sa, and Sb-Ir. We present the effects of small offsets to these classifications on the derived morphological fractions in the next section. While our discrete classifications of ‘E/S0/Sa’, ‘Sb-Ir’ and ‘major-merger candidate’ adopted here are guided by the visual classifications, strictly speaking the classifications are labels for particular quantitative regions of - space.
The ACS observations of the sample have worse spatial resolution ( 0.5 kpc per PSF FWHM) than ground-based images of local galaxies used in LPM04 ( 0.1 kpc per PSF FWHM). The shift in values from early-types to early-types is likely to be caused by the factor of five change in spatial resolution of the images (see discussion of resolution effects in LPM04). The change in spatial resolution from ( 0.5 kpc per PSF FWHM) to ( 1.0 kpc per PSF FWHM) is not as dramatic as the change from the LPM04 sample to the EGS sample. Nevertheless, we tested whether the classification cuts based on the z are robust to redshift-dependent effects. We artificially redshifted the sample to z=0.5, 0.7, 0.9, and 1.1 by rescaling the galaxy sizes by the angular diameter distance and rescaling the galaxy fluxes by the luminosity distances and assuming 1.3 magnitudes of brightening per unit redshift. We then recomputed - values and classifications for the artificially redshifted images. We find that the fraction of artificially-redshifted objects that are mis-classified is 15% and does not change significantly with redshift. Changing the classification cuts with redshift does not improve our mis-classification rate. The net corrections to the observed morphological fractions are less than 15% because for every merger mis-classified as an E/S0/Sa or Sb-Ir, a certain number of E/S0/Sa or Sb-Ir are mis-classified as mergers. The net corrections are comparable to the Poisson and bootstrapped errors derived in the next section and are % for Sb-Ir, % for E/S0/Sa, and 2% for the merger candidate fraction. Because our artificial-redshift tests do not show a change in the mis-classification rate with redshift, we adopt the same classification cuts for all redshift bins.
3.2. - distribution v. redshift
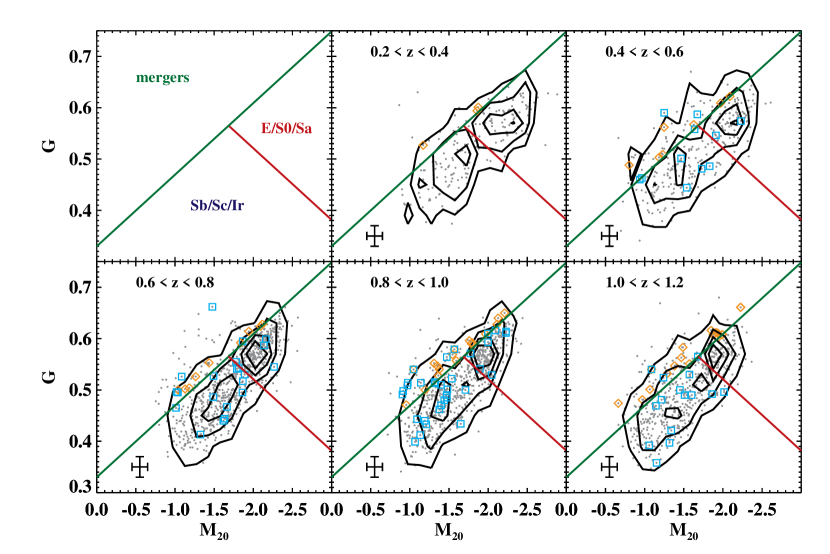
In Figure 10, we plot the distribution of our complete volume-limited sample as a function of redshift. The rest-frame -band distribution at is remarkably similar to local galaxies, with the majority of galaxies lying along a clear sequence in . The error-bars are for a per pixel galaxy in ACS images (G , M; see Lotz et al. 2006 for tests of and in deep ACS images); the typical for our sample is 4-6 with G , M.
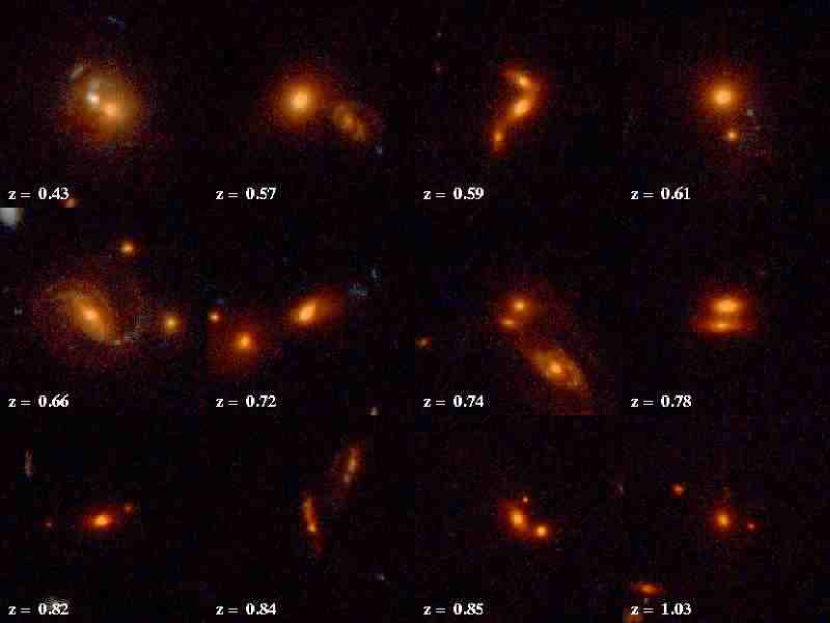
We have visually inspected all of the merger candidates, and find that 83% (332/402) show merger signatures such as offset or multiple nuclei, visual asymmetries, and close companions. The remaining 17% are ambiguous and usually lie close to the dividing line between mergers and ‘normal’ galaxies (orange diamonds, Figure 10). These are often spirals or irregulars with bright off-center star clusters. We use the DEEP2 spectroscopic survey to estimate the number of chance superpositions that result in false merger detections. Five percent of the galaxies in our sample with spectroscopic redshifts (83/1530) have multiple systems at different redshifts in a single DEIMOS slit, due to either chance superpositions or gravitational lenses (cyan boxes, Fig. 10). Roughly a quarter (21/83) of the chance superpositions are classified as merger candidates. 223 of our merger candidates have spectroscopic redshifts, hence we expect 9% of all merger candidates to be chance superpositions. Extrapolating to the photometric redshift sample, we find the correction for chance superpositions has a negligible effect on derived merger fractions (%).
Some of our merger candidates are very close pairs with overlapping isophotes and are identified in the ACS images as a single object by SExtractor. These objects are also blended in ground-based images, and the red-blue pairs in particular may have unreliable photometric redshifts. Sixteen of our merger candidates are very close pairs with only photometric redshifts available. Nine of these show color differences as measured in 0.5″ apertures around each nucleus in the ACS images. These blended sources have a negligible contribution to the derived merger fraction and evolution. We have chosen to include them in the final merger candidate sample, but excluding them would not affect our results.
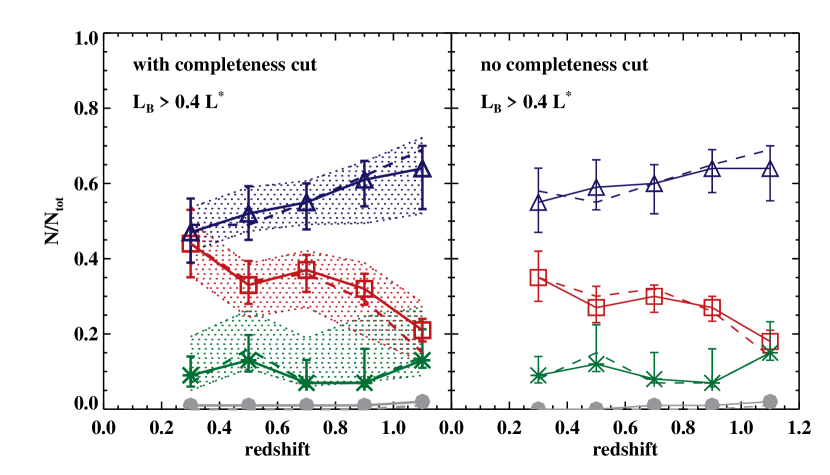
We plot the morphological fractions as a function of redshift for the samples with and without the 70% completeness size-magnitude cut (solid lines and points in Fig. 11). The fractions have been corrected for incompleteness (Table 1), visually ambiguous merger candidates and chance superpositions. The fraction of objects that are too compact to classify are plotted as grey points; their contribution is negligible for all redshift bins. The solid lines are for the entire sample, and the dashed lines are the spectroscopic redshift sub-sample. We find that the fractions derived for objects with spectroscopic redshifts and for the full samples are very similar, with a slightly lower/higher fraction of early-types/late-types for the spectroscopic sample in our highest redshift bins. We also find similar evolution in morphologies for the sample with the size-magnitude cut and the sample with no such cut, with the lowest redshift bins showing slightly higher fractions of disk-dominated late-type galaxies when no cut is applied. The merger fractions are identical. Given the similarity between these two samples, we will only refer to the sample with the 70% completeness cut for the rest of the paper.
To estimate the uncertainties in the fractions associated with the measurement errors, we have also created 10,000 bootstrapped realizations of the - distributions and compute the average morphological fractions and 1- standard deviations for each redshift bin. These simulations resample the and measurements using uncertainties and biases as a function of found in Figure 2 of Lotz et al. (2006) and assuming a Gaussian error distribution. The simulations also resample the photometric redshifts assuming a photometric redshift . In general, we derive similar morphological distributions from both the observed samples and bootstrap realizations, although the simulations classify slightly more galaxies as mergers and fewer as late-types. The error-bars plotted for the observed fractions in Figure 11 are the Poisson uncertainties and mean bootstrap shifts added in quadrature. The observed morphological fractions, Poisson uncertainties, and mean bootstrap shifts are given in Table 2. Our error-bars do not include cosmic variance. When we make a jackknife estimate by dividing the EGS field into 7 regions, we find the standard deviations of the morphological fractions are less than expected from Poisson statistics, implying that the effects of cosmic variance are small.
We show the effect of shifts in the classification criteria given in Eqn. 4. The shaded regions show the maximum and minimum values of the morphological fractions when these shifts are applied. Although the absolute values of the fractions are sensitive to the positions of the classification cuts, the evolution in the fractions is unchanged. Shifting the merger criteria by roughly doubles the number of objects classified as mergers; this is because the merger cut is parallel to the main locus of normal galaxies. This cut includes many more normal galaxy interlopers, hence we adopt the more conservative merger definition given in Eqn. 4.
We find that the fraction of major merger candidates does not strongly evolve with redshift at for both samples. The merger fraction is roughly constant at % for (Figure 11 and Table 2). The observed fraction of Sb-Ir declines from % at to % at (Fig. 11, blue triangles). Many of these systems are “irregular” in visual morphology, but have and consistent with late-type disks. The observed fraction of E/S0/Sa increases from % at to at (Fig. 11, red squares).
The most important sources of possible bias in our merger fractions are incompleteness and classification errors. The redshift bin is the least complete and if many mergers are low surface brightness, we could underestimate the merger fraction and the evolution in the merger rate. However, given the distribution of sizes and magnitudes of the merger candidates we do observe, this is highly unlikely. The completeness corrections computed in Table 1 strongly suggest that we are not preferentially biased against high redshift mergers. Classification errors are also likely to be significant at high redshift, and our artificial redshift tests imply that up to 15% of our sample will be misclassified. However, this misclassification rate does not change significantly between and , and the net correction to the merger fraction is only 2%. The weak dependence of the derived morphologies on redshift shows that redshift errors have little effect on our results so long as they are confined to a minority of the sample.
3.3. Morphologies of LIRGS
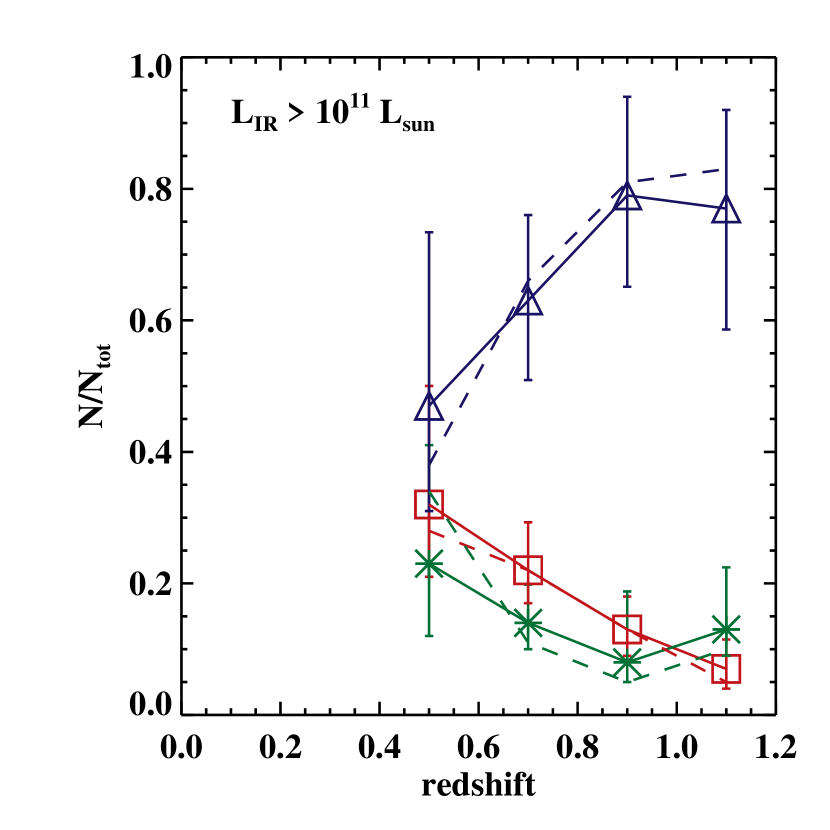
Infrared-luminous galaxies with L(IR) L⊙ are dominated by late-types (45-80%) at where the 24 m sample is most complete (Table 2; Fig. 12). Merger candidates are % of the LIRG sample over the same redshift range (Table 2; Fig. 12). There is some indication that the merger fraction of LIRGs may increase to 25% at , although this increase is not statistically significant because of our small sample size at these redshifts. We also find a number of bright 24 m sources with E/S0/Sa morphologies (8-30%). Many of these have an obvious star-forming disk (i.e., Sa). One spheroid-dominated galaxy has L(IR) and appears to be a post-merger remnant. Active nuclei (which may be more prevalent in bulge-dominated systems) may be present in 15% of MIPS sources (Le Floc’h et al. 2005, Bell et al. 2005).
4. Morphology-Color Relation and Evolution of the Red Sequence
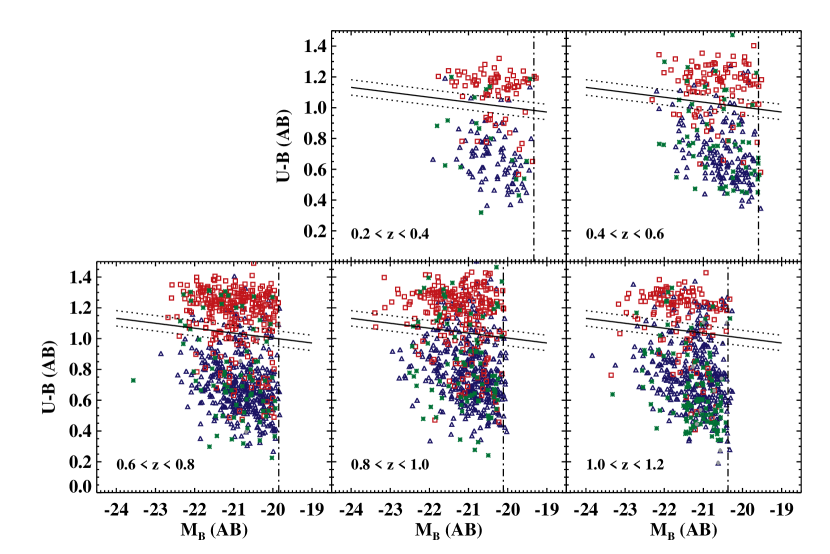
The classifications correlate well with the galaxies’ rest-frame colors (Figure 13). We adopt the division between red and blue galaxies defined by Willmer et al. (2006) and define ‘red sequence’ galaxies with colors 0.1 AB mag above this division, ‘blue cloud’ galaxies with colors 0.1 AB mag below this division, and ‘green valley’ galaxies between these two cuts :
| (11) |
Roughly three-quarters of E/S0/Sa lie on the red sequence while only 8% of Sb-Ir do. Approximately 14% of mergers are red in . Conversely, 86% of Sb-Ir and 80% of merger candidates fall in the blue cloud, while only 18% of E/S0/Sa are blue. Given that 60-70% of our sample are in the blue cloud and 20-40% are on the red sequence, our merger candidates are more likely to be blue than the general population.
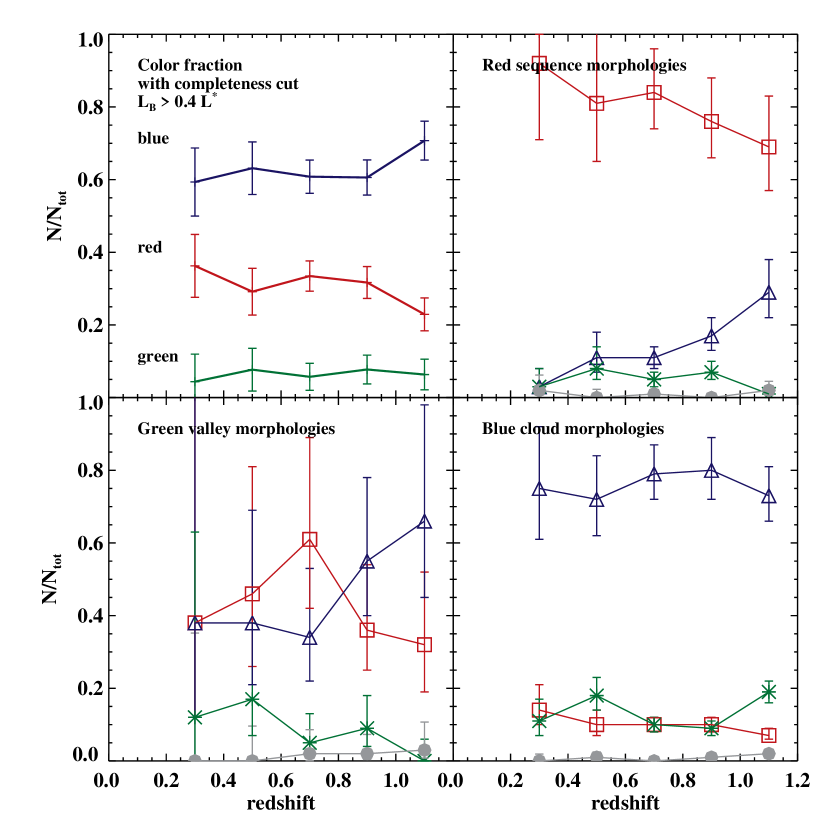
The morphological make-up of the red sequence evolves with redshift, while the morphologies of blue cloud galaxies remain largely unchanged. In Figure 14, we have plotted the observed morphology distribution of the red sequence, green valley, and blue cloud galaxies. At , % of red galaxies lie in the E/S0/Sa region of space, while at % of the red sequence galaxies are classified as E/S0/Sa. Most of the remaining red galaxies are disk-dominated galaxies, with Sb-Ir making up % of the red sequence at . Some of the red disk galaxies are edge-on systems, and many are similar to the diffuse red galaxies found by Weiner et al. (2005) in DEEP1 WFPC2 images. The remaining red sequence galaxies lie in the merger-candidate region of space.
Blue cloud galaxies are dominated by disk galaxies at all redshifts, and show a roughly constant fraction of mergers ( 13%) and blue E/S0/Sa ( 9%). The majority of blue E/S0/Sa are Sa with very bright bulges and blue star-forming disks, although some appear to be pure spheroids without disks. There is a suggestion that green valley galaxies transition from being dominated by disk galaxies at to having equal numbers of spheroidal and disk-dominated galaxies at , but there are too few green galaxies to make a strong conclusion.
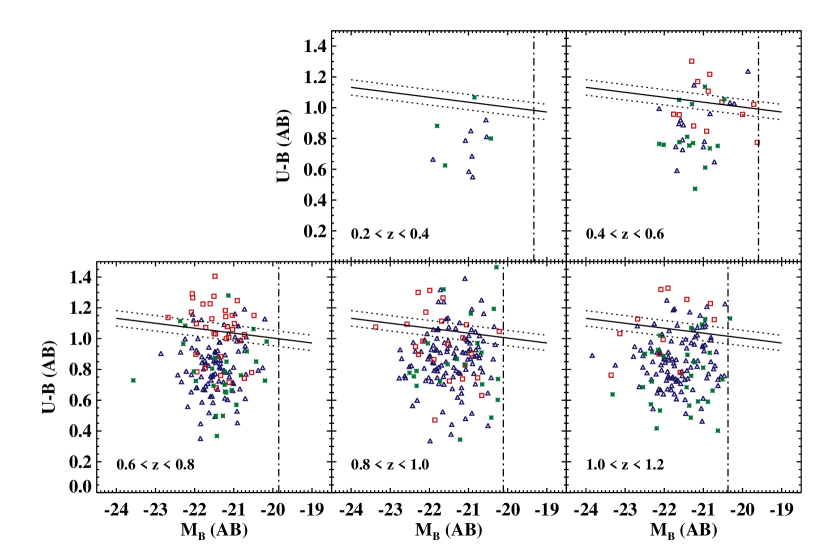
The majority of luminous infrared galaxies are bright () and blue (; Figure 15). However, some are red in rest-frame . Most of these are morphologically classified as Sb-Ir, suggesting that many red disks are reddened by dust. Eight are merger candidates, and may also be heavily reddened. Thirty-one of the red LIRGs are E/S0/Sa. Many of these are Sas with visible star-forming disks. The remaining red spheroidal LIRGS could host IR-luminous AGN.
5. Galaxy Major Merger Rate
The merger criteria given in Eqn. 4 do not identify all galaxies undergoing the merger process. The sensitivity of to merger activity will depend on merger stage, mass ratio, gas content, initial morphologies, initial orbital conditions, viewing angle, dust extinction, and wavelength. For example, galaxies during their first pass may meet the kinematic pair criteria but may not have experienced the tidal fields necessary to distort their morphologies, and hence would not be classified as merger candidates using . On the other hand, recently merged gas-rich galaxies will exhibit highly disturbed morphologies but are no longer considered a kinematic pair. Computation of a merger rate from the morphological merger fraction (whether those merger candidates are identified by visual classifications or quantitative morphologies) requires that the observed merger fraction be weighted by the timescales during which mergers can be identified via their morphologies. Those timescales are largely uncalibrated and will depend on the mass ratios, initial galaxy types, merger orbits, etc.
Our merger criterion was initially determined using a large sample of ultra-luminous infrared galaxies (LPM04), which have been shown to be gas-rich mergers with mass ratios 1:3 (Dasyra et al. 2006). Gas-rich equal-mass merger models suggest the timescales during which merging systems lie in the merger candidate region in Figure 10 are 0.5-1 Gyr, depending on the viewing angle, extinction, and merger parameters (Lotz et al., in prep). However, some of our merger candidates are red spheroids and gas-poor mergers may appear morphologically disturbed for shorter timescales ( 0.25 Gyr, Bell et al. 2006a).
The galaxy major merger rate for galaxies brighter than limiting luminosity is
| (12) |
where is the co-moving number density of galaxies at redshift brighter than , is the fraction of merger candidates brighter than , and is the timescale during which merging galaxies can identified morphologically. It is important to note that the dynamical timescale for the entire merger process is generally longer than the timescale during which merging systems can identified via morphologies. may be different for different morphological measures (, asymmetry, visual classifications), and therefore may result in somewhat different estimates of if is not adjusted accordingly.
For close pairs of galaxies within a given magnitude range, projected distance, and relative velocity, we adopt the formalism of Patton et al. (2000) where the galaxy merger rate is
| (13) |
where is the co-moving number density of galaxies at redshift within the magnitude range of the observed pairs, is the average number of companions for galaxies within the observed magnitude range, the 0.5 factor accounts for the double counting of pairs, is the probability that the galaxy pair will merge (typically assumed to be 0.5), and is the timescale for which merging galaxies appear as pairs ( 0.25-0.5 Gyr for projected distances of 30 h-1 kpc and relative velocities km s-1; Lotz et al., in prep).
To directly compare the morphological merger rate and the pair-count merger rate, one must compare the pair-count merger rate over the same magnitude-range as the progenitor of the morphologically-disturbed sample. We assume that mergers of mass ratios greater than 1:3 will be classified as major mergers in - and that the typical mass-to-light ratio is . The kinematic galaxy pair studies by Patton et al. (2002) and Lin et al. (2004) draw both the primary and secondary galaxies from the same magnitude range. Therefore the progenitors of the merger sample are drawn from paired galaxies brighter than 0.1 . Adopting a Schechter function for the galaxy luminosity function and neglecting the luminosity dependence of , we find
| (16) |
and
| (17) |
Assuming , , and ,
| (18) |
In the left-hand side of Figure 16, we plot for the EGS sample and for physical pairs with kpc, km s-1, and where the luminosity evolution parameter Q=1 (Lin et al. 2004; Patton et al. 2002). The values at derived by Bell et al. (2006b) by applying the projected two-point correlation function to the COMBO-17 survey and at by Bundy et al. (2004) using near infrared-selected galaxy pairs are very similar to those found by Lin et al. (2004). The recent Millennium Galaxy Catalogue survey agrees with the Patton et al. (2002) value at z=0 (de Propris et al. 2007). However, these studies have different selection criteria so we do not plot them in Figure 16.
We find , implying either or that the fraction of morphologically-disturbed galaxies is larger than the merger rate implied by the pair counts of bright galaxies. The latter could result from increasing at fainter magnitudes (as seen in Fig. 2 of Lin et al. 2004). Our morphological merger fraction could also be enhanced if many of our merger candidates are minor mergers. Contamination of the morphological sample by irregular but not merging galaxies would also artificially increase . Both and are highly uncertain, although hydrodynamical simulations suggest (Lotz et al., in prep).
In the right-hand side of Figure 16, we compare our merger fraction to the literature values of the morphological merger fraction (Le Fèvre 2000, Conselice et al. 2003, Cassata et al. 2005, Scarlata et al. 2007a, de Propris et al. 2007). Our merger fractions are generally within the error-bars of these previous morphological studies at , but give somewhat lower values at . The exception is Kampczyk et al. (2007), who measured a very low fraction of visually-disturbed galaxies at (2.4%) but estimate that they would detect only 1 in 5 mergers at because of the low surface-brightnesses of tidal tails used to classify mergers. Because of this large correction factor and unknown uncertainties in their measured fractions, we have not plotted these points. We do include the fraction of ‘irregulars’ in the COSMOS field from the PCA analysis of Scarlata et al. (2007a), although Kampczyk et al. (2007) suggest that only 30% of these would be visually classified as mergers. The Scarlata et al. (2007a) points are derived by integrating their best-fit Schechter functions for the irregular and total galaxy populations down to our magnitude cutoff at ().
The fraction of bright EGS galaxies classified as merger candidates in is 10% . This morphological major merger fraction does not evolve strongly for and is consistent with no evolution. Fitting a merger fraction evolution function to the EGS points, we find . Including the literature values of the morphologically-determined merger fraction for , we find . If we include the merger fraction from de Propris et al. (2007) determined using asymmetries, the evolution in the merger fraction steepens to . We caution that including the merger fractions from the literature may not be valid given the variety of morphological diagnostics and associated timescales needed to determine the merger fraction.
The DEEP2 and COMBO-17 surveys find that the co-moving number density of bright galaxies has not changed significantly since . Integrating the Schechter function down to 0.4 and assuming log10() and (Faber et al. 2007), we find the co-moving number density Mpc-3. Adopting and Gyr, we estimate that the merger rate for is Gyr-1 Mpc-3 at . Integrating this rate from implies that 45-90% of galaxies at had a major merger in the previous 4.7 Gyr. If many of our merger candidates have mass ratios less than 1:3, the implied mass accretion rate would be lower but the evolution in the merger rate would remain unchanged.

6. Discussion
The weak evolution of the merger fraction observed in the EGS at is in disagreement with previous claims for a dramatic increase in the morphological merger rate with (e.g., Brinchmann et al. 1998; Le Fèvre et al. 2000; Conselice et al. 2003; Cassata et al. 2005; Kampczyk et al. 2007), despite the general agreement of the morphologically-determined merger fraction values at (Figure 16). Most of the evidence for strong evolution in the merger fraction comes from the lowest and the highest redshift points (Figure 16). At , the effects of bandpass shifting makes measuring the merger fraction from morphologies difficult without high resolution near-infrared data. Both Brinchmann et al. (1998) and Le Fèvre et al. (2000) visually classified galaxies from the Canada-France Redshift Survey and Autofib-Low Dispersion Spectrograph Survey using only -band images. A later study of mergers based on a similar visual classification scheme found much weaker evolution in the merger rate when the morphological-dependence on wavelength was taken into account (Bundy et al. 2005). The Cassata et al. (2005) claim for a strong increase in the merger fraction with redshift comes largely from galaxies at where they can only measure the rest-frame ultraviolet morphologies. Only Conselice et al. (2003) has determined the merger fraction via morphologies using near-infrared images at ; this study used NIC3 images of the Hubble Deep Field North and hence was limited by small sample size. Future observations with Wide Field Camera 3 on should yield much larger high resolution near-infrared surveys for morphological studies at .
Only a few works have attempted to measure the local merger fraction from morphologies (Kampczyk et al. 2007, de Propris et al. 2007) using visual classifications and asymmetries. These are consistent with local measurements of the kinematic pair fraction which also give lower merger rates than the measurements (Patton et al. 2002). Studies of the COSMOS ACS survey by Kampczyk et al. (2007) and Scarlata et al. (2007a) find evidence for an increase in visually disturbed (Kampczyk et al. 2007) and quantitatively irregular (Scarlata et al. 2007a) galaxies at . However, because most of the COSMOS field is imaged in a single band-pass (), galaxies can be classified in rest-frame from the ACS data for only a limited redshift range. Both of these studies use a local sample of SDSS galaxies to determine the merger/irregular galaxy fraction at low redshift. Close pair studies using the DEEP1 survey (Bundy et al. 2004) and the DEEP2 survey (Lin et al. 2004) and the two-point correlation function from the COMBO-17 survey (Bell et al. 2006b) also find weak evolution with in the pair fraction at . Kartaltepe et al. (2007) claim strong evolution in the fraction of close pairs in COSMOS identified via photometric redshifts only. However, again most of their evidence for strong evolution comes from the SDSS pairs catalog of Allam et al. (2004); the evolution in the COSMOS pairs is much weaker. The weak evolution in the pair counts and morphological disturbed galaxies at and the low merger fraction observed at suggest a rapid increase in the merger rate from to . Clearly, more work is needed at and at to constrain the evolution in the galaxy merger rate.
The theoretical predictions for the galaxy merger rate over this epoch have changed in recent years. Although N-body simulations of galaxy halos predict a halo merger fraction (Gottlöber, Klypin, & Kravtsov 2001), the galaxy merger rate may evolve less dramatically than the halo merger rate because multiple galaxies occupy the same halo at late times (Berrier et al. 2006). Interestingly, many semi-analytical models do not predict a dramatic increase in the fraction of merging galaxies brighter than from to (Bell et al. 2006a; Benson et al. 2002). The hydrodynamical simulations analyzed by Maller et al. (2006) imply that the galaxy merger rate roughly doubles from to . However, they find that 45% of massive galaxies have experienced mergers with mass ratios greater than 1:4 since , in rough agreement with the merger rate we find here.

We contradict previous studies, which concluded that the increase in the faint blue galaxy population and the volume-averaged star-formation density from to 1 was driven by major merger triggered star-formation in an increasing population of peculiar galaxies (e.g., Glazebrook et al. 1995; Le Fèvre et al. 2000; Bridge et al. 2007). Using the classification scheme, we are able to distinguish between late-type spirals/irregulars and major merger candidates (LPM04). While the major merger fraction remains constant from , we find that the fraction of Sb-Ir increases with redshift. These galaxies also dominate the infrared luminous galaxy sample, which is the major contributor to star-production at . As concluded by other authors (Flores et al. 1999; Bell et al. 2005; Wolf et al. 2005; Melbourne et al. 2005; Menanteau et al. 2006, Noeske et al. 2007), the increase in star-formation density at is not driven by merger-induced star-formation, but rather by increased star-formation in the late-type disk population. The corresponding increase in the fraction of bright late-types with redshift suggests that the increase in is tied to disk gas-consumption and higher gas fractions at (e.g. Noeske et al. 2007). However, we note that galaxies with the highest specific infrared luminosities (L(IR)stellar mass) at are more likely to be in close kinematic pairs or morphologically-disturbed (Lin et al. 2007), and that LIRGs appear to have higher asymmetries than typical spiral galaxies (Shi et al. 2006; Bridge et al. 2007). Finally, it is possible that merging galaxies are mostly easily identified morphologically during the final merger while the peak in the star-formation rate/IR luminosity occurs during the first encounter before the interacting galaxies become morphologically disturbed (Lotz et al., in prep).
We find that the morphological makeup of the red sequence changes with redshift, with red Sb-Ir contributing roughly a third of the red sequence at , while E/S0/Sa makeup 90% of red galaxies at . Our red galaxy morphology fractions agree with the visual studies of red galaxy morphology by Bell et al. (2005) and galaxies by Weiner et al. (2005) (but see McIntosh et al. 2005). We also find the declining contribution of spheroidals to the high-redshift red galaxy population suggested by visual morphological studies of extremely red objects at (Moustakas et al. 2004) and (Daddi et al. 2004). Scarlata et al. (2007b) find similar evolution in the fraction of red galaxies with quantitatively early-type morphologies, but have systematically lower fractions of early-types on the red sequence (45% at and 60% at ). Given that the number density of red galaxies has increased by a factor of 2-4 from to (Faber et al. 2007, Brown et al. 2006, Bell et al. 2004a), the evolution of the morphological composition of the red sequence is consistent with a roughly constant number density of red Sb-Ir and an increasing number density of red E/S0/Sa. Much of the evolution in the E/S0/Sa population may occur in fainter and less massive systems (e.g. Bundy et al. 2005; Treu et al. 2005). We find that bright red spheroidals are in place at , while red disks populate the faint end of the red sequence at (Figure 13). By , almost all of the faint red galaxies are spheroidals.
Are these new red E/S0/Sa formed in mergers? Although the merger rate does not increase strongly with redshift at , the observed merger fraction implies that 45-90% of galaxies brighter than at have undergone a major merger since . The fraction of galaxies with E/S0/Sa morphologies has roughly doubled over this redshift range. Assuming that the total number density of bright galaxies has not changed significantly since (Faber et al. 2007), this implies that the number density of E/S0/Sa has also doubled. If every major merger transformed two disk-dominated galaxies into a spheroidal, we would expect the increase in E/S0/Sa to follow the integrated merger rate. The observed increase in the fraction of E/S0/Sa is a factor of 2-4 less than the expected increase in the merger remnant population, although marginally consistent within the uncertainties.
Some mergers may not follow the standard Toomre (1977) picture of two gas-rich disks transforming into a gas-poor elliptical. Our results suggest that at least half of the time the merging process does not dramatically transform the galaxies’ morphologies. This conclusion is supported by recent work which finds that the end product of some gas-rich mergers can be disk-dominated (Springel & Hernquist 2005; Hammer et al. 2005; Robertson et al. 2006) while spheroidal-spheroidal mergers will produce spheroidals (Bell et al. 2006a). Fourteen percent of the observed mergers lie on the red sequence. While some of these may be dusty or post-starburst merger remnants, some are clearly spheroidal-spheroidal or disk-spheroidal mergers (Figure 17). In Figure 18, we plot the fraction of galaxies classified as mergers on the red sequence. Our results give a low red merger fraction ( 2%) and agree well with the dissipation-less merger fraction of Bell et al. (2006a). Another possibility is that many of our merger candidates are minor merger events which do not result in dramatic morphological transformations.
It is tempting to directly associate the declining fraction of bright late-type spirals with the build-up of new E/S0/Sa via mergers. While the faded remnants of the merger of bright blue disks cannot produce the brightest red spheroidals, they may produce faint red spheroidals. The recent production of low mass spheroidals is consistent with evolution of the spheroidal stellar-mass function (Bundy et al. 2005) and the indication that ellipticals may have formed up to 40% of their stars at (Treu et al. 2005). Bright blue galaxies are in over-dense environments at (Cooper et al. 2006), and hence may be more likely to merge and form present-day spheroidals. However, given that many of the brightest blue galaxies appear to be relatively undisturbed LIRGs, the transition from bright blue disk to faint red spheroidal could happen via less violent processes such as gas consumption, AGN quenching, gas-stripping or minor mergers (e.g. Noeske et al. 2007, Bell et al. 2005, Bundy et al. 2007). A better understanding of the triggering mechanisms for LIRGs, the evolution in the number density of faint spheroidals and mergers, and the role of mergers in transforming galaxy morphology are needed to resolve this question.
7. Summary
We have measured the quantitative morphologies and of relatively high surface brightness galaxies from ACS imaging in and in 710 arcmin2 of the Extended Groth Strip. Galaxies are classified as E/S0/Sa, Sb-Ir, and major mergers based on their rest-frame -band morphologies and local galaxy calibration of and . We examine the evolution of the morphological fractions with redshift for a volume-limited sample of 3009 galaxies with that assumes that galaxies fade by 1.3 per unit redshift. We also examine the morphologies of 515 Spitzer MIPS 24 m-selected L(IR) galaxies in the EGS.
(1) We find that the fraction of merger candidates is 102% and does not evolve strongly from to . The fraction of E/S0/Sa has increased by a factor of 2 from 213% at to 449% at . The fraction of Sb-Ir has declined from 646% to 479% over the same redshift range.
(2) The majority of LIRGs, which dominate the volume-averaged star-formation density at , are classified as Sb-Ir galaxies. Only 15% of these galaxies are classified as on-going mergers, suggesting that merger-driven star formation is not responsible for the bulk of star formation at .
(3) The - morphological classifications correlate strongly with rest-frame color. Over 75% of E/S0/Sa are red, while 86% of Sb-Ir and 80% of merger candidates are blue. Merger candidates are more likely to be blue than the overall sample, with 14% of mergers lying on the red sequence.
(4) The morphological makeup of the red sequence has changed since where disk galaxies are a third of red galaxies, while 90% of red galaxies are spheroidals. Adopting the number density evolution in red galaxies found by Faber et al. (2007), this implies that the build up of the red sequence can be explained by the formation of faint red E/S0/Sa at late times.
(5) The implied merger rate at is Gyr-1 Mpc-3, with 45-90% of galaxies undergoing a merger between and . While this rate is more than sufficient to produce the observed increase in the E/S0/Sa population, some mergers may not change galaxies morphological classifications. Fourteen percent of our merger candidates are red, and some of these appear to be dissipationless mergers. The disappearance of bright blue Sb-Ir galaxies is consistent with the transformation of late-type disks into red spheroidals via major mergers. However, many of the brightest blue galaxies are relatively undisturbed LIRGs. More work on the triggering and/or quenching mechanism for LIRGs and the transformation of galaxy morphology via mergers is needed to constrain the formation mechanism for E/S0/Sa at .
We wish to thank D. Patton and T. Favorolo for their contributions to this work, and J. Berrier and J. Bullock for access to their early manuscript. We thank O. Ilbert for publicly releasing the CFHTLS photometric redshift catalog. We also thank E. Bell and D. McIntosh for useful discussions. JML would like to thank P. Madau for support during the duration of this project, and acknowledges support from NASA grant NAG5-11513, NASA grants HST-G0-10134.13-A and HST-AR-10675-01-A from the Space Telescope Science Institute which is operated by the AURA, Inc., under NASA contract NAS5-26555, Calspace grant to D.C.K., and the NOAO Leo Goldberg Fellowship. AMH acknowledges support provided by the Australian Research Council in the form of a QEII Fellowship (DP0557850). A.L.C. and J.A.N. are supported by NASA through Hubble Fellowship grants HF-01182.01-A and HST-HF-01165.01-A, awarded by the Space Telescope Science Institute, which is operated by the Association of Universities for Research in Astronomy, Inc., for NASA, under contract NAS 5-26555. AJM appreciates support from the the National Science Foundation from grant AST-0302153 through the NSF Astronomy and Astrophysics Postdoctoral Fellows program. ELF and CP acknowledge support by NASA through the Spitzer Space Telescope Fellowship Program through a contract issued by the Jet Propulsion Laboratory, California Institute of Technology under a contract with NASA. Partial support was also provided through contract 1255094 from JPL/Caltech to the University of Arizona.
Based on observations made with the NASA/ESA Hubble Space Telescope, obtained from the data archive at the Space Telescope Science Institute. STScI is operated by the Association of Universities for Research in Astronomy, Inc. under NASA contract NAS 5-26555. This work is based in part on observations made with the it Spitzer Space Telescope, which is operated by the Jet Propulsion Laboratory, California Institute of Technology under a contract with NASA. Support for this work was provided by NASA through an award issued by JPL/Caltech.
The DEEP2 survey is supported by NSF grants AST00-71198, AST00-71048, AST05-07428, and AST05-7483. The DEIMOS spectrograph was funded by a grant from CARA (Keck Observatory), an NSF Facilities and Infrastructure grant (AST92-2540), the Center for Particle Astrophysics and by gifts from Sun Microsystems and the Quantum Corporation. The data presented herein were obtained at the W.M. Keck Observatory, which is operated as a scientific partnership among the California Institute of Technology, the University of California and the National Aeronautics and Space Administration. The Observatory was made possible by the generous financial support of the W.M. Keck Foundation.
Based on observations obtained with MegaPrime/MegaCam, a joint project of CFHT and CEA/DAPNIA, at the Canada-France-Hawaii Telescope (CFHT) which is operated by the National Research Council (NRC) of Canada, the Institut National des Science de l’Univers of the Centre National de la Recherche Scientifique (CNRS) of France, and the University of Hawaii. This work is based in part on data products produced at the Canadian Astronomy Data Centre as part of the Canada-France-Hawaii Telescope Legacy Survey, a collaborative project of NRC and CNRS.
We also wish to recognize and acknowledge the highly significant cultural role and reverence that the summit of Mauna Kea has always had within the indigenous Hawaiian community. We are most fortunate to have the opportunity to conduct observations from this mountain.
References
- (1) Abraham, R., Tanvir, N.R., Santiago, B.X., Ellis, R.S., Glazebrook, K., van den Bergh, S. 1996, MNRAS, 279, L47
- (2) Allam, S. et al. 2004, AJ, 127, 1883
- (3) Bell, E. et al. 2004a, ApJ 608, 752
- (4) Bell, E. et al. 2004b, ApJ, 600, L11
- (5) Bell, E. et al. 2005, ApJ, 625, 23
- (6) Bell, E. et al. 2006a, ApJ, 640, 241
- (7) Bell, E., Phelps, S., Somerville, R.S., Wolf, C., Borch, A., & Meisenheimer, K. 2006b, ApJ, 652, 270
- (8) Benson, A., Lacey, C.G., Baugh, C.M., Cole, S., & Frenk, C.S. 2002, MNRAS, 333, 156
- (9) Bertin, E. & Arnouts, B. 1996, A&AS, 117, 393
- (10) Berrier, J., Bullock, J.S., Barton, E.J., Guenther, H.D., Zentner, A.R., & Wechsler, R.H. 2006, ApJ, 652, 56
- (11) Birnboim, Y., Dekel, A., & Neistein, E. 2007, MNRAS, 380, 339
- (12) Blanton, M. et al. 2003, ApJ, 594, 186
- (13) Bridge, C.R. et al. 2007, ApJ, 659, 931
- (14) Brown, M. et al. 2007, ApJ, 654, 858
- (15) Bundy, K., Fukugita, M., Ellis, R., Kodama, T., & Conselice, C. 2004, ApJ, 601, 123L
- (16) Bundy, K., Ellis, R.S., & Conselice, C. 2005, ApJ, 625, 621
- (17) Carlberg, R. et al. 2000, ApJ, 532, L1
- (18) Cassata, P. et al. 2005, MNRAS, 357, 903
- (19) Chary, R. & Elbaz, D. 2001, ApJ 556 562
- (20) Coil, A. et al. 2004, ApJ, 617, 765
- (21) Conselice, C. Bershady, M.A., Jansen, A. 2000, ApJ, 529, 886
- (22) Conselice, C., Bershady, M.A., Dickinson, M., & Papovich, C. 2003, AJ, 126, 1183
- (23) Cooper, M. et al. 2006, MNRAS, 370, 198
- (24) Cox, T.J., Jonsson, P., Primack, J.R., & Somerville, R. 2006, MNRAS, 373, 1013
- (25) Davis, M. et al. 2007, ApJ, 660, 1L
- (26) Daddi, E. et al. 2004, ApJ, 600, L127
- (27) Dasyra, K.M. et al. 2006, ApJ, 638, 745
- (28) de Vaucouleurs, G. 1961, ApJS, 5, 233
- (29) de Lucia, G., Springel, V., White, S.D.M., Croton, D., & Kauffmann, G. 2006, MNRAS, 366, 499
- (30) de Propris, R. et al. 2007, ApJ, 666, 212
- (31) Driver, S., Windhorst, R., Ostrander, E.J., Keel, W.C., Griffiths, R.E., & Ratnatunga, K.U. 1995, ApJ, 449, L23
- (32) Faber, S.M., et al. 2007, ApJ, 665, 265
- (33) Flores, H. et al. 1999, ApJ, 517, 148
- (34) Gehrels, N. 1986, ApJ 303, 336
- (35) Giavalisco, M. et al. 2004, ApJ, 600, 93L
- (36) Glasser, G.J. 1962, Amer. Stat. Assoc. 57, 648, 654
- (37) Glazebrook, K., Ellis, R., Santiago, B., & Griffiths, R. 1995, MNRAS, 275, L19
- (38) Gottlöber, S., Klypin, A., & Kravtsov, A. 2001, ApJ, 546, 223
- (39) Hammer, F., Flores, H., Elbaz, D., Zheng, X.Z., Liang, Y.C., & Cesarsky, C. 2005, A&A, 430, 115
- (40) Hibbard, J. & Vacca, W.D. 1997 AJ, 114, 1741
- (41) Hopkins, A.M. 2004, ApJ, 630, 108
- (42) Hopkins, P., Herniquist, L, Cox, T.J., Di Matteo, T., Robertson, B., & Springel, V. 2006, ApJS, 163, 1
- (43) Ilbert, O. et al. 2006, A&A, 457, 841
- (44) Kauffmann, G. & Charlot, S. 1998, MNRAS, 294, 705
- (45) Kampczyk, P. et al. 2007, ApJ in press, arXiv:astro-ph/0611187
- (46) Kartaltepe, J.S. et al. 2007, ApJS, in press, arXiv:0705.2266
- (47) Le Fèvre, O. et al. 2000, MNRAS, 311, 565
- (48) Le Floc’h, E. et al. 2005, ApJ, 632, 169
- (49) Lilly, S., Le Fèvre, O., Hammer, F., & Crampton, D. 1996, ApJ 460 L1
- (50) Lin, L. et al. 2004, ApJ, 617, L9
- (51) Lin, L. et al. 2007, ApJ, 660, 51L
- (52) Lotz, J.M., Primack, J., & Madau, P. 2004, AJ, 613, 262 (LPM04)
- (53) Lotz, J.M., Madau, P., Giavalisco, M., Primack, J. & Ferguson, H.C. 2006, ApJ, 636, 592
- (54) Marcum, P. et al. 2001, ApJS, 132, 129
- (55) McIntosh, D. et al. 2005, ApJ, 632, 191
- (56) Melbourne, J., Koo, D. C., & Le Floc’h, E. 2005, ApJ, 632, 65
- (57) Menanteau, F. et al. 2006, AJ, 131, 208
- (58) Mihos, C. & Hernquist, L. 1996, ApJ, 464, 641
- (59) Moore, B., Lake, G., & Katz, N. 1998, ApJ, 495, 139
- (60) Moustakas, L. et. al. 2004, ApJ, 600, L131
- (61) Noeske, K. et al. 2007, ApJ, 660, 47L
- (62) Papovich, C., Giavalisco, M., Dickinson, M., Conselice, C., & Ferguson, H.C. 2003, ApJ, 598, 827
- (63) Papovich, C. et al. 2006, ApJ, 640, 92
- (64) Papovich, C. et al. 2004, ApJS, 154, 70
- (65) Patton, D.R. et al. 2002, ApJ, 565, 208
- (66) Robertson, B., Bullock, J.S., Cox, T.J., Di Matteo, T., Hernquist, L., Springel, V., & Yoshida, N. 2006, ApJ, 645, 986
- (67) Sanders, D.B. & Mirabel, I.F. 1996, ARA&A, 34, 749
- (68) Sandage, A. 2005, ARA&A, 43, 581
- (69) Scarlata, C. et al. 2007a, ApJ in press, arXiv:astro-ph/0611644
- (70) Scarlata, C. et al. 2007b, ApJ in press, arXiv:astro-ph/0701746
- (71) Schweizer, F. 1982, ApJ, 252, 455
- (72) Schweizer, F., Seitzer, P., Faber, S.M., Burstein, D., Dalle Ore, C.M., Gonzalez, J.J. 1990, ApJ, 364, L33
- (73) Shi, Y., Rieke, G., Papovich, C., Pèrez-González, P.G., & Le Floc’h, E. 2006, ApJ, 645, 199
- (74) Siranni, M. et al. 2005, PASP, 117, 1049
- (75) Spergel, D. et al. 2003, ApJS, 148, 175
- (76) Spergel, D. et al. 2007, ApJS, 170, 377
- (77) Springel, V. & Hernquist, L. 2005, ApJ, 622, L9
- (78) Toomre, A. 1977, in Evolution of Galaxies and Stellar Populations, eds. B.M. Tinsely & R. Larson, (New Haven: Yale University Obs.), 401
- (79) Treu, T. et al. 2005, ApJ, 633, 174
- (80) van Dokkum, P. 2005, AJ, 130, 2647
- (81) Wolf, C.et al. 2005, ApJ, 630, 771
- (82) Weiner, B. et al. 2005, ApJ, 620, 595
- (83) Willmer, C.N.A. et al. 2006, ApJ, 647, 853
- (84) Windhorst, R.A. et al. 2002, ApJS, 143, 113
| z | N(tot) | N(E-Sa) | f(E-Sa)aaThe fractions are corrected by the values given in Table 1. The first set of errors are the 67% confidence intervals from Poisson statistics. Where , the small number Poisson statistics are from Gehrels (1986). The second set of errors are the difference between the observed fraction and the fraction derived from 10,000 bootstrapped realizations of morphological distributions. | fs(E-Sa)bbThe fraction derived for the spectroscopic redshift sub-sample and not corrected for incompleteness. | N(Sb-Ir) | f(Sb-Ir)aaThe fractions are corrected by the values given in Table 1. The first set of errors are the 67% confidence intervals from Poisson statistics. Where , the small number Poisson statistics are from Gehrels (1986). The second set of errors are the difference between the observed fraction and the fraction derived from 10,000 bootstrapped realizations of morphological distributions. | fs(Sb-Ir)bbThe fraction derived for the spectroscopic redshift sub-sample and not corrected for incompleteness. | N(M) | f(M)aaThe fractions are corrected by the values given in Table 1. The first set of errors are the 67% confidence intervals from Poisson statistics. Where , the small number Poisson statistics are from Gehrels (1986). The second set of errors are the difference between the observed fraction and the fraction derived from 10,000 bootstrapped realizations of morphological distributions. | fs(M)bbThe fraction derived for the spectroscopic redshift sub-sample and not corrected for incompleteness. | N(C) | f(C)cc The errors are the 67% confidence intervals from Poisson statistics. Where , the small number Poisson statistics are from Gehrels (1986). | fs(C)bbThe fraction derived for the spectroscopic redshift sub-sample and not corrected for incompleteness. |
|---|---|---|---|---|---|---|---|---|---|---|---|---|---|
| with completeness cut | |||||||||||||
| 0.3 | 181 | 79 | 0.44 0.04 | 0.44 | 86 | 0.47 0.01 | 0.49 | 15 | 0.09 0.03 | 0.07 | 1 | 0.01 | 0.00 |
| 0.5 | 312 | 104 | 0.33 0.04 | 0.34 | 161 | 0.52 0.02 | 0.49 | 45 | 0.13 0.06 | 0.16 | 2 | 0.01 | 0.00 |
| 0.7 | 765 | 291 | 0.37 0.05 | 0.36 | 413 | 0.55 0.06 | 0.55 | 56 | 0.07 0.06 | 0.07 | 5 | 0.01 | 0.00 |
| 0.9 | 676 | 227 | 0.32 0.03 | 0.29 | 399 | 0.61 0.05 | 0.62 | 46 | 0.07 0.09 | 0.07 | 4 | 0.01 | 0.00 |
| 1.1 | 603 | 136 | 0.21 0.00 | 0.15 | 374 | 0.64 0.09 | 0.69 | 79 | 0.13 0.08 | 0.14 | 14 | 0.02 | 0.01 |
| with no completeness cut | |||||||||||||
| 0.3 | 239 | 84 | 0.35 0.02 | 0.35 | 132 | 0.55 0.01 | 0.58 | 22 | 0.09 0.04 | 0.08 | 1 | 0.00 | 0.00 |
| 0.5 | 400 | 111 | 0.27 0.04 | 0.30 | 236 | 0.59 0.02 | 0.55 | 51 | 0.12 0.10 | 0.15 | 2 | 0.00 | 0.00 |
| 0.7 | 939 | 303 | 0.30 0.03 | 0.32 | 559 | 0.60 0.07 | 0.60 | 72 | 0.08 0.07 | 0.07 | 5 | 0.01 | 0.00 |
| 0.9 | 782 | 233 | 0.27 0.02 | 0.26 | 488 | 0.64 0.04 | 0.65 | 57 | 0.07 0.09 | 0.07 | 4 | 0.01 | 0.00 |
| 1.1 | 649 | 138 | 0.18 0.00 | 0.14 | 407 | 0.64 0.07 | 0.69 | 90 | 0.15 0.08 | 0.15 | 14 | 0.02 | 0.01 |
| 0.3 | 14 | 1 | 0.06 0.08 | 0.17 | 8 | 0.54 0.01 | 0.67 | 5 | 0.41 0.04 | 0.17 | 0 | ||
| 0.5 | 42 | 12 | 0.32 0.01 | 0.28 | 19 | 0.47 0.11 | 0.38 | 11 | 0.23 0.06 | 0.34 | 0 | ||
| 0.7 | 151 | 34 | 0.22 0.02 | 0.22 | 96 | 0.63 0.05 | 0.66 | 21 | 0.14 0.03 | 0.11 | 0 | ||
| 0.9 | 153 | 22 | 0.13 0.00 | 0.13 | 119 | 0.79 0.07 | 0.81 | 12 | 0.08 0.10 | 0.05 | 0 | ||
| 1.1 | 144 | 12 | 0.07 0.02 | 0.05 | 111 | 0.77 0.13 | 0.83 | 18 | 0.13 0.08 | 0.10 | 3 | 0.02 | 0.01 |
Note. — The morphology fractions are given for E/S0/Sa (E-Sa), Sb/Sc/Ir (Sb-Ir), merger candidates (M), and objects too compact to classify (C).
| z | N(tot) | N(E-Sa) | f(E-Sa)aa The errors are the 67% confidence intervals from Poisson statistics. Where , the small number Poisson statistics are from Gehrels (1986). | N(Sb-Ir) | f(Sb-Ir)aa The errors are the 67% confidence intervals from Poisson statistics. Where , the small number Poisson statistics are from Gehrels (1986). | N(M) | f(M)aa The errors are the 67% confidence intervals from Poisson statistics. Where , the small number Poisson statistics are from Gehrels (1986). | N(C) | f(C)aa The errors are the 67% confidence intervals from Poisson statistics. Where , the small number Poisson statistics are from Gehrels (1986). |
|---|---|---|---|---|---|---|---|---|---|
| Red sequence galaxies | |||||||||
| 0.3 | 66 | 61 | 0.92 | 2 | 0.03 | 2 | 0.03 | 1 | 0.02 |
| 0.5 | 91 | 74 | 0.81 | 10 | 0.11 | 7 | 0.08 | 0 | |
| 0.7 | 257 | 217 | 0.84 | 27 | 0.11 | 12 | 0.05 | 2 | 0.01 |
| 0.9 | 217 | 166 | 0.76 | 36 | 0.17 | 15 | 0.07 | 0 | |
| 1.1 | 137 | 95 | 0.69 | 40 | 0.29 | 1 | 0.01 | 3 | 0.02 |
| Green valley galaxies | |||||||||
| 0.3 | 8 | 3 | 0.38 | 3 | 0.38 | 1 | 0.12 | 0 | |
| 0.5 | 24 | 11 | 0.46 | 9 | 0.38 | 4 | 0.17 | 0 | |
| 0.7 | 44 | 27 | 0.61 | 15 | 0.34 | 2 | 0.05 | 1 | 0.02 |
| 0.9 | 53 | 19 | 0.36 | 29 | 0.55 | 5 | 0.09 | 1 | 0.02 |
| 1.1 | 38 | 12 | 0.32 | 25 | 0.66 | 0 | 0.00 | 1 | 0.03 |
| Blue cloud galaxies | |||||||||
| 0.3 | 108 | 15 | 0.14 | 81 | 0.75 | 12 | 0.11 | 0 | |
| 0.5 | 197 | 19 | 0.10 | 142 | 0.72 | 35 | 0.18 | 2 | 0.01 |
| 0.7 | 467 | 47 | 0.10 | 371 | 0.79 | 46 | 0.10 | 2 | 0.00 |
| 0.9 | 415 | 42 | 0.10 | 334 | 0.80 | 36 | 0.09 | 3 | 0.01 |
| 1.1 | 423 | 28 | 0.07 | 309 | 0.73 | 82 | 0.19 | 10 | 0.02 |
Note. — The morphology fractions are given for E/S0/Sa (E-Sa), Sb/Sc/Ir (Sb-Ir), merger candidates (M), and objects too compact to classify (C).