Multiwavelength star formation indicators: Observations11affiliation: Based on observations made with the NASA/ESA Hubble Space Telescope, which is operated by the Association of Universities for Research in Astronomy, Inc., under NASA contract NAS5-26555. 22affiliation: Based on observations obtained with the Apache Point Observatory 3.5-meter telescope, which is owned and operated by the Astrophysical Research Consortium.
Abstract
We present a compilation of multiwavelength data on different star formation indicators for a sample of nearby star forming galaxies. Here we discuss the observations, reductions and measurements of ultraviolet images obtained with STIS, on board the Hubble Space Telescope (), ground-based H, and VLA 8.46 GHz radio images. These observations are complemented with infrared fluxes, as well as large aperture optical radio and ultraviolet data from the literature. This database will be used in a forthcoming paper to compare star formation rates at different wavebands. We also present spectral energy distributions (SEDs) for those galaxies with at least one far-infrared measurements from ISO, longward of 100m. These SEDs are divided in two groups, those which are dominated by the far-infrared emission, and those where the contribution from the far-infrared and optical emission is comparable. These SEDs are useful tools to study the properties of high redshift galaxies.
1 Introduction
The global star formation history of the Universe is one of the crucial ingredients for understanding the evolution of galaxies as a whole, and for discriminating among different formation scenarios, (Madau, Pozzetti & Dickinson 1998; Ortolani et al. 1995; Baugh et al. 1998). Star formation is traced by a number of observables, often complementary to each other. The ultraviolet (UV) is where the bulk of the energy from young, massive stars is emitted, but it suffers from the effects of dust extinction. The nebular emission line H is a tracer of ionizing photons, and thus of young, massive stars, but is also affected by assumptions on the stellar initial mass function. The far-infrared (FIR) emission comes from the dust-processed stellar light and reliably tracks star formation in moderately to very dusty galaxies, but is not a narrow band measurement (like the UV or H) and needs to be measured across the entire infrared wavelength range. Finally, the non–thermal radio emission is a tracer of the supernova activity in a galaxy, but suffers from uncertain calibration.
In recent years, all wavelength regions have been exploited to track down star formation at all redshifts, and trace the star formation history of the Universe. At high redshift the Lyman-break galaxies (Steidel et al. 1996, 1999) provide the bulk of the UV light from star formation, while SCUBA has been used to detect the brightest FIR sources in the range 1z3–4 (e.g., Barger et al. 1999,2000; Smail et al. 2000; Chapman et al. 2003). The Lyman-break galaxies are, by selection, actively star-forming systems, resembling in many aspects local starburst galaxies (Pettini et al. 1998; Meurer et al. 1997; Meurer, Heckman & Calzetti 1999) , and possibly covering a large range in metal and dust contents (Pettini et al. 1999; Steidel et al. 1999; Calzetti 1997). The SCUBA sources occupy the high-end of the FIR luminosity function of galaxies (Blain et al. 1999), and are dust-rich objects. The relationship between the UV-selected and FIR-selected luminous systems is not yet clear. Whether the two types of galaxies represent two distinct populations or the two ends of the same population is still subject to debate (Adelberger & Steidel 2000). The answer to this question can drastically change our understanding of the evolution, star formation history and metal/dust enrichment of galaxies.
The difficulty in relating the two types of galaxies stems from the paucity of simultaneous UV, H, FIR(100 m), and radio data for both low- and high-z galaxies. While multiwavelength observations of high-z galaxies are presently hampered by the sensitivity and positional accuracy limitations of current instrumentation, multiwavelength observations of local galaxies are within the accessible realm and are key for producing the spectral energy distributions (SEDs) that can be used as templates for higher redshift observations. To be representative, such SEDs should cover as completely as possible the parameter range of properties (metallicity, luminosity, etc.) of galaxies.
This paper presents a large, homogeneous dataset of multiwavelength observations of 41 local (closer than 120 Mpc) star–forming galaxies, spanning from the UV to the radio. The UV observations are from our own HST/STIS imaging centered at 1600 Å. The optical data (H) and radio (6 cm and 21 cm) data are from ground-based programs complementary to the HST observations. The FIR data are from archival IRAS and ISO observations spanning the wavelength range 12-200 m.
The data in this paper provide a uniform dataset, in terms of type of data, reduction and calibration strategies in each wavelength range, that will be used in an accompanying paper to re-evaluate star formation rate indicators at the different wavelengths.
2 Sample
The global list of galaxies in our sample is presented in Table 1, where we give their coordinates, radial velocities, distances, diameters, morphological types and foreground Galactic reddening. We gave preference to Galactic reddening values from Burstein & Heiles (1982) instead of Schlegel et al. (1998), because in the case of galaxies with high foreground reddening, like NGC 1569, the latter values result in too high a correction (i.e., an unphysically blue spectrum). Nevertheless, this correction is usually very small and the difference between the two values does not introduce a significant variation between the final fluxes. The sample is composed of 41 galaxies, which were selected according to the following criteria: 1-) IRAS 100 m flux 1 Jy, to ensure detection with the ISO long wavelength camera; 2-) recession velocity 9000 km s-1, to resolve spatial scales as small as 35 pc with STIS, which is the scale of large OB associations or giant molecular clouds; 3-) mean angular diameter D4′, to ensure that the sources were seen as point-like by the ISO long wavelength camera; 4-) L(H)1039 erg s-1 in the central 5, to select active, centrally star-forming objects; 5-) absence of or, at worst, weak non-thermal nuclear activity, as determined by the nuclear emission line properties of the galaxies (e.g. Ho et al. 1997). We retained only 4 of these active galaxies in our sample, those where the nuclear spectrum (inner 2″) shows emission line ratios typical of AGNs, while a more extended spectrum, encompassing a region of 10″ or larger, has emission line ratios typical of HII regions. We estimate, based on the comparison of the nuclear and integrated H or radio emission that the AGN contributes to, at most, 10% of the total luminosity in these galaxies.
Our sample specifically excluded ultraluminous infrared galaxies (ULIGs), because data for a significant number of such sources are available from the literature (Goldader et al. 2002), obtained in a intrumental configuration similar to ours. Our project aimed at covering the IR luminosity range of more normal galaxies, thus extending the low bound of this parameter by a factor 103, in order to accomodate the fact that high redshift galaxies may not all be as IR-luminous as ULIGs. Nevertheless, we collected the data available on ULIGs in the literature and will take them into consideration in our analysis paper (Schmitt et al. 2005b).
The final sample covers a wide range of intrinsic properties. The host galaxy morphologies vary from regular spirals to interacting/merging systems. The bolometric luminosities, calculated based on the infrared luminosities and the correction factor given by Calzetti et al. (1999) vary by a factor of almost a thousand, with NGC 1569 having L, while IC 1623 has 4.7, close to the ULIG limit. This sample also covers a large factor in star formation activity, from the post-starburst in NGC 1569 up to the FIR-luminous starburst in IC 1623; as well as a factor of 10 in metallicity, from metal poor galaxies like TOL 1924-416, which has [O/H]=8.0, to metal rich ones like NGC 7552, which has [O/H]=9.3 (Storchi-Bergmann, Calzetti & Kinney 1994). Although this sample covers a wide range of intrinsic properties, one should keep in mind that it was culled from the ISO archive, so the galaxies may have been observed because of some characteristic of particular interest for the original observers. As a result, the final sample may not necessarily be representative of typical galaxies.
Complete UV-H-radio coverage is achieved for 26 out of 41 galaxies, due to various limitations (e.g. snapshot nature of the HST observations, weather, declination of the source). Complete coverage using our own data was obtained for 13 galaxies, with the other 13 using literature data to supplement our own data. For an additional 11 galaxies we have data for 2 of the 3 wavelengths (UV, H, or radio).
3 Observations and Reductions
In this section we present the details of our multiwaveband observations, reductions and measurements. We also present ultraviolet, optical, infrared and radio data collected from the literature, which are complementary to our observations and will be used in a forthcoming paper. Table 2 presents the details about the different observations.
3.1 Ultraviolet Observations
Ultraviolet images were obtained for 22 of the galaxies in our sample (50%), using STIS on board the HST. The observations of 21 of the galaxies were done as part of the snapshot project 8721 (P.I. Calzetti), using the FUV-MAMA detector and the filter F25SRF2. We also obtained HST archival data for IC 1623, which was observed with the same configuration by the project 8201 (P.I. Meurer). The names of the datasets in the HST archive and exposure times of the images are given in Table 2. Our images have a pixel size of 0.025″ and a field of view of 25″25″ (10241024 pixels). The filter used for these observations (F25SRF2) is centered at 1457Å, and has a bandwidth of 284Å, which is slightly contaminated by geocoronal OI1302Å. Guiding problems happened during the observations of MRK 555, which resulted in the drifting of the spacecraft. This produced slightly elongated point sources, but did not affect the integrated flux of this galaxy.
The reduction and calibration of the data followed standard procedures. The images of the galaxies in our snapshot project were obtained in single exposures of 1320 seconds each. Only IC 1623, had its observations split into multiple exposures, which had to be registered and combined. Background levels and standard deviations () were determined on emission free regions of the images. The images were background subtracted, clipped at the 3 level (pixels with flux lower than 3 were set to zero) and flux calibrated using the information available in their headers. The UV fluxes of the galaxies, obtained integrating the emission in the final images, as well as the 3 detection limits, are given in Table 3. These values are not corrected for Galactic extinction.
Throughout this paper we use the technique of measuring the fluxes of the images inside the 3 level, and not by integrating everything inside a given aperture. The reason for doing a cut at the 3 level is to avoid spurious background variations and flatfielding errors. We tested the effect this technique has in the fainter, lower surface brightness sources, by comparing measurements of both H and UV done in this way, with measurements done without clipping the images at the 3 level. We find that in most of the cases the difference between the two techniques is negligible, while in the worst cases it can represent a 5% difference in the total H flux, well within our measurement uncertainties (see below). Another way to estimate that this approach will cause an insignificant error to the integrated fluxes is based on the fact that the area covered by pixels between 3 and 6 is small, as can be seen in the figures, suggesting that the area associated with the object and covered by pixels below 3 should also be small. Combining this information with the fact that the 3 flux level is very small compared to the regions where the bulk of the emission originates, indicates that this approach will not change the measured flux significantly. The errors involved in the UV flux measurements are of the order of 5%. These errors are mostly due to the stability of STIS and the accuracy of the flux calibration. We estimate that the contribution from Poisson noise to the error budget is very small, accounting to less than 1% even in the case of the fainter galaxies observed (NGC 3079 and NGC 4088). For simplicity we assume a uniform 5% flux error for all sources.
3.2 H Observations
The H images presented in this paper were obtained in 4 observing runs on 3 different ground based telescopes (APO, KPNO and CTIO). We also use archival HST narrow band images of NGC 1569 and NGC 4214. These images were complemented with large aperture H fluxes from the literature, available for several galaxies which we could not observe.
The APO observations were done with the 3.5 m telescope on the second half of the night of 2000 July 3/4. We used SPIcam, binning 2 pixels in both direction, which gives a scale of 0.28″pixel-1 and a field of view of 4.8′4.8′ (10241024 pixels). Two filters were used for these observations, one centered at 6450Å, with a bandwidth of 100Å, and one centered at 6590Å, with a bandwidth of 25Å. These filters were used for continuum and line observations, respectively. The continuum observations consisted of 2 exposures of 300 seconds for NGC 6217 and 2 exposure of 90 seconds for NGC 6643. The on-band exposure times are give in Table 2. We also observed spectrophotometric standard stars from Oke (1990).
The CTIO observations were done with the 1.5m telescopes on the nights of 2000 August 01/02 – 08/09. We used the focal ratio f/13.5 and the detector Tek 2k #6, which gives a scale of 0.24″pixel-1 and a field of view of 8.2′8.2′ (20482048 pixels). The filters and integration times used for the narrow band H observations are given in Table 2. We also obtained broad R band images for each one of the galaxies, which were used to subtract the continuum contribution from the line images. These broad band images usually were split into 3 exposures of 500 seconds each. We observed spectrophotometric standard stars from Stone & Baldwin (1983) and photometric standards from Landolt (1992) for the calibration of the narrow and broad band images, respectively.
The KPNO observations were done with the WIYN 3.5m telescope on two different runs, on the nights of 2001 May 16/17 – 18/19, and 2001 November 05/06 – 06/07 (we refer to these runs as WIYN-1 and WIYN-2, respectively, in Table 2). We used the Mini-Mosaic, which gives a pixel scale of 0.14″pixel-1 and a field of view of 9.6′9.6′ (40964096 pixels). The filters and integration times used for the narrow band H observations are indicated in Table 2. As for the CTIO observations, we obtained 2 or 3 images of 120 seconds each in the R band, which were used for the continuum subtraction. The narrow band images were calibrated using observations of spectrophotometric standards from Oke (1990), while the broad band ones were calibrated using standard stars from Landolt (1992).
The data reductions followed standard IRAF procedures, which started with the overscan and bias subtraction, and the division of the images by normalized flat-fields. The individual images of each galaxy were aligned, convolved to bring both the line and continuum images to a similar PSF size, and combined to eliminate cosmic rays. The background was determined from emission free regions around the galaxy, fitted with a polynomial function to eliminate residual illumination gradients, and subtracted. The data were calibrated using the standard star observations, and the World Coordinate System, obtained from stars in the field of the galaxy, was added to the image headers. Whenever needed the fluxes were also corrected for redshift effects, taking into account where the H line fell on the transmission curve of the filter.
The continuum subtraction was done in two different ways. In the case of the APO observations, the continuum images were not contaminated by line emission. In this case, these images were scaled to match the width of the line filter, and subtracted. We confirm, by checking stars around the galaxy that this procedure did not over or undersubtract the continuum. In the case of all the other observations, we used a similar technique for the continuum subtraction, but had to do it recursively. Since the R band images, which were used for the continuum, are contaminated by line emission (1.5% of the integrated flux on average), they have to be corrected for this contribution to their flux, otherwise a simple subtraction of the scaled R band image from the line image will underestimate the total H flux. The recursive subtraction was done by first subtracting the scaled continuum image from the line image. The resulting line image was then scaled and subtracted from the continuum image, to remove the emission line contribution to this image, and the corrected continuum image was then used to subtract the continuum emission from the original line image. This process was repeated a few times, until the H and continuum fluxes in regions affected by contamination changed by less than 0.5% between consecutive iteration. This indicated that the process have converged. We usually needed only 2 to 3 iterations to reach this level.
The noise of the final continuum free images was determined on emission free regions of the frame, and the images were clipped at the 3 level. Total H fluxes [F(H)int] were measured by integrating all the emission in these images. For a few of the galaxies (e.g. NGC6753, TOL1924416) the flux measurement had to take into account foreground stars. In most of the cases the stars lie in the outskirts of the galaxies, in areas without any H emission. The area around the stars was excluded from the flux measurements, in order to avoid possible subtraction residuals that cloud artificially increase the flux. The only galaxy for which a foreground star could present a problem is TOL1924416 (Figure 13). However, even in this case the error caused by the star should not account for more than 1% of the integrated flux, since the residuals are not very large and the star is in a region of faint H emission.
For those galaxies with H and UV observations, we rotated and registered the two images, and measured the H flux inside a region matching the one covered by the UV observations [F(H)match]. These fluxes and detection limits are given in Table 3, where we also give integrated H fluxes obtained from the literature, for those galaxies which we did not observe. For NGC 1672 and NGC 5383, we were also able to obtain published H fluxes in regions matching the ones observed in the UV. A comparison between F(H)match and F(H)int shows that most of the H flux originates in the region covered by the UV observations. The median F(H)match/F(H)int value for our galaxies is 0.92.
Contamination by [NII]6548,84Å is a concern for these measurements, since it can make a considerable contribution to the flux of the images. We deal with this problem by using spectroscopic data from the literature, preferentially large aperture spectra. In this way we minimize problems such as enhanced [NII] emission at the nucleus, which can be due to higher metallicity, or even the presence of a low luminosity AGN. We give in Table 3 the [NII]/H ratios, slit areas through which they were observed, and the H fluxes corrected for [NII] contamination (F(H) and F(H)). This correction was calculated based on the observed [NII]/H ratios, the redshifts of the galaxies and on-band filter transmission curves used to observe them. Notice that these corrected values are likely to be a lower limit of the real flux, since the observed emission line ratio may still be dominated by the brighter regions of emission. Since these regions usually are related to the nucleus, which has higher metallicity, they should also have higher [NII]/H ratios.
Finally, we estimate the errors in our flux measurements. A significant part of the errors come from the flux accuracy of the calibration stars, which is of the order of 4-5%. Other effects that can introduce errors of a few % in the fluxes are residuals from the flat-field correction, variations of the sky transparency overnight, uncertainties in the Galactic foreground reddening correction, and residuals from the sky and continuum subtraction. Poisson noise can also introduce some uncertainties in the flux measurements, but this source of error is much smaller than 1% in our case. Taking all these sources of error into account, we make the conservative assumption that the error in our flux measurements is of the order of 10%.
3.3 Radio Observations
The 8.46 GHz (3.5 cm) radio observations of most of the galaxies in the sample were done with the VLA in two different runs, both part of the project AS 713. The first run was 7 hours long, during the CnB configuration, on 2001 June 24. We observed galaxies with , or during this run. Most of the remaining galaxies were observed on the second run, which was 13.5 hours long during the C configuration, on 2001 July 11. Besides these observations, we obtained data from the archive for those sources which had already been observed with a similar configuration. We also obtained archival 4.89 GHz (6 cm) data for the galaxies ESO 350-G 38, NGC 1741 and ESO 400-G 43, which did not have fluxes available in the literature. New 1.49 GHz (20 cm) observations of NGC 7552, not available on the NVSS survey (Condon et al. 1998), were obtained on 2002 March 23, during the A configuration, as part of the project AS 721. We present in Table 2 the configurations in which the galaxies were observed, the integration times and proposal codes from which they were obtained.
All the observations were done in continuum mode with 2 IF’s of 50 MHz bandwidth each, using the radio galaxies 3C 48 and/or 3C 286 as primary calibrators. The phase calibration was done using calibrators from the NRAO list, preferentially A-category calibrators closer than 10∘ from the galaxies. Most of the observations were done sandwiching 10 minutes observations of the galaxy with short 2-3 minutes observations of a phase calibrator, repeating the process for 2 or 3 times. The reductions followed standard AIPS techniques, which consisted of flagging bad data points, setting the flux-density scale using the primary calibrators and phase calibrating using the secondary calibrators. For those sources with peak flux densities of 1 mJy or higher, we interactively self-calibrate them two or three times in phase. The images were created using uniform weighting. The final resolution of the 8.46 GHz images was of the order of 3″, and the maximum angular scales to which the observations were sensitive is 3′. Given that some of the galaxies in our sample have diameters of 3′ or larger, like NGC 6643, our observations may have missed the short spacings, thus resolving out the more extended emission. This is a limination of the observations, which can result in fluxes smaller than the real ones, and can be solved by single dish 8.46 GHz observations. Such problems were not an issue at 4.89 GHz and 1.49 GHz, since these observations were done either with a single dish, or in the most compact VLA configuration.
The noise of the images was determined in regions free from emission. The total Stokes I fluxes [S(8.46 GHz)int] were obtained by integrating the regions brighter than 3 above the background level. The fact that different galaxies can have a range of in the 3 sensitivity level does not have a significant impact on their integrated fluxes, since most of the lower level flux does not cover large regions and the integrated fluxes are dominated by the stronger regions. The errors in the flux measurements were calculated by taking into account, in quadrature, a 1.5% uncertainty in the flux calibration and Poisson noise, which usually dominates the errors. For the galaxies for which we also have UV images, the radio images were rotated, registered and their fluxes were measured inside a region matching that observed in the UV [S(8.46 GHz)match]. These values, and the beam sizes of the final images are presented in Table 4. This Table also gives large beam 1.49 GHz and 4.89 GHz fluxes obtained from the literature. Like in the case of the H emission, we find that in most of the 8.46 GHz emission originates in the region covered by the UV observations, with the median S(8.46 GHz)match/S(8.46 GHz)int being 0.7.
3.4 Optical and Infrared Data from the Literature
Complementary to the images presented in this paper, we also collected infrared, optical and ultraviolet data from the literature. The mid and far infrared data, which will be used to determine the infrared luminosities and star formation rates of the galaxies, were obtained from IRAS and ISO. These observations are presented in Table 5, they were obtained with low spatial resolution, of the order of arminutes, which ensures that only in the case of the most extended galaxies we may be missing a small amount of emission. Nevertheless, even in cases like this the missing flux should be negligible, since most of the emission is concentrated toward the nucleus. The estimated uncertainty in the IRAS fluxes is of the order of 6%, while the errors from the ISO measurements are given in Table 5.
Ultraviolet, optical and near-infrared data are presented in Table 6. These fluxes, combined with the mid and far-infrared ones, will be used to calculate the bolometric luminosity of the galaxies. The ultraviolet fluxes were obtained from IUE observations, which have an aperture of 10″20″ (Kinney et al. 1993). The errors in these flux measurements are given in Table 6. For cases where we have both STIS 1457Å and IUE 1482Å observations, we use the ratio between these two measurements to scale the IUE fluxes at longer wavelengths and avoid aperture mismatch problems. For the galaxies that only have IUE measurements, we do not try to apply any correction to the fluxes. This can result in an uncertainty of a factor of 2 relative to the integrated flux (see Section 5). We would also like to notice that for those galaxies for which only IUE measurements are available we do not try to measured matched aperture H fluxes.
Optical (U, B, V and R band) and near infrared (J, H and K band) data were obtained from broad band photometry, extrapolated to include the emission from the entire galaxy (de Vaucouleurs et al. 1991; Jarrett et al. 2003). The errors in the optical and near-infrared flux measurements are 10% and 5%, respectively. These values are ideal for the comparison with far-IR data. The near infrared fluxes are mostly from 2MASS observations, while the optical ones were obtained from multiple sources in NED. These broad band fluxes were converted to monochromatic fluxes using standard filter curves.
4 Individual Objects
4.1 Galaxies with UV, H and Radio Observations
4.1.1 MRK 555
Approximately 30% of the UV emission originates in a circumnuclear ring of 1″, and we can also see other regions of emission, either diffuse or in the form of clumps, at distances larger than 10″ from the nucleus (Figure 1, left column). The H and radio images show strong emission associated with these regions, besides emission along the spiral arms of the galaxy, which was not covered by the UV image.
4.1.2 NGC 1569
This is a nearby post-starburst galaxy (de Vaucouleurs, de Vaucouleurs, & Pence 1974; Hodge 1974; Israel 1988) strongly affected by Galactic foreground extinction (Figure 1, right column). The UV image shows two large clusters, separated by 8″ along the NW-SE direction, as well as several smaller clusters around them. The H and radio emission trace each other, however, they are anti correlated relative to the UV. Regions of strong UV emission have weak H and radio emission, indicating that the gas has been evacuated by winds.
4.1.3 NGC 1667
The nucleus of this galaxy hosts a low luminosity Seyfert 2 (Ho et al. 1997). The images (left column of Figure 2) show that the AGN contributes very little to the overall UV, H and Radio emission. Less than 1% of the UV emission originates from the nucleus of this galaxy (inner 2″), where the emission may in part be due to nuclear radiation scattered in our direction, or by circumnuclear star formation. Most of the emission in this band comes from star forming regions along the spiral arms of the galaxy. The H image shows significantly stronger emission at the nucleus, related to the Seyfert 2 nucleus of this galaxy. It also shows emission from the star forming regions along the spiral arms. The radio image shows strong emission related to the galaxy, however, due to the fact that this emission is weak, we were not able to self calibrate this image and some closure errors can still be seen.
4.1.4 NGC 1741
The UV image shows two clumps of emission, associated with the two nuclei of this galaxy, separated by 4″ in the N-S direction (Figure 2, right column). These two clumps are surrounded by smaller clusters of emission. We can also see some diffuse emission extended to the NE of the northernmost nucleus, as well as a tidal tail extending to the E. The H emission has a distribution similar to the UV, and also shows two tidal tails extending for 1′ to the SE and SW. The radio image shows emission associated only with the double nucleus, where we can see that the stronger radio source corresponds to the fainter UV nucleus. The UV image was registered to the H one, which is consistent with the radio.
4.1.5 NGC 4088
The UV image is mostly empty, presenting only one strong clump of emission and some diffuse emission (Figure 3, left column). The H image shows emission related to star forming regions throughout the disk of the galaxy. The radio image shows emission related to stronger star forming region of the galaxy, but is not deep enough to detect the fainter, more diffuse regions seen in H.
4.1.6 NGC 4214
The UV image shows one strong clump of emission at the nucleus and another clump on the eastern border of the image (Figure 3, right column). Like for NGC 1569, the H and radio emission trace each other, but are very faint in regions of strong UV emission, indicating that the gas have been evacuated from these regions. Notice that this galaxy is close enough to allow us to resolve individual stars in the STIS image.
4.1.7 MRK 799
The ultraviolet image of this galaxy (Figure 4 left column) shows some faint emission, either diffuse or in the form of clumps, related to the spiral arms of the galaxy. The H and radio images trace this emission at the nucleus and, besides the region of strong emission at 20″ to the SE and some faint emission to the N of the nucleus, outside the region covered by the UV image.
4.1.8 NGC 5860
The images of this starburst galaxy are presented in the right column of Figure 4. Notice that all the panels are shown on the same scale, so we do not show the box indicating the region covered by the UV observations in the H image. The UV emission is distributed in two regions of similar intensity, separated by 12″ along the N-S direction. The H image shows strong emission associated with the southern component, but only fainter emission related to the northern one, suggesting that it may be older than the southern one. The radio image, however, only shows emission relate to the southern component, in puzzling contradiction with the interpretation of the H image.
4.1.9 ESO 400-G 43
The left column of Figure 5 shows the images of this galaxy. The UV image shows a very complicated structure, where we can identify several individual clusters, as well as a detached clump of emission to the N. The H and radio images show structures similar to the UV, however, the radio image does not show any emission related to the N component, probably due to the sensitivity limit of the observations.
4.1.10 NGC 6217
The UV image of this galaxy (Figure 5 right panel) shows strong emission related to the nucleus and some fainter emission in the outer parts of the image. The H image detects strong nuclear emission, but also detects a large number of fainter star forming regions along the spiral arms of the galaxy, outside the region covered by the UV image. The radio image is not sensitive enough to detect the fainter region of emission seen in H, showing only a nuclear source and two faint point sources in the field, one of which is not related to the galaxy.
4.1.11 NGC 6643
Figure 6, left panel, presents the UV image of this galaxy, which is mostly empty, showing only two faint point sources. The H image shows regions of star formation throughout the galaxy disk, while the radio one shows only two point sources. Most of the diffuse emission seen in H is not detected in the radio due to the sensitivity limit of the observations.
4.1.12 MRK 323
The UV image of this galaxy shows only two point sources in the northern border of the image (Figure 6 right column), which correspond to a region of strong H emission. The H image also shows some fainter emission around the nucleus of the galaxy, which is related to the strongest region of radio emission.
4.1.13 MRK 332
The UV image of this spiral galaxy (Figure 7) presents strong emission associated to the nucleus, as well as several star forming regions along the spiral arms. The H emission traces what is seen in the UV, and also shows strong emission along the spiral arms, outside the region covered by the UV image. The radio shows only a strong nuclear point source, and some faint emission corresponding to the spiral arms.
4.2 Galaxies with UV and Radio Observations
4.2.1 IC 1623
This is an interacting galaxy with a double nucleus (Knop et al. 1994). The UV image (Figure 8 top) shows only the western component, while the eastern one is completely enshrouded by dust, being visible only at longer wavelengths. The radio image shows emission related to both components, however, the stronger source is related to the eastern, more obscured, structure. A detailed study of the UV image of this galaxy is presented by Goldader et al. (2002), found that both components have similar bolometric luminosities.
4.2.2 NGC 3079
This is an edge on spiral galaxy, with several regions of star formation along the disk (Cecil et al. 2001). The UV image (Figure 8 middle panel) is mostly empty, showing only traces of emission, due to the high amount of extinction along the line of sight. The radio image shows a strong point source at the nucleus and a lobe at 20″ NE, both related to a hidden AGN (Duric et al. 1983). The radio image also shows strong emission along P.A., related to star forming regions along the galaxy disk. The H image from Cecil et al. (2001) shows strong emission along the disk, as well as a nuclear outflow, related to the radio lobe.
4.2.3 NGC 4861
We present in the bottom panel of Figure 8 the UV image of this nearby starburst galaxy. The emission is divided into two large clumps, one corresponding to the nucleus, in the center of the image, which is composed of several smaller clusters. The second clump is more diffuse, located 9″ to the NE. The radio image shows strong emission related to the nucleus, but nothing towards the NE structure. Dottori et al. (1994) presented an H image of this galaxy, which shows emission related with all the structures seen in the UV.
4.2.4 NGC 5383
The UV image of this galaxy (Figure 9 top left panel) shows several clusters, as well as some diffuse emission, extended for 20″ in the E-W direction in the form of a ring, or inner spiral arms. Comparing this image with the H one presented by Sheth et al. (2000), we see that they trace each other, with the regions of strong H emission following the ones with strong UV. The overall structure of the radio emission (right panel) is similar to the H and UV. However, when they are compared in detail we find that the peak of the radio emission is located in a region with little, or no UV and H emission. This enhanced radio emission could be related to a region of star formation hidden by dust, or to the nucleus of the galaxy. The latter possibility implies that this galaxy harbors a low luminosity AGN. If this is true, this AGN should be completely hidden, since Ho, Filippenko & Sargent (1997) classified this galaxy as HII.
4.2.5 NGC 5676
Figure 9, middle panel, presents the UV and radio images of this galaxy. Only faint emission is detected in the UV. The radio image also shows faint emission in the same region covered by the UV observations, indicating that the faint emission is due to low star formation rate rather than obscuration. A region with stronger radio emission is seen to the N of the nucleus, and outside of the STIS field of view.
4.2.6 NGC 5713
The UV and radio images of this galaxy are presented in the bottom panel of Figure 9. The UV emission shows several associations, with the strongest ones located to the northern part of the image. The radio emission is concentrated in a string of knots, aligned with the structures seen in the northern part of the UV image. The two easternmost knots correspond to regions of emission in the UV, but the third one, around right ascension 14:40:10.7, is related to a region without UV emission. Conversely, analyzing the regions to the west of the UV image, we can detect strong UV emission, but only weak radio emission is associated with these structures.
4.2.7 UGC 11284
This is an interacting galaxy where the eastern component presents stronger H emission than the western one (Bushouse 1986). The UV observations were centered on the eastern component, but we detect only a faint compact source coincident with the radio peak and some diffuse emission to the east, which is also visible in the radio (Figure 10). The radio image shows the two galaxies and some faint emission between them. Like in the case of H, the eastern component is the strongest one, suggesting that the star forming region is highly reddened, or the possible presence of a hidden AGN. The integrated 8.46 GHz flux given in Table 4 corresponds to the flux of the two galaxies, to be consistent with the region covered by the far-IR observations.
4.3 Galaxies with H and Radio Observations
4.3.1 ESO 350-G 38
The H and radio emission of this starburst galaxy (Figure 11 top) show a good agreement. Both images show a Y shaped structure at the nucleus, with the strongest emission coming from the center. The H image shows some diffuse emission surrounding this Y shaped structure, which is not seen in the radio. The UV image of this galaxy (Kunth et al. 2003) shows strong emission related to the E and S component, but only faint emission related to the strong nuclear source seen in H and radio.
4.3.2 NGC 232
The middle panels of Figure 11 present the H and radio images of this galaxy, which shows strong H emission concentrated at the nucleus and in a blob at 3.5″ W of it. We also see more diffuse emission extended along P.A., which is in the direction at which the radio emission is extended.
4.3.3 NGC 337
This galaxy presents diffuse H emission distributed throughout the disk (Figure 11 bottom panel), as well as some clumps with stronger emission. The structure of the radio emission is similar to that seen in H, however, a significant part of the diffuse emission is resolved out in the radio image, because the observations do not have short spacings.
4.3.4 NGC 5161
The H image of this galaxy presents small star forming regions along the spiral arms, as well as some faint emission related to the nucleus (Figure 12 top). The radio image shows emission at the nucleus, and some faint emission related to the host galaxy.
4.3.5 NGC 6090
Figure 12, middle panel, presents the H and radio images of this galaxy, which have similar structures. The emission is divided into two major knots, separated by 6″ along the NE-SW direction. The NE structure can be divided into two components separated by 2″ in the N-S direction.
4.3.6 NGC 7496
This galaxy has a low luminosity AGN in the nucleus, classified as a Seyfert 2 (Kinney et al. 1993), nevertheless it also shows strong circumnuclear star formation. The bottom panels of Figure 12 present the H, which shows several blobs of emission around the nucleus, a strong region of emission at 40″ NW, as well as some faint star forming regions along the disk. The radio image shows emission related to the nuclear and circumnuclear region and a faint point source at 1′ N.
4.3.7 NGC 7552
This is a nuclear starburst galaxy. The H and radio images (Figure 13 top) show the presence of a circumnuclear ring, as well as star formation along the bar of the galaxy (similar structures were detected by Hameed & Devereux 1999). The H image also shows some emission along the spiral arms, which is too faint to be detected by our radio observations.
4.3.8 TOL 1924-416
The bottom panel of Figure 13 shows the H and radio images of this galaxy. The emission in these bands is very similar, two blobs separated by 6″ along the E-W direction. The H image shows some diffuse emission surrounding these structures, which is not seen in the radio. A detailed high spatial resolution study of this galaxy was presented by Östlin, Bergvall & Rönnback (1998), who detected a large number of star clusters in this galaxy. These starbursts show peaks in the age distribution, with the younger ones being found in the starburst region. The galaxy is in a merging state, which probably caused the starburst. At 10″ SW from the westernmost H blob we see some image defects due to residuals from the continuum subtraction of a foreground star.
4.4 Galaxies with Observations in a Single Band
4.4.1 IC 1586
This galaxy was observed only in the radio. The 3.6 cm image (Figure 14 top left), shows two faint blobs, separated by 7″ in the NE-SW direction.
4.4.2 NGC 1155
The radio emission of this galaxy presents only a compact source (Figure 14 top right)
4.4.3 UGC 2982
The radio emission of this galaxy is presented in Figure 14 (middle left panel). It is diffuse and extended for approximately 45″ along the E-W direction.
4.4.4 NGC 1614
The 3.6 cm image of this galaxy consists of a strong point source, surrounded by faint emission, extended by 25″ in the E-W direction (Figure 14 middle right). The structure of the radio emission is similar to that seen in H (Armus, Heckman & Miley 1990).
4.4.5 NGC 3690
Figure 14 (bottom left panel) presents the radio image of this galaxy. The bulk of the emission is concentrated in a region with a diameter of 50″. The emission in this region consists of several blobs and some faint emission surrounding it. Fainter emission can be seen towards the NW. The radio and H emission of this galaxy have similar structures (Armus et al. 1990).
4.4.6 NGC 4100
Most of the radio emission of this galaxy (Figure 14 bottom right) is very faint and diffuse, close to the detection limit of the observation. A region with stronger emission is seen around the nucleus.
4.4.7 NGC 5054
The radio image of this galaxy, presented in the top panel of Figure 15, shows stronger emission at the nucleus, surround by a region of fainter and diffuse emission, with a radius of 40″.
4.4.8 NGC 7673
Figure 15 (middle panel) shows the radio emission of this galaxy, which has the form of a ring, composed of 3 knots, more or less centered around the nucleus. Homeier & Gallagher (1999) presented the H image of this galaxy, which has a structure similar to the one seen in the radio. Their image also shows a region of strong emission between the two brighter radio structures, which does not seem to have a counterpart in the radio.
4.4.9 NGC 7714
The radio emission of this galaxy presents a strong point source at the nucleus (Figure 15 bottom panel) and some diffuse emission around it, extending by approximately 30″ in the NW-SE direction. This structure is similar to the one seen in H by González Delgado et al. (1995).
4.4.10 NGC 1672
The UV image of this galaxy is presented in the left panel of Figure 16. It shows a structure resembling a half ring, with several clusters of stars along it. The regions of stronger UV emission are coincident with those of strong H emission seen by Storchi-Bergmann, Wilson & Baldwin (1996).
4.4.11 NGC 5669
The UV image of this galaxy (Figure 16 right panel) shows enhanced emission along the bar (NE-SW), as well as some emission along the inner spiral arms, which are seen in the form of a ring, close to the borders of the image. We obtained VLA 8.46 GHz data for this galaxy, but could not detected any radio emission. Lower resolution (45″ beam), lower frequency (1.4 GHz) observations from the NVSS catalogue (Condon et al. 1998), detected this source. Nevertheless, higher resolution observations (4.5″ beam) at the same frequency, from the FIRST catalogue (Becker, White & Helfand 1995), did not detect it either. This suggests that the star formation in this galaxy is faint and widespread, resulting in radio emission below the detection threshold of our 8.46 GHz observations.
4.4.12 NGC 6753
The left panel of Figure 17 presents the H image of this galaxy, which is distributed throughout the disk and spiral arms. The latter can be seen as a ring structure extended along the NE-SW direction. Notice that the two bright sources to the south of the galaxy are residuals due to foreground stars, left over from the subtraction of the continuum.
4.4.13 NGC 6810
The H image of this galaxy (Figure 17 right panel) shows strong emission, extended for 1′ along the N-S direction, in a rectangular region. This emission is composed of several individual knots. Diffuse emission, extending over a region of 80″ in diameter, is seen along the SE-NW direction, possibly related to outflows. Another interesting structure that can be seen in this image is a half ring of small knots, to the E of the rectangular region described above. This ring extends along the major axis of the galaxy, has a diameter of 100″ in the N-S direction, and lies along the border of a dust lane. Observations by Hameed & Devereux (1999) found similar structures.
5 Discussion and Summary
In this paper we present the compilation of a database of multiwavelength data for a sample of 41 nearby star forming galaxies. We present the observations and reductions of UV images for 22 of these galaxies, H images for 23 galaxies, and radio 8.46 GHz images for 39 galaxies. We also obtained H data from the literature for another 14 galaxies which we could not observe, as well as complementary multifrequency radio, infrared and optical data for all the galaxies in the sample.
A preliminary comparison between the UV, H and radio images presented in this paper shows that, overall, on a larger scale, there is a good agreement in the spatial distribution of the different star formation indicators. Regions of intense star formation usually show up as strong regions of emission at all wavelengths. The relation between the different star formation indicators will be explored in more detail in an accompanying paper, but the current results already suggest that these 3 indicators trace each other, at least within the physical parameter space covered by our sample. However, an important effect that should be taken into account when dealing with shorter wavelength measurements (UV and H) is dust obscuration, which can easily absorb, or even hide entire regions of a galaxy. The most noticeable example of such effect is IC 1623, where the eastern component can be detected only in the radio, while the western one can be seen at both UV and radio. Similar results can also be seen in other galaxies.
Despite the good agreement between the different wavebands described above, a detailed inspection of individual sources shows that in some cases there are deviations from this pattern, which cannot be attributed to dust. One such example is NGC 6643, where the UV image is almost empty, while the H one shows several regions of emission throughout the disk of the galaxy, and the radio shows only two small regions of emission. The differences from the expected picture can be attributed in part to the fact that the star formation in this galaxy is mostly faint and diffuse, so the UV emission could have easily been absorbed by dust. In the case of the radio 8.46 GHz emission, the observations were not sensitive enough to detect the faint diffuse emission along the disk of the galaxy, but this emission was clearly detected by the large beam observations at lower frequencies. Two other galaxies which present an interesting behavior are NGC 1569 and NGC 4214. Based on a visual inspection of their UV images we can clearly see bright star clusters, which indicates that they are not strongly absorbed. Nevertheless, when these images are compared to the H and radio ones, we find that the emission in these wavebands is displaced relative to the clusters, suggesting that the region around them was evacuated by winds. Although not all galaxies show these effects, they can have a significant impact on the determination of star formation rates.
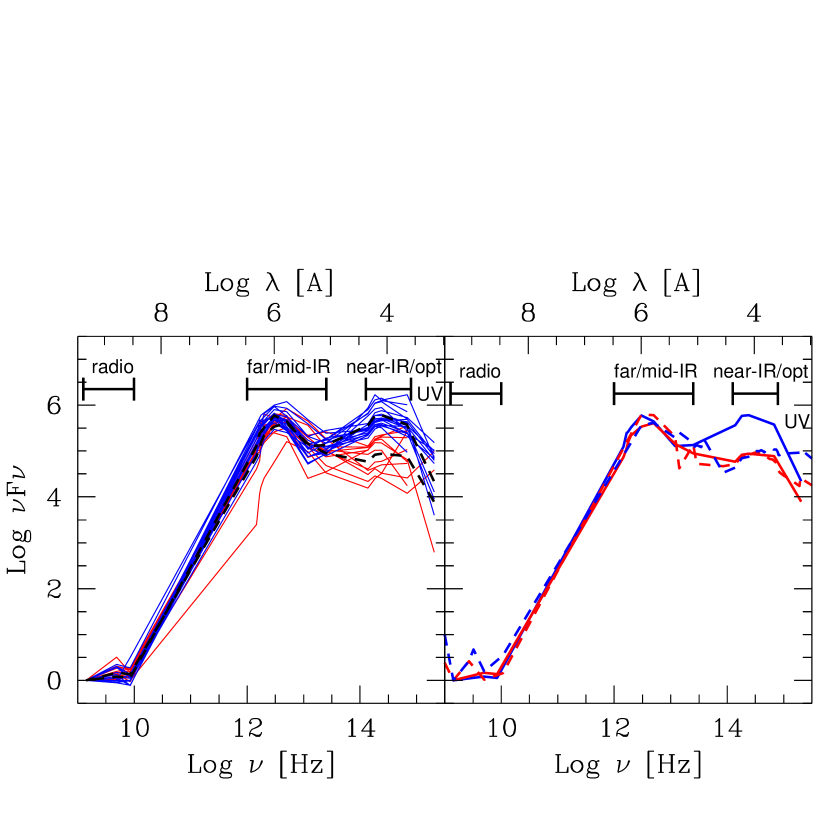
The broad wavelength range spanned by our data is better appreciated in the left panel of Figure 18, where the UV–to–radio SEDs of 29 of our sample galaxies are plotted with normalization of unity at 1.49 GHz (20 cm). In the case of galaxies for which 1.49 GHz was not available we extrapolated the flux from higher frequencies, assuming S. The 29 galaxies are those for which at least one ISO far–infrared data point beyond 100 m is available. In the case of NGC 4088 we exclude the measurement at 170m, which has calibration problems, and use only the one at 180m (Table 5). All data are integrated fluxes, except for the UV points, which were measured with a smaller field of view. We did not try to apply corrections to the UV data for aperture mismatch. In most cases, the mismatch between the UV values and the integrated values at longer wavelengths is at the level of a factor of 2 or less. This factor is inferred from the comparison of the H and 8.46 GHz fluxes measured inside an aperture matching the UV one, and their corresponding integrated values (Sections 3.2 and 3.3). Thus, the SEDs plotted in Figure 18 can be considered representative of each galaxy’s SED even in the UV.
This collection of normalized SEDs of normal star–forming galaxies readily shows a number of characteristics. (1) The range in far–infrared luminosity is fairly modest, once the SEDs are normalized to the radio,a factor of 5–6, clearly a reflection of the tight FIR–radio correlation found for galaxy populations (de Jong et al. 1985, Helou et al. 1985). (2) The range in FIR luminosity is much smaller than the factor 200 spanned by the UV and 100 spanned by the optical; the large UV and optical variation is likely a combination of variations in the stellar population content and the dust obscuration, with the latter contributing to the larger spread observed in the UV. (3) Relatively ‘blue’ SEDs at optical wavelengths (those for which ) do not necessarily correspond to blue galaxies in the UV as well; this likely reflects the stellar population content of the galaxy, where the ‘optically–bright’ populations are likely evolved stars, no longer UV–bright and contributing to the star formation.
The thicker dashed lines in the left panel of Figure 18 identify the two basic templates that can be recognized in our modest collection of SEDs (the average values are given in Table 7): (a) the FIR-dominated SED (REDSED), created averaging 11 galaxies, where the observed UV–optical emission is heavily affected by dust, and provides only a modest contribution to the galaxy energy budget; (b) the opticalFIR SED (BLUESED), created averaging 18 galaxies, where the evolved stellar populations are as important as the star-forming (FIR-emitting) population for the galaxy’s energy budget. Due to their large wavelength range, these two basic templates can be used to gain insights in the properties of intermediate and large redshift galaxies.
We also present, in the right panel of Figure 18, the comparison between the SEDs created in this paper with those of high and low reddening starbursts (SBH and SBL, respectively) from Schmitt et al. (1997). We can see that there is a good agreement between the two red SEDs, SBH and REDSED, over the entire frequency range. However, in the case of the blue ones, SBL and BLUESED, the agreement is good only in the radio–FIR range, with the BLUESED presenting higher fluxes in the optical-near infrared range, but smaller flux in the ultraviolet. These differences can be attributed to aperture effects. The SEDs created with the current database include the entire galaxy, with the exception of the ultraviolet flux. In the case of the Schmitt et al. (1997) SEDs the ultraviolet, optical and near-infrared measurements were obtained with apertures similar to that of IUE (), while the radio and infrared measurements included the entire galaxy. This aperture difference is not a significant problem for the infrared dominated SEDs, since they usually are dominated by a reddened nuclear starburst. Nevertheless, in the case of larger galaxies, without a nuclear starburst, older stars make a significant contribution to the integrated light of the galaxy, resulting in the similar optical–to–FIR peak ratio observed in the BLUESED, and in larger optical–to–UV ratios than observed in the low reddening starburst SED of Schmitt et al. (1997).
References
- (1) Aaronson, M. 1977, PhD Thesis, Harvard University
- (2) Adelberger, K. L., & Steidel, C. C. 2000, ApJ, 544, 218
- (3) Armus, L., Heckman, T. M., & Miley, G. K. 1990, ApJ, 364, 471
- (4) Balzano, V. A. 1983, ApJ, 268, 602
- (5) Balzano, V. A., & Weedman, D. W. 1981, ApJ, 243, 756
- (6) Barger, A. J., Cowie, L. L., Smail, I., Ivison, R. J., Blain, A. W., & Kneib, J.-P. 1999, Nature, 394, 248
- (7) Barger, A. J., Cowie, L. L., & Richards, E. A. 2000, AJ, 119, 2092
- (8) Baugh, C. M., Cole, S., Frenk, C. S., & Lacey, C. G. 1998, ApJ, 498, 504
- (9) Becker, R. H., White, R. L., & Edwards, A. L. 1991, ApJS, 75, 1
- (10) Becker, R. H., White, R. L., & Helfand, D. J. 1995, ApJ, 450, 559
- (11) Bendo, G. J., et al. 2002, AJ, 123, 3067
- (12) Bicay, M. D., Kojoian, G., Seal, J., Dickinson, D. F., & Malkan, M. A. 1995, ApJS, 98, 369
- (13) Blain, A. W., Kneib, J.-P., Ivison, R. J., & Smail, I. 1999, ApJ, 512, L87
- (14) Burstein, D., & Heiles, C. 1982, AJ, 87, 1165
- (15) Bushouse, H. A. 1986, AJ, 91, 225
- (16) Calzetti, D. 1997, AJ, 113, 162
- (17) Calzetti, D., Armus, L., Bohlin, R. C., Kinney, A. L., Koorneef, J., & Storchi-Bergmann, T. 2000, ApJ, 533, 682
- (18) Cecil, G., Bland-Hawthorn, J., Veilleux, S., & Filippenko, A. V. 2001, ApJ, 555, 338
- (19) Chapman, S. C., Blain, A. W., Ivison, R. J., & Smail, I. R. 2003, Nature, 422, 695
- (20) Condon, J. J. 1987, ApJS, 65, 485
- (21) Condon, J. J., Anderson, E., & Broderick, J. J. 1995, AJ, 109, 2318
- (22) Condon, J. J., Cotton, W. D., Greisen, E. W., Yin, Q. F., Perley, R. A., Taylor, G. B., & Broderick, J. J. 1998, AJ, 115, 1639
- (23) Condon, J. J., & Yin, Q. F. 1990, ApJ, 357, 97
- (24) Corbett, E. A., et al. 2003, ApJ, 583, 670
- (25) de Jong, T., Klein, U., Wielebinski, R., & Wunderlich, E. 1985, A&A, 147, L6
- (26) de Vaucouleurs, G., de Vaucouleurs, A., Corwin, H. G., Buta, R. J., Paturel, G., & Fouque, P. 1991, Third Reference Catalogue of Bright Galaxies, Springer-Verlag Berlin Heidelberg New York
- (27) de Vaucouleurs, G., de Vaucouleurs, A., & Pence, W. 1974, ApJ, 194, L119
- (28) Dottori, H., Cepa, J., Vilchez, J., & Barth, C. S. 1994, A&A, 283, 753
- (29) Duric, N., Seaquist, E. R., Crane, P. C., Bignell, R. C., & Davis, L. E. 1983, ApJ, 273, L11
- (30) Fairall, A. P. 1988, MNRAS, 233, 691
- (31) Goldader, J. D., Meurer, G., Heckman, T. M., Seibert, M., Sanders, D. B., Calzetti, D., & Steidel, C. C. 2002, ApJ, 568, 651
- (32) González Delgado, R. M., Pérez, E., Díaz, A. I., Garcia-Vargas, M. L., Terlevich, E., & Vilchez, J. M. 1995, ApJ, 439, 604
- (33) Gregory, P. C., & Condon, J. J. 1991, ApJS, 75, 1011
- (34) Griffith, M. R., Wright, A. E., Burke, B. F., & Ekers, R. D. 1994, ApJS, 90, 179
- (35) Griffith, M. R., Wright, A. E., Burke, B. F., & Ekers, R. D. 1995, ApJS, 97, 347
- (36) Hameed, S., & Devereux, N. 1999, AJ, 118, 730
- (37) Helou, G., Soifer, B.T., & Rowan-Robinson, M. 1985, ApJ, 298, L7
- (38) Ho, L. C., Filippenko, A. V., & Sargent, W. L. W. 1997, ApJS, 112, 315
- (39) Hodge, P. 1974, ApJ, 191, L21
- (40) Homeier, N. L., & Gallagher, J. S. 1999, ApJ, 522, 199
- (41) Israel, F. P. 1988, A&A, 194, 24
- (42) Jarrett, T. H., Chester, T., Cutri, R., Schneider, S. E, & Huchra, J. P. 2003, AJ, 125, 525
- (43) Kennicutt, R. C., Jr., & Kent, S. M. 1983, AJ, 88, 1094
- (44) Kewley, L. J., Heisler, C. A., Dopita, M. A., & Lumsden, S. 2001, ApJS, 132, 37
- (45) Kewley, L. J., Heisler, C. A., Dopita, M. A., Sutherland, R., Norris, R. P., Reynolds, J., & Lumsden, S. 2000, ApJ, 530, 704
- (46) Kinney, A. L., Bohlin, R. C., Calzetti, D., Panagia, N., & Wyse, R. F. G. 1993, ApJS, 86, 5
- (47) Klein, U., Wielebinski, R., & Thuan, T. X. 1984, A&A, 141, 241
- (48) Knop, R. A., Soifer, B. T., Graham, J. R., Matthews, K., Sanders, D. B., & Scoville, N. Z. 1994, AJ, 107, 920
- (49) Krugel, E., Siebenmorgen, R., Zota, V., & Chini, R. 1998, A&A, 331, L9
- (50) Kunth, D., Leitherer, C., Mas-Hesse, J. M., Östlin, G., & Petrosian, A. 2003, ApJ, 597, 263
- (51) Landolt, A. U. 1992, AJ, 104, 340
- (52) Madau, P., Pozzetti, L., & Dickinson, M. 1998, ApJ, 498, 106
- (53) McQuade, K., Calzetti, D., & Kinney, A. L. 1995, ApJS, 97, 331
- (54) Meurer, G. R., Heckman, T. M., & Calzetti, D. 1999, ApJ, 521, 64
- (55) Meurer, G. R., Heckman, T. M., Lehnert, M. D., Leitherer, C., & Lowenthal, J. 1997, Aj, 114, 54
- (56) Oke, J. B. 1990, AJ, 99, 1621
- (57) Ortolani, S., Renzini, A., Gilmozzi, R., Marconi, G., Barbuy, B., Bica, E., & Rich, M. R. 1995, Nature, 377, 701
- (58) Östlin, G., Bergvall, N. & Rönnback, J. 1998, A&A, 335, 85
- (59) Perez Garcia, A. M., Rodriguez Espinosa, J. M., & Santolaya Rey, A. E. 1998, ApJ, 500, 685
- (60) Pettini, M., Kellogg, M., Steidel, C. C., Dickinson, M., Adelberger, K. L., & Giavalisco, M. 1998, ApJ, 508, 539
- (61) Pettini, M., Steidel, C. C., Adelberger, K. L., Dickinson, M., & Giavalisco, M. 1999, ApJ, 510, 576
- (62) Saikia, D. J., Pedlar, A., Unger, S. W., & Axon, D. J. 1994, MNRAS, 270, 46
- (63) Schlegel, D. J. Finkbeiner, D. P., & Davis, M. 1998, ApJ, 500, 525
- (64) Schmitt, H. R., Kinney, A. L., Calzetti, D., & Storchi-Bergmann, T. 1997, AJ, 114, 592
- (65) Sheth, K., Regan, M. W., Vogel, S. N., & Teuben, P. J. 2000, ApJ, 532, 221
- (66) Siebenmorgen, R., Krugel, E., & Chini, R. 1999, A&A, 351, 495
- (67) Smail, I., Ivison, R. J., Owen, F. N., Blain, A. W., & Kneib, J.-P. 1999, ApJ, 528, 612
- (68) Spinoglio, L., Andreani, P., & Malkan, M. A. 2002, ApJ, 572, 105
- (69) Spinoglio, L., Malkan, M. A, Rush, B., Carrasco, L., & Recillas-Cruz, E. 1995, ApJ, 453, 616
- (70) Steidel, C. C., Adelberger, K. L., Giavalisco, M., Dickinson, M., & Pettini, M. 1999, ApJ, 519, 1
- (71) Steidel, C. C., Giavalisco, M., Pettini, M., Dickinson, M., & Adelberger, K. L. 1996, ApJ, 462, L17
- (72) Stickel, M., et al. 2000, A&A, 359, 865
- (73) Stone, R. P. S., & Baldwin, J. A. 1983, MNRAS, 204, 347
- (74) Storchi-Bergmann, T, Calzetti, D., & Kinney, A. L. 1994, ApJ, 429, 572
- (75) Storchi-Bergmann, T., Kinney, A. L., & Challis, P. 1995, ApJS, 98, 103
- (76) Storchi-Bergmann, T., Wilson, A. S., & Baldwin, J. A. 1996, ApJ, 460, 252
- (77) Terlevich, R., Melnick, J., Masegosa, J., Moles, M., & Copetti, M. V. F. 1991, A&AS, 91, 285
- (78) Tully, R. B. 1988, Nearby Galaxies Catalog (Cambridge: Cambridge Univ. Press)
- (79) Vacca, W. D., & Conti, P. S. 1992, ApJ, 401, 543
- (80) van der Hulst, J. M., Crane, P. C., & Keel, W. C. 1981, AJ, 86, 1175
- (81) Veilleux, S., Kim, D.-C., Sanders, D. B., Mazzarella, J. M., & Soifer, B. T. 1995, ApJS, 98, 171
- (82) Veron-Cetty, M. P., & Veron, P. 1986, A&AS, 66, 335
- (83) Wright, A. E., Griffith, M. R., Burke, B. F., & Ekers, R. D. 1994, ApJS, 91, 111
- (84) Wu, W., Clayton, G. C., Gordon, K. D., Misselt, K. A., Smith, T. L., & Calzetti, D. 2002, ApJS, 143, 377
| Name | (J2000.0) | (J2000.0) | Vel. | Dist. | ab | E(B-V) | Morph. |
|---|---|---|---|---|---|---|---|
| (km s-1) | (Mpc) | (′) | |||||
| (1) | (2) | (3) | (4) | (5) | (6) | (7) | (8) |
| ESO 350-G 38 | 0 36 52.5 | -33 33 19 | 6132 | 81.8 | 0.50.3 | 0.01 | Merger |
| NGC 232 | 0 42 45.8 | -23 33 41 | 6682 | 89.1 | 1.00.8 | 0.01 | SB(r)a pec |
| MRK 555 | 0 46 05.6 | -01 43 25 | 4156 | 55.4 | 1.41.2 | 0.02 | SA(rs)b pec |
| IC 1586 | 0 47 56.1 | 22 22 21 | 5963 | 79.5 | 0.30.3 | 0.02 | BCG |
| NGC 337 | 0 59 50.3 | -07 34 44 | 1702 | 20.7 | 2.91.8 | 0.08 | SB(s)d |
| IC 1623 | 1 07 47.2 | -17 30 25 | 6016 | 80.2 | 0.70.4 | 0.01 | Merger |
| NGC 1155 | 2 58 13.0 | -10 21 04 | 4549 | 60.7 | 0.80.7 | 0.04 | Compact |
| UGC 2982 | 4 12 22.6 | 05 32 51 | 5273 | 70.3 | 0.90.4 | 0.14 | Sm |
| NGC 1569 | 4 30 49.3 | 64 50 54 | 40 | 1.6 | 3.61.8 | 0.51 | IBm |
| NGC 1614 | 4 34 00.0 | -08 34 45 | 4681 | 62.4 | 1.31.1 | 0.06 | SB(s)c pec |
| NGC 1667 | 4 48 37.1 | -06 19 13 | 4459 | 59.5 | 1.81.4 | 0.06 | SAB(r)c |
| NGC 1672 | 4 45 42.1 | -59 14 57 | 1155 | 14.5 | 6.65.5 | 0.00 | SB(r)bc |
| NGC 1741 | 5 01 37.9 | -04 15 35 | 3956 | 52.8 | 1.51.0 | 0.06 | Merger |
| NGC 3079 | 10 01 57.8 | 55 40 49 | 1182 | 20.4 | 7.91.4 | 0.00 | SB(s)c |
| NGC 3690 | 11 28 32.6 | 58 33 47 | 3121 | 41.6 | 3.03.0 | 0.00 | Merger |
| NGC 4088 | 12 05 35.6 | 50 32 32 | 825 | 17.0 | 5.82.2 | 0.00 | SAB(rs)bc |
| NGC 4100 | 12 06 08.7 | 49 34 56 | 1138 | 17.0 | 5.41.8 | 0.01 | (R’)SA(rs)bc |
| NGC 4214 | 12 15 40.0 | 36 19 27 | 313 | 3.5 | 8.56.6 | 0.00 | IAB(s)m |
| NGC 4861 | 12 59 00.3 | 34 50 48 | 880 | 17.8 | 4.01.5 | 0.01 | SB(s)m: |
| NGC 5054 | 13 16 58.4 | -16 38 03 | 1630 | 27.3 | 5.13.0 | 0.03 | SA(s)bc |
| NGC 5161 | 13 29 14.4 | -33 10 29 | 2247 | 33.5 | 5.62.2 | 0.04 | SA(s)c: |
| NGC 5383 | 13 57 05.0 | 41 50 44 | 2333 | 37.8 | 3.22.7 | 0.00 | (R’)SB(rs)b:pec |
| MRK 799 | 14 00 45.8 | 59 19 44 | 3157 | 42.1 | 2.21.1 | 0.00 | SB(s)b |
| NGC 5669 | 14 32 44.1 | 09 53 24 | 1387 | 24.9 | 4.02.8 | 0.01 | SAB(rs)cd |
| NGC 5676 | 14 32 46.8 | 49 27 30 | 2237 | 34.5 | 4.01.9 | 0.01 | SA(rs)bc |
| NGC 5713 | 14 40 11.3 | -00 17 26 | 1872 | 30.4 | 2.82.5 | 0.03 | SAB(rs)bc pec |
| NGC 5860 | 15 06 33.4 | 42 38 29 | 5520 | 73.6 | 1.01.0 | 0.01 | Peculiar |
| NGC 6090 | 16 11 40.8 | 52 27 27 | 8953 | 119.4 | 1.01.0 | 0.00 | Peculiar |
| NGC 6217 | 16 32 39.3 | 78 11 53 | 1544 | 23.9 | 3.02.5 | 0.04 | (R)SB(rs)bc |
| NGC 6643 | 18 19 46.0 | 74 34 09 | 1686 | 25.5 | 3.81.9 | 0.06 | SA(rs)c |
| UGC 11284 | 18 33 35.5 | 59 53 20 | 8650 | 115.3 | 2.02.0 | 0.05 | Merger |
| NGC 6753 | 19 11 23.4 | -57 02 56 | 3073 | 41.0 | 2.52.1 | 0.06 | (R’)SA(r)b |
| TOL 1924-416 | 19 27 58.0 | -41 34 28 | 2863 | 38.2 | 0.80.4 | 0.08 | Peculiar |
| NGC 6810 | 19 43 34.2 | -58 39 21 | 1888 | 25.3 | 3.20.9 | 0.04 | SA(s)ab:sp |
| ESO 400-G 43 | 20 37 41.8 | -35 29 04 | 6032 | 80.4 | 0.50.4 | 0.02 | Compact |
| NGC 7496 | 23 09 47.0 | -43 25 40 | 1623 | 20.1 | 3.33.0 | 0.01 | (R’)SB(rs)bc |
| NGC 7552 | 23 16 11.0 | -42 34 59 | 1568 | 19.5 | 3.42.7 | 0.01 | (R’)SB(s)ab |
| MRK 323 | 23 20 22.7 | 27 18 56 | 4404 | 58.7 | 1.00.7 | 0.05 | SBc |
| NGC 7673 | 23 27 41.3 | 23 35 23 | 3581 | 47.8 | 1.31.2 | 0.04 | (R’)SAc pec. |
| NGC 7714 | 23 36 14.1 | 02 09 18 | 2925 | 39.0 | 1.91.4 | 0.04 | SB(s)b:pec |
| MRK 332 | 23 59 25.6 | 20 45 00 | 2568 | 34.2 | 1.41.3 | 0.04 | SBc |
| Ultraviolet | H | Radio | ||||||||
|---|---|---|---|---|---|---|---|---|---|---|
| Name | Dataset | Exp. | Observatory | Exp. | Filter | Config. | Exp. | Prop. | ||
| (1) | (2) | (3) | (4) | (5) | (6) | (7) | (8) | (9) | ||
| ESO 350-G 38 | CTIO | 3600 | 6680/100 | BnA | 5840 | AJ 176 | ||||
| BnA | 3750d | AJ 176 | ||||||||
| NGC 232 | CTIO | 3600 | 6680/100 | CnB | 1670 | AS 713 | ||||
| MRK 555 | O63X04WWQ | 1320 | WIYN-2 | 720 | KP 1494 | C | 1700 | AS 713 | ||
| IC 1586 | C | 1650 | AS 713 | |||||||
| NGC 337 | CTIO | 3600 | 6600/75 | C | 1680 | AS 713 | ||||
| IC 1623 | O5CU02010a | 3051 | CnB | 1680 | AS 713 | |||||
| NGC 1155 | CnB | 1690 | AS 713 | |||||||
| UGC 2982 | C | 1650 | AS 713 | |||||||
| NGC 1569 | O63X09HYQ | 1320 | HSTb | 1600 | F 656N | B | 3910 | AA 116 | ||
| NGC 1614 | C | 1710 | AS 713 | |||||||
| C | 1020 | AK 331 | ||||||||
| NGC 1667 | O63X36ITQ | 1320 | WIYN-2 | 720 | KP 1494 | C | 1670 | AS 713 | ||
| NGC 1672 | O63X11R0Q | 1320 | ||||||||
| NGC 1741 | O63X38FIQ | 1320 | WIYN-2 | 480 | KP 1494 | C | 990 | AK 331 | ||
| B | 1770d | AM 290 | ||||||||
| NGC 3079 | O63X35ZXQ | 1320 | CnB | 3050 | TT 1 | |||||
| NGC 3690 | C | 3740 | AS 568 | |||||||
| NGC 4088 | O63X12FMQ | 1320 | WIYN-1 | 480 | W 015 | C | 5380 | AL 383 | ||
| NGC 4100 | C | 1680 | AS 713 | |||||||
| NGC 4214 | O63X39ESQ | 1320 | HSTc | 1600 | F 656N | C | 590 | AS 713 | ||
| NGC 4861 | O63X40H7Q | 1320 | C | 1670 | AS 713 | |||||
| NGC 5054 | C | 1700 | AS 713 | |||||||
| NGC 5161 | CTIO | 3600 | 6600/75 | C | 1690 | AS 713 | ||||
| NGC 5383 | O63X16UKQ | 1320 | C | 1710 | AS 713 | |||||
| MRK 799 | O63X17DRQ | 1320 | WIYN-1 | 720 | W 016 | C | 560 | AS 713 | ||
| NGC 5669 | O63X18AVQ | 1320 | C | 1700 | AS 713 | |||||
| NGC 5676 | O63X19LSQ | 1320 | C | 1680 | AS 713 | |||||
| NGC 5713 | O63X20FBQ | 1320 | C | 1690 | AS 713 | |||||
| NGC 5860 | O63X21OUQ | 1320 | WIYN-1 | 720 | KP 1495 | C | 1690 | AS 713 | ||
| NGC 6090 | WIYN-1 | 720 | KP 1496 | CnB | 1650 | AS 713 | ||||
| NGC 6217 | O63X23BUQ | 1320 | APO | 1200 | 6590/25 | CnB | 1660 | AS 713 | ||
| NGC 6643 | O63X24IAQ | 1320 | APO | 1200 | 6590/25 | CnB | 1680 | AS 713 | ||
| UGC 11284 | O63X25Y6Q | 1320 | CnB | 1680 | AS 713 | |||||
| NGC 6753 | CTIO | 4500 | 6600/75 | |||||||
| TOL 1924-416 | CTIO | 3600 | 6600/75 | CnB | 1690 | AS 713 | ||||
| NGC 6810 | CTIO | 3600 | 6600/75 | |||||||
| ESO 400-G 43 | O63X29FKQ | 1320 | CTIO | 3600 | 6680/100 | CnB | 570 | AS 713 | ||
| BnA | 3160d | AJ 176 | ||||||||
| NGC 7496 | CTIO | 3600 | 6600/75 | CnB | 1640 | AS 713 | ||||
| NGC 7552 | CTIO | 3600 | 6600/75 | CnB | 1650 | AS 713 | ||||
| A | 1590e | AS 721 | ||||||||
| MRK 323 | O63X31GSQ | 1320 | WIYN-2 | 960 | KP 1494 | C | 1680 | AS 713 | ||
| NGC 7673 | C | 1670 | AS 713 | |||||||
| NGC 7714 | C | 1680 | AS 713 | |||||||
| MRK 332 | O63X34AHQ | 1320 | WIYN-2 | 720 | W 016 | C | 1670 | AS 713 | ||
| Name | F(1457Å) | 3 | F(H)int | F(H) | F(H)match | F(H) | 3 | [NII]/H | Area | Ref. |
|---|---|---|---|---|---|---|---|---|---|---|
| (1) | (2) | (3) | (4) | (5) | (6) | (7) | (8) | (9) | (10) | (11) |
| ESO 350-G 38 | 33.263.33 | 27.112.71 | 7.1 | 0.17 | 1.5 | f | ||||
| NGC 232 | 4.080.41 | 2.080.21 | 4.7 | 0.72 | 9.2 | j | ||||
| MRK 555 | 1.43 | 2.8 | 9.060.91 | 6.660.67 | 3.720.37 | 2.730.27 | 5.1 | 0.27 | k | |
| IC 1586 | 2.290.22 | 2.290.22 | 0.21 | 143.1 | a | |||||
| NGC 337 | 32.093.21 | 24.322.43 | 12.0 | 0.24 | 16.0 | l | ||||
| IC 1623 | 6.58 | 1.6 | 0.30 | 5.2 | m | |||||
| NGC 1569 | 1.73 | 7.2 | 151.8515.20 | 151.0915.10 | 136.0013.60 | 135.3013.50 | 50.0 | 0.04 | 8.0 | h |
| NGC 1614 | 10.691.07 | 10.691.07 | 0.44 | 143.1 | a | |||||
| NGC 1667 | 1.07 | 1.7 | 9.180.92 | 5.140.51 | 4.580.46 | 2.470.25 | 9.7 | 0.69 | 200.0 | b |
| NGC 1672 | 3.89 | 2.5 | 17.701.77 | 17.701.77 | 17.701.77 | 17.701.77 | 0.46 | 200.0 | b | |
| NGC 1741 | 3.95 | 3.7 | 12.171.22 | 10.731.07 | 10.201.02 | 9.000.90 | 8.0 | 0.10 | i | |
| NGC 3079 | 0.46 | 19.3 | 1.59 | 8.0 | h | |||||
| NGC 3690 | 89.138.90 | 89.138.90 | 0.40 | 8.0 | c,h | |||||
| NGC 4088 | 0.67 | 13.5 | 62.146.21 | 47.854.79 | 4.360.44 | 3.360.34 | 2.2 | 0.32 | 8.0 | h |
| NGC 4214 | 18.36 | 5.7 | 83.168.32 | 81.668.17 | 76.807.68 | 75.027.50 | 4.0 | 0.07 | 8.0 | h |
| NGC 4861 | 13.07 | 2.4 | 19.751.98 | 19.751.98 | 19.751.98 | 19.751.98 | 0.09 | 143.1 | a | |
| NGC 5161 | 9.210.92 | 7.090.71 | 17.3 | 0.36 | 19.6 | l | ||||
| NGC 5383 | 1.08 | 1.6 | 43.703.60 | 43.703.60 | 24.200.90 | 24.200.90 | 0.36 | 8.0 | d,h | |
| MRK 799 | 0.57 | 7.9 | 12.801.28 | 8.440.84 | 4.280.43 | 2.820.28 | 4.0 | 0.50 | 19.6 | j |
| NGC 5669 | 1.09 | 13.4 | 0.28 | 8.0 | h | |||||
| NGC 5676 | 0.37 | 8.9 | 23.562.30 | 23.562.30 | 0.45 | 8.0 | e,h | |||
| NGC 5713 | 1.53 | 28.2 | 0.47 | 16.6 | n | |||||
| NGC 5860 | 1.01 | 26.9 | 3.020.30 | 1.830.18 | 3.020.30 | 1.830.18 | 2.1 | 0.49 | 143.1 | a |
| NGC 6090 | 8.670.87 | 6.290.63 | 3.3 | 0.45 | 143.1 | a | ||||
| NGC 6217 | 1.86 | 3.0 | 20.452.05 | 18.471.85 | 7.990.80 | 7.210.72 | 2.5 | 0.64 | 143.1 | a |
| NGC 6643 | 0.80 | 47.4 | 29.582.96 | 28.072.81 | 4.370.44 | 4.150.42 | 6.4 | 0.32 | 8.0 | h |
| UGC 11284 | 1.07 | 44.3 | 0.38 | 7.2 | j | |||||
| NGC 6753 | 22.602.26 | 22.602.26 | ||||||||
| TOL 1924-416 | 19.051.91 | 18.821.88 | 6.5 | 0.02 | 200.0 | b | ||||
| NGC 6810 | 18.361.84 | 11.861.19 | 5.9 | 0.53 | 8.0 | l | ||||
| ESO 400-G 43 | 3.57 | 43.0 | 14.251.43 | 13.351.34 | 14.101.41 | 13.211.30 | 11.2 | 0.05 | g | |
| NGC 7496 | 33.003.30 | 20.722.07 | 17.5 | 0.48 | 200.0 | b | ||||
| NGC 7552 | 71.007.10 | 41.614.16 | 15.6 | 0.57 | 200.0 | b | ||||
| MRK 323 | 0.79 | 34.3 | 2.880.29 | 2.880.29 | 2.130.21 | 2.130.21 | 6.6 | |||
| NGC 7673 | 6.080.60 | 6.080.60 | 0.23 | 143.1 | a | |||||
| NGC 7714 | 27.962.80 | 27.962.80 | 0.36 | 143.1 | a | |||||
| MRK 332 | 1.37 | 5.2 | 13.581.36 | 7.330.73 | 9.220.92 | 4.980.50 | 4.4 | 0.64 | 8.0 | h |
| Name | S(1.49 GHz) | S(4.89 GHz) | S(8.46 GHz)int | S(8.46 GHz)match | 3 | Beam | Ref. |
|---|---|---|---|---|---|---|---|
| (mJy) | (mJy) | (mJy) | (mJy) | (Jy) | (arcsec) | ||
| (1) | (2) | (3) | (4) | (5) | (6) | (7) | (8) |
| ESO 350-G 38 | 27.20.9 | 15.10.5 | 10.10.2 | 61 | 1.370.65 | a | |
| NGC 232 | 60.61.9 | 5611 | 14.90.3 | 70 | 3.692.45 | h | |
| MRK 555 | 39.61.9 | 104 | 5.20.2 | 3.10.1 | 61 | 4.092.96 | b |
| IC 1586 | 8.30.5 | 1.70.1 | 83 | 4.112.86 | |||
| NGC 337 | 109.64.1 | 4411 | 9.10.3 | 56 | 5.082.99 | i | |
| IC 1623 | 249.29.8 | 9612 | 49.60.8 | 49.00.8 | 93 | 3.342.24 | h |
| NGC 1155 | 9.10.6 | 2.10.1 | 83 | 3.142.19 | |||
| UGC 2982 | 92.43.7 | 281 | 18.20.4 | 62 | 3.572.69 | c | |
| NGC 1569 | 338.611.0 | 20219 | 23.20.5 | 17.00.4 | 64 | 1.060.84 | j |
| NGC 1614 | 138.24.9 | 6311 | 41.10.6 | 71 | 3.722.58 | i | |
| NGC 1667 | 77.33.0 | 4511 | 17.70.4 | 7.50.2 | 92 | 4.232.78 | i |
| NGC 1672 | 450.045.0 | 1149 | k | ||||
| NGC 1741 | 31.71.6 | 6.90.6 | 5.80.2 | 5.00.2 | 105 | 3.502.58 | a |
| NGC 3079 | 770.727.1 | 32134 | 120.21.9 | 109.91.7 | 107 | 1.920.99 | l |
| NGC 3690 | 678.125.4 | 3004 | 226.03.4 | 79 | 3.342.58 | c | |
| NGC 4088 | 174.15.9 | 679 | 22.20.5 | 3.90.1 | 80 | 3.002.71 | j |
| NGC 4100 | 50.32.2 | 26.20.5 | 105 | 3.992.94 | |||
| NGC 4214 | 34.81.5 | 307 | 20.50.5 | 9.70.2 | 112 | 3.753.05 | k |
| NGC 4861 | 14.40.9 | 8.30.4 | 6.30.3 | 6.30.3 | 79 | 4.193.17 | d |
| NGC 5054 | 89.73.4 | 4911 | 17.30.4 | 67 | 5.332.63 | h | |
| NGC 5161 | 11.32.5 | 1.10.2 | 60 | 8.382.62 | |||
| NGC 5383 | 30.71.6 | 115 | 5.90.2 | 5.40.2 | 88 | 4.423.02 | b |
| MRK 799 | 67.02.7 | 296 | 14.30.4 | 9.10.2 | 96 | 4.252.76 | j |
| NGC 5669 | 19.02.7 | 90 | 4.682.95 | ||||
| NGC 5676 | 118.84.2 | 386 | 15.40.5 | 4.60.2 | 76 | 4.162.90 | j |
| NGC 5713 | 159.95.7 | 9314 | 30.60.6 | 19.20.4 | 81 | 3.922.69 | l |
| NGC 5860 | 7.70.5 | 1.90.3 | 1.90.3 | 115 | 3.192.75 | ||
| NGC 6090 | 48.41.5 | 20.31.6 | 12.90.3 | 75 | 2.801.58 | e | |
| NGC 6217 | 80.83.1 | 211 | 13.20.2 | 13.10.2 | 81 | 3.262.13 | f |
| NGC 6643 | 97.83.6 | 345 | 1.80.1 | 0.40.1 | 75 | 2.982.21 | j |
| UGC 11284 | 60.82.5 | 13.00.3 | 5.50.1 | 70 | 2.662.50 | ||
| NGC 6753 | 358 | k | |||||
| TOL 1924-416 | 6.20.2 | 86 | 4.902.56 | ||||
| NGC 6810 | 728 | k | |||||
| ESO 400-G 43 | 18.11.0 | 5.30.5 | 4.30.2 | 4.10.2 | 150 | 5.362.03 | a |
| NGC 7496 | 35.01.8 | 7.90.2 | 87 | 5.482.57 | |||
| NGC 7552 | 216.88.4 | 13911 | 66.91.1 | 90 | 5.042.58 | k | |
| MRK 323 | 25.71.4 | 4.30.2 | 3.30.2 | 80 | 2.942.76 | ||
| NGC 7673 | 32.01.9 | 172 | 10.00.2 | 67 | 2.992.87 | g | |
| NGC 7714 | 66.92.7 | 399 | 19.10.4 | 102 | 4.302.87 | j | |
| MRK 332 | 37.51.7 | 6.00.3 | 4.00.2 | 105 | 3.032.89 |
| Name | 12m | 25m | 60m | 100m | 150m | 170m | 180m | 205m | Ref. |
|---|---|---|---|---|---|---|---|---|---|
| (Jy) | (Jy) | (Jy) | (Jy) | (Jy) | (Jy) | (Jy) | (Jy) | ||
| (1) | (2) | (3) | (4) | (5) | (6) | (7) | (8) | (9) | (10) |
| ESO 350-G 38 | 0.42 | 2.49 | 6.48 | 5.01 | |||||
| NGC 232 | 0.33 | 1.08 | 10.04 | 18.34 | 18.95.2 | 15.73.9 | 9.11.5 | 5.40.1 | a |
| MRK 555 | 0.28 | 0.56 | 4.22 | 8.68 | 5.31.6 | b | |||
| IC 1586 | 0.12 | 0.21 | 0.96 | 1.69 | 2.10.5 | 0.80.4 | c | ||
| NGC 337 | 0.22 | 0.65 | 8.35 | 17.11 | |||||
| IC 1623 | 0.68 | 3.57 | 22.58 | 30.37 | 26.70.3 | 23.50.4 | 12.80.1 | 9.70.1 | a |
| NGC 1155 | 0.17 | 0.36 | 2.45 | 4.60 | |||||
| UGC 2982 | 0.55 | 0.78 | 8.35 | 16.89 | 12.53.8 | 9.82.9 | 9.93.0 | 9.22.8 | b |
| NGC 1569 | 0.79 | 7.09 | 45.41 | 47.29 | |||||
| NGC 1614 | 1.44 | 7.29 | 32.31 | 32.69 | 17.10.7 | d | |||
| NGC 1667 | 0.43 | 0.68 | 5.95 | 14.73 | 16.30.5 | 17.02.8 | 9.00.2 | 6.30.2 | a |
| NGC 1672 | 1.67 | 4.03 | 32.96 | 69.89 | |||||
| NGC 1741 | 0.11 | 0.58 | 3.92 | 5.84 | |||||
| NGC 3079 | 1.52 | 2.27 | 44.50 | 89.22 | 125.718.9 | 136.920.6 | 134.420.3 | e | |
| NGC 3690 | 3.81 | 23.19 | 103.70 | 107.40 | |||||
| NGC 4088 | 0.88 | 1.55 | 19.88 | 54.47 | 144.82.5 | 46.29.2 | d,f | ||
| NGC 4100 | 0.50 | 0.82 | 8.10 | 21.72 | 18.63.7 | f | |||
| NGC 4214 | 0.61 | 2.36 | 17.87 | 29.04 | |||||
| NGC 4861 | 0.13 | 0.39 | 1.97 | 2.46 | |||||
| NGC 5054 | 0.76 | 1.15 | 11.60 | 26.21 | 26.75.3 | f | |||
| NGC 5161 | 0.18 | 0.25 | 2.18 | 7.24 | |||||
| NGC 5383 | 0.35 | 0.69 | 4.89 | 13.70 | |||||
| MRK 799 | 0.56 | 1.63 | 10.41 | 19.47 | 12.93.9 | 11.43.4 | 9.32.8 | b | |
| NGC 5669 | 0.09 | 0.12 | 1.66 | 5.19 | 6.81.4 | f | |||
| NGC 5676 | 0.71 | 1.03 | 9.64 | 30.66 | 25.85.2 | f | |||
| NGC 5713 | 1.10 | 2.58 | 19.82 | 36.20 | 22.34.5 | f | |||
| NGC 5860 | 0.13 | 0.20 | 1.64 | 3.02 | 2.60.7 | 0.70.3 | c | ||
| NGC 6090 | 0.26 | 1.11 | 6.66 | 8.94 | 8.72.2 | 4.51.1 | c | ||
| NGC 6217 | 0.51 | 1.61 | 10.83 | 19.33 | 26.20.6 | 16.13.2 | d,f | ||
| NGC 6643 | 0.81 | 1.04 | 9.38 | 30.69 | 24.74.9 | f | |||
| UGC 11284 | 0.36 | 1.03 | 8.25 | 15.18 | 27.00.2 | 14.50.2 | 13.50.3 | a | |
| NGC 6753 | 0.60 | 0.73 | 9.43 | 27.36 | 19.03.8 | f | |||
| TOL 1924-416 | 0.07 | 0.42 | 1.69 | 1.01 | 0.70.2 | 0.10.1 | c | ||
| NGC 6810 | 1.10 | 3.49 | 17.79 | 34.50 | 29.80.1 | 16.90.2 | 14.00.2 | a | |
| ESO 400-G 43 | 0.10 | 0.21 | 1.59 | 1.58 | |||||
| NGC 7496 | 0.35 | 1.60 | 8.46 | 15.55 | 16.20.2 | 13.90.5 | 8.90.1 | 6.30.1 | a |
| NGC 7552 | 2.95 | 12.16 | 72.03 | 101.50 | 104.73.6 | d | |||
| MRK 323 | 0.27 | 0.35 | 3.16 | 7.91 | 7.02.1 | 6.52.0 | 6.01.8 | b | |
| NGC 7673 | 0.13 | 0.52 | 4.91 | 6.89 | 7.61.9 | 4.11.0 | c | ||
| NGC 7714 | 0.47 | 2.85 | 10.36 | 11.51 | 8.01.1 | 5.30.8 | 5.50.8 | g | |
| MRK 332 | 0.36 | 0.62 | 4.87 | 9.49 | 6.41.9 | 5.61.7 | 4.71.4 | b |
| Name | F(1482Å) | F(1913Å) | F(2373Å) | F(2700Å) | U | B | V | R | J | H | K | Ref. | |
|---|---|---|---|---|---|---|---|---|---|---|---|---|---|
| (10-14 erg cm-2 s-1 Å-1) | (mJy) | ||||||||||||
| (1) | (2) | (3) | (4) | (5) | (6) | (7) | (8) | (9) | (10) | (11) | (12) | (13) | |
| ESO 350-G 38 | 8.0 | 12.4 | 10.5 | 11.8 | 11.5 | b | |||||||
| NGC 232 | 7.2 | 23.9 | 64.3 | 78.7 | 73.4 | a | |||||||
| MRK 555 | 27.6 | 83.5 | 104.0 | 91.5 | c | ||||||||
| IC 1586 | 0.590.14 | 0.480.05 | 4.7 | 5.1 | 7.8 | 10.8 | 13.2 | 10.8 | c | ||||
| NGC 337 | 29.5 | 63.9 | 82.6 | 163.0 | 180.0 | 153.0 | a | ||||||
| IC 1623 | 6.2 | 37.2 | 55.4 | 54.8 | b | ||||||||
| NGC 1155 | 2.5 | 32.0 | 35.7 | 31.0 | c | ||||||||
| UGC 2982 | 3.3 | 56.3 | 74.0 | 79.0 | a | ||||||||
| NGC 1569 | 1.170.16 | 0.810.12 | 0.690.13 | 1.330.07 | 37.1 | 76.8 | 141.0 | 147.0 | 471.0 | 549.0 | 480.0 | a | |
| NGC 1614 | 0.560.22 | 0.430.08 | 6.5 | 15.1 | 24.3 | 23.6 | 40.3 | 46.6 | 53.2 | d | |||
| NGC 1667 | 0.300.18 | 0.260.09 | 13.7 | 33.2 | 54.1 | 171.0 | 218.0 | 184.0 | c | ||||
| NGC 1672 | 3.010.31 | 2.770.18 | 2.850.67 | 2.900.24 | 139.0 | 329.0 | 489.0 | 473.0 | 1100.0 | 1190.0 | 1040.0 | a | |
| NGC 1741 | 14.4 | 20.4 | 24.7 | 12.2 | 13.9 | 12.2 | c | ||||||
| NGC 3079 | 42.6 | 103.0 | 165.0 | 670.0 | 903.0 | 830.0 | a | ||||||
| NGC 3690 | 2.330.27 | 1.680.15 | 1.080.31 | 1.020.15 | 66.2 | 224.0 | 296.0 | 285.0 | a | ||||
| NGC 4088 | 65.7 | 148.0 | 217.0 | 649.0 | 797.0 | 680.0 | a | ||||||
| NGC 4100 | 29.5 | 74.7 | 125.0 | 413.0 | 501.0 | 408.0 | a | ||||||
| NGC 4214 | 10.300.93 | 6.340.39 | 4.340.34 | 3.550.12 | 141.0 | 342.0 | 446.0 | 520.0 | 614.0 | 458.0 | a | ||
| NGC 4861 | 9.920.98 | 5.470.85 | 3.340.86 | 2.560.67 | 29.5 | 43.0 | 16.8 | 14.0 | 13.1 | a | |||
| NGC 5054 | 32.9 | 91.5 | 157.0 | 203.0 | 622.0 | 760.0 | 614.0 | a | |||||
| NGC 5161 | 26.7 | 67.5 | 119.0 | 134.0 | 254.0 | 296.0 | 235.0 | a | |||||
| NGC 5383 | 25.7 | 64.5 | 100.0 | 249.0 | 297.0 | 257.0 | a | ||||||
| MRK 799 | 34.8 | 157.0 | 194.0 | 170.0 | c | ||||||||
| NGC 5669 | 65.7 | 141.0 | 247.0 | 169.0 | e | ||||||||
| NGC 5676 | 30.3 | 76.1 | 122.0 | 410.0 | 540.0 | 456.0 | c | ||||||
| NGC 5713 | 32.0 | 78.2 | 120.0 | 328.0 | 369.0 | 310.0 | a | ||||||
| NGC 5860 | 0.740.21 | 0.500.11 | 0.370.11 | 0.460.08 | 8.9 | 35.6 | 42.6 | 32.5 | c | ||||
| NGC 6090 | 1.070.34 | 0.870.11 | 10.7 | 8.6 | 14.2 | 16.7 | 21.4 | 20.0 | h | ||||
| NGC 6217 | 1.740.21 | 1.550.15 | 41.1 | 81.9 | 125.0 | 214.0 | 260.0 | 226.0 | c | ||||
| NGC 6643 | 38.2 | 86.6 | 133.0 | 297.0 | 383.0 | 325.0 | g | ||||||
| UGC 11284 | 3.2 | 11.7 | 19.2 | 19.1 | b | ||||||||
| NGC 6753 | 26.2 | 69.4 | 166.0 | 231.0 | 632.0 | 780.0 | 724.0 | a | |||||
| TOL 1924-416 | 3.810.25 | 2.250.33 | 1.410.11 | 1.190.05 | 12.8 | 20.4 | 22.8 | 11.9 | 7.1 | 7.2 | 5.9 | c | |
| NGC 6810 | 15.5 | 48.0 | 96.6 | 161.0 | 477.0 | 656.0 | 565.0 | c | |||||
| ESO 400-G 43 | 8.4 | 8.2 | 8.2 | 10.7 | 6.1 | c | |||||||
| NGC 7496 | 1.430.21 | 1.060.08 | 1.000.14 | 0.870.05 | 72.8 | 129.0 | 255.0 | 298.0 | 231.0 | c | |||
| NGC 7552 | 1.720.28 | 1.910.19 | 1.940.56 | 2.320.23 | 52.7 | 138.0 | 215.0 | 285.0 | 638.0 | 749.0 | 645.0 | a | |
| MRK 323 | 5.1 | 12.6 | 20.6 | 72.4 | 87.8 | 74.3 | c | ||||||
| NGC 7673 | 2.290.37 | 1.520.11 | 1.030.16 | 1.000.07 | 13.2 | 23.0 | 28.7 | 39.6 | 44.5 | 34.0 | c | ||
| NGC 7714 | 3.700.41 | 2.550.26 | 1.880.27 | 2.000.13 | 17.3 | 26.9 | 37.1 | 78.1 | 89.5 | 83.0 | c | ||
| MRK 332 | 13.4 | 27.6 | 41.0 | 63.1 | 115.0 | 141.0 | 119.0 | c | |||||
| Band | Log | Log (REDSED) | Log (BLUESED) |
|---|---|---|---|
| (Hz) | |||
| 1457Å | 15.31 | 3.83 | 4.26 |
| B | 14.83 | 4.89 | 5.58 |
| J | 14.38 | 4.94 | 5.78 |
| H | 14.26 | 4.92 | 5.76 |
| K | 14.14 | 4.77 | 5.56 |
| 12m | 13.40 | 4.95 | 5.13 |
| 25m | 13.08 | 5.15 | 5.11 |
| 60m | 12.70 | 5.61 | 5.65 |
| 100m | 12.48 | 5.53 | 5.78 |
| 150m | 12.30 | 5.34 | 5.51 |
| 170m | 12.25 | 5.21 | 5.42 |
| 180m | 12.22 | 5.06 | 5.39 |
| 205m | 12.16 | 4.87 | 5.09 |
| 8.46 GHz | 9.93 | 0.13 | 0.06 |
| 4.89 GHz | 9.69 | 0.17 | 0.09 |
| 1.49 Ghz | 9.15 | 0.00 | 0.00 |