ELT requirements for future observations of the Intergalactic Medium
Abstract
We summarise the science cases for an ELT that were presented in the parallel session on the intergalactic medium, and the open discussion that followed the formal presentations. Observations of the IGM with an ELT provides tremendous potential for dramatic improvements in current programmes in a very wide variety of subjects. These range from fundamental physics (expansion of the Universe, nature of the dark matter, variation of physical constants), cosmology (geometry of the Universe, large-scale structure), reionisation (ionisation state of the IGM at high ), to more traditional astronomy, such as the interactions between galaxies and the IGM (metal enrichment, galactic winds and other forms of feedback), and the study of the interstellar medium in high galaxies through molecules. The requirements on ELTs and their instruments for fulfilling this potential are discussed.
keywords:
galaxies: formation, high-redshift; intergalactic medium; quasars, absorption lines; ISM; cosmology: dark matter1 Introduction
The advent of echelle spectrographs on 8m class telescopes since the early 1990’s has revolutionised our understanding of the intergalactic medium (IGM) as observed in quasar spectra. These bright sources have smooth intrinsic spectra with broad emission lines, yet the observed spectra contain hundreds of narrow absorption lines due to intervening absorbers. The latter can be studied in great detail from the exquisite, , spectra possible with UVES on VLT and HiRes on Keck.
Most of the absorption in the UV is due to neutral hydrogen left over from the Big Bang, forming a forest of lines (Bahcall & Salpter 1965; Gunn & Peterson 1965; Lynds 1971). The weaker lines with column density (H i) are traditionally called the ‘Lyman- forest’, with the strongest lines with column density that show a measurable damping-wing called ‘Damped Lyman- systems’ (DLAs). The number of lines as a function of redshift and column-density, (H i), is close to a power-law (H i)β with , as function of column-density, and evolves strongly with redshift as fewer lines are produced as the mean density decreases due to the expansion of the Universe, see Rauch (1998) for a review.
The weaker lines originate in the filaments of the cosmic web which itself is a natural outcome of how structure forms in a dark matter dominated cosmology (Bi et al. 1992; Cen et al. 1994; Schaye 2001). The neutral hydrogen fraction is small at redshifts (Gunn & Peterson 1965) as the gas is photo-ionised and photo-heated by the UV-background, with photo-ionisation rate , produced by galaxies and quasars (Haardt & Madau 1996). At lower , the forest of lines thins-out into a Lyman- ‘savanna’ , but the decline is slowed because also decreases as the emissivity from galaxies and QSOs drops (Theuns et al. 1998a; Davé et al. 1999). Conversely at increasing , the mean density increases, but also decreases as many source have yet to form, turning the forest into a Lyman- ‘jungle’ which absorbs (nearly) all light, perhaps signaling the end of reionisation (Becker et al. 2001; Djorgovski et al. 2001). The forest provides a tremendous probe of how the IGM evolves in the intermediate redshift range , because the absorbers are only mildly non-linear and hence can be simulated reliably (Cen et al. 1994; Hernquist et al. 1996; Theuns et al. 1998b; Zhang et al. 1998; Bryan et al. 1999). The combination of superb data with reliable models makes it possible to constrain models and determine parameters.
Stronger lines form near galaxies, with the DLAs potential proto-galaxies or proto-galactic lumps (Wolfe 1995; Haehnelt et al. 1998; Ledoux et al. 1998). Since these systems are discovered in absorption, it is a worry that even denser systems might be missed because they make the background QSO too faint to appear in a magnitude-limited survey. For a recent appraisal of this issue see Ellison et al. (2005 and reference therein). DLAs shield the UV-background and some fraction of the gas becomes molecular (see, e.g., Srianand this volume). The prospect of studying star formation in small systems at high redshift which are too faint to study in emission, is very exciting.
Quasar spectra also contain ‘metal’ lines from highly ionised species such as CIV , SiIV and OVI (e.g., Cowie et al. 1995). These metals were synthesised in stars and managed to diffuse into the lower density surroundings, either as a result of galactic winds, or due to an early generation of population III stars.
The next section gives a short overview of recent results, with emphasis on opportunities for progress with the advent of new observatories.
2 IGM observations with ELT: science
We begin with a short overview of numerical simulations of the IGM, as these can be used to investigate the main limitations of current observational strategies, thereby guiding the design for new instruments. We then discuss current and future science that can be done with IGM observations. The next section summarises the corresponding requirements for an ELT.
2.1 Hydrodynamical simulations
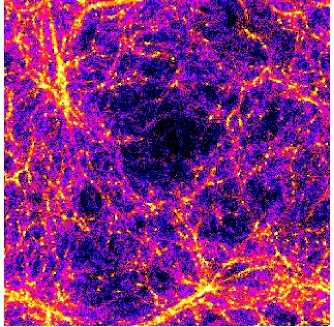

Most of the weaker “Lyman forest” lines form in mildly over dense or under dense structures that can be simulated accurately (Bi et al. 1992; Cen et al. 1994). Fig. 1 displays the gas distribution in a cosmological hydrodynamical simulation at , and shows that the gas traces the filamentary pattern that results from structure formation in a dark matter Universe. A sight line through such a density distribution will most often go through low density voids, occasionally intersecting a filament which will produce an absorption line, and even more rarely pass close to or even straight through a galaxy halo, producing a very strong absorption line.
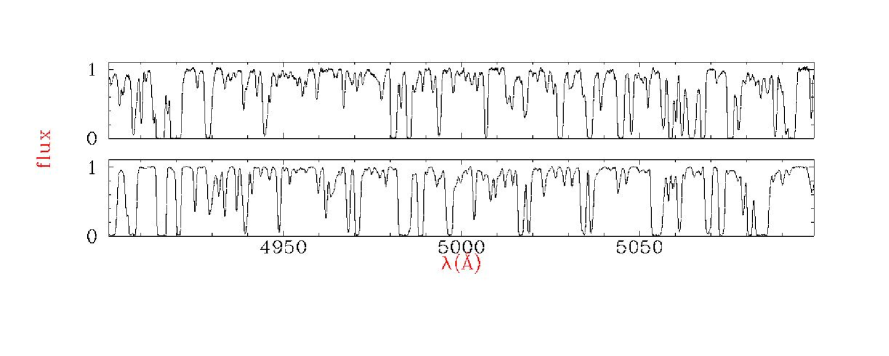
Mock spectra generated from such simulations look very similar to the real data, see, e.g., Fig. 2. Since most of the lines are due to structures that are only mildly over dense, it is possible to simulate them quite reliably. Comparison of such simulated spectra with observed ones makes it possible to constrain the model parameters and investigate which cosmological parameters determine the line statistics.
Most of the volume in the simulations is photo-heated by the UV-background after reionisation, the volume affected by shocks from structure formation is small. The temperature of the IGM affects the properties of the lines (Theuns, Schaye & Haehnelt 2000), because the widths of the narrowest lines is restricted by thermal broadening. Detailed comparison with data allows one to constrain the thermal history of the IGM (Schaye et al. 2000; Ricotti et al. 2000; Bryan & Machacek 2000; McDonald et al. 2001), because the thermal time-scales are long in the low-density IGM. This also puts constraints on reionisation if photo-heating is the dominant heating mechanism (Theuns et al. 2002b).
The detailed line properties are also sensitive to the nature of the dark matter, and can for example constrain the mass of a putative warm dark matter particle (Croft et al. 1999; Viel et al. 2005). If the warm dark matter smoothing length is comparable to the width of filaments, then this will affect the line shape. Note that these scales become non-linear at lower , making it much harder to put tight constraints on the dark matter properties.
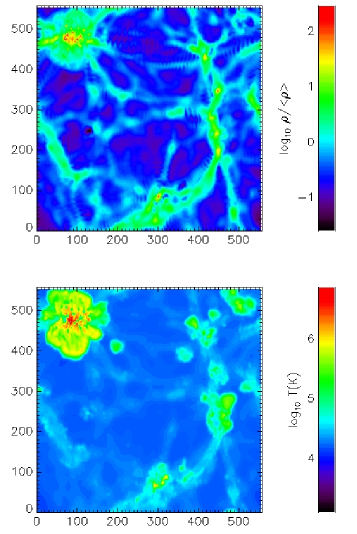
Sight lines passing close to a galaxy may be affected by non-gravitational effects such as feedback from star formation or AGN. Fig. 3 illustrates how supernova feedback causes bigger galaxies to be embedded in a hot bubble of metal enriched gas, which expands into the lower density surroundings of halos. Such sight lines will also show metal line absorption, and it is possible to compare in detail the metal-hydrogen correlation in simulations and data to infer the physical properties in the surroundings of high- galaxies (Adelberger et al. 2003; Pieri et al. 2005). ELTs will provide dramatic improvements in this subject, because the bigger collecting area will allow one to observe fainter sources, and hence allow a far finer grid of sight lines probing galaxy environs.
2.2 Fundamental Physics
High resolution high signal-to-noise spectra of high- QSOs are
frequently used to test the current theories of cosmology and
fundamental physics.
CODEX: The observed wavelength of a given absorption line changes
with time due to the expansion of the Universe. The COsmic Dynamics
EXperiment (CODEX) (see Molaro et al. , this volume) aims to measure
this change directly by observing many lines in a QSO spectrum at
extreme signal-to-noise and resolution, and repeat the measurement a
few decades later. Such an experiment therefore also requires very
high and long term stability of the spectrograph.
A more indirect measure of the expansion of the Universe is by determining the CMB temperature at intermediate redshift using the fine-structure excitation lines of carbon in DLAs, which is excited by CMB photons (see [Srianand, Petitjean & Ledoux 2000]). Detecting C i absorption lines from the low density regions, where the collisional excitation will be sub-dominant using high S/N spectra will allow one to directly map the redshift evolution of temperature of the CMBR (R. Srianand, this volume).
Some of the current theories of fundamental physics, such as SUSY, GUT and Super-string theory, allow possible space and time variations of the fundamental constants. QSO absorption lines can be used to probe the time evolution of fundamental constants. The heavy element absorption lines and H2 Lyman Werner band absorptions lines are used to investigate the time-variation of the electromagnetic coupling constant (see [Murphy et al. 2003]; [Chand et al. 2004] and Mollaro et al. this volume) and the proton to electron mass ratio ()(see [Ivanchik et al. 2005]), respectively. The available constraints based on 8m class telescopes are still much higher than those achieved by terrestrial techniques. Higher resolution (R) and good signal-to-noise ratios () are needed to improve the precession.
The Square Kilometer Array (SKA) will measure the 21-cm line in most of the DLAs. The wavelength of the transition depends on , and the proton g-factor and can provide a combined constraint on the variation of all these fundamental constants (see [Curran et al. 2004]). Detecting H2 and weak transitions of Mn ii, Ni ii in DLAs with high signal-to-noise and resolution will allow us to lift the degeneracy between the variation of different fundamental constants that decide the shift of the 21 cm absorption line.
To avoid the systematics caused by the small-scale properties of the lines we require high resolution and high signal-to-noise to improve current constraints. To study the redshift evolution and to be able to use different sets of lines from the same system, it is of paramount importance to have a wide wavelength coverage.
2.3 Cosmology
The large-scale flux distribution can be used to infer the dark matter power spectrum (Croft et al. 1998; McDonald et al. 2000; Viel et al. 2004) and constrain the neutrino mass (Croft et al. 1999; Viel et al. 2005). These measurements are currently limited by uncertainties in the shape of the QSO’s underlying continuum, calibration of the echelle spectrograph for high resolution spectra, and by the statistics of available spectra, and would not obviously benefit from an ELT. However, the influence of large-scale structure is also very prominent in simulations at low optical depths, below the median . Such observations require much higher S/N than currently available, since even S/N=50 data cannot recover the median optical depth at .
Observations of the forest along parallel sight lines can constrain the topology of the Universe via the Alcock-Paczynski (1979) test (e.g., Rollinde et al. 2003). Such a project would benefit greatly from observing fainter QSOs and bright LBGs to improve the sampling in the transverse direction to the line of sight.
2.4 Reionisation
The Lyman- forest becomes increasingly opaque above , perhaps signaling the end of reionisation. If the IGM is polluted through winds from early generations of dwarf galaxies then the ionisation state of the IGM can be probed through the absorption produced by C iv, C ii, O i and Si ii (with NIR wavelength m for , 14.7, 15.1 and 15.7, respectively, e.g., Oh 2002). Given the rapidly declining space density of QSOs, Gamma Ray Bursts (GRBs) or super novae could be used as background sources.
GRBs have mean afterglow fluxes of 1.5 to 0.05J at , 1 to 10 days after the explosion ( to 27). High resolution () and high signal-to-noise ratios () are required to detect individual lines in the NIR. Observations of a very bright J GRB at and S/N=50 gives detection limits for (C ii)= and (O i)=1 . Pair-instability SNe of pop. III precursors have for , and are also potential targets, with a possible time-lag of weeks between discovery and ELT follow-up spectroscopy (see the presentation by J. Bergeron in this volume for details).
2.5 Galaxy-Intergalactic medium interactions and metal enrichment
The metal density of carbon as inferred from C iv pixel optical depth analysis (Songaila 2001; Schaye et al. 2003) shows little evidence for evolution over the redshift range , with possibly a decline by factor of two above . It is possible that not all metals are seen. Just as most metals are in the hot intra-cluster gas at , metals could be in hot gas resulting from galactic winds at higher , thereby not producing significant C iv absorption (Theuns et al. 2002a and this volume). The shape of the UV-background, and its evolution with , is the main uncertainty in converting optical depth to metallicity. Improved constraints require the detection of many more transitions to eliminate this uncertainty.
What is the origin of the metals seen in the IGM? Are the metals due to galactic winds, or is some fraction the result of pop. III stars? This important question can be addressed by correlating metals seen in absorption with the presence of galaxies (e.g., Adelberger et al. 2003, 2005; Pieri, Schaye & Aguirre 2005). This can be done by probing the IGM with many sight lines, and requires obtaining spectra of fainter sources, including the brighter Lyman-break galaxies (LBGs) themselves. Current state of the art (Adelberger et al. 2005) is limited to measuring the mean metallicity in C iv as function of the galaxy’s impact parameter; higher S/N should make it possible to look for metals in each individual galaxy spectrum and obtain good redshifts. A better understanding of galaxy-IGM interactions is needed to constrain how feedback from stars and AGN affects galaxy formation as a function of redshift and galaxy mass. The redshift range is well suited for such a study, as there are many lines in the observed optical-NIR part of the spectrum suited to ground-based observations, but an ELT is required to be able to observe fainter QSOs or brighter LBGs and dramatically improve the sampling with many more sight lines.
2.6 Molecules at high
Detecting H2 and other molecules at high-z through their electronic transitions is important for understanding the physical conditions and astrochemistry in the interstellar medium of galaxies and protogalaxies at a very early epoch. Up to now, H2 has been detected in of DLAs ([Ledoux et al. 2003]) and only one system shows detectable HD (Varshalovich et al. 2001). H2 can potentially be detected from LBGs and GRB host galaxies. This will allow us to understand the interstellar medium in these early galaxies. As the Lyman Werner band absorptions of H2 are expected in the Ly forest, it is important to have high resolution R = 20 000 and signal-to-noise () in the blue spectrum. ELTs with blue sensitive spectrographs can allow us to search for H2 in fainter QSOs, GRBs and brighter LBGs. However, in the case of GRBs, H2 may be in non-equilibrium and it is important to target the source as quickly as possible to be able to detect the H2 lines and follow the time variation of H2 column density. This will give important clues about the GRB hosts.
Detecting other molecules in systems with H2 is also important for the understanding of astrochemistry in low metallicity gas in the early universe. CO is not detected in DLAs and the achieved limits are close to the lowest column measured in Milky Way. As the metallicities in DLAs are low, to test N(H2) vs. N(CO) relation we need to push this limit by roughly a factor 50 (see the presentation by R. Srianand in this volume).
3 IGM observations with ELT: requirements
In this section we summarise the ELT requirements that emerge out of the discussion in the parallel session on IGM.
High : Reionisation, metals, Lyman- emitters: Constraining IGM enrichment and its ionisation state from metal lines at requires observations at intermediate resolution of in the NIR with S/N up to 100. An OH-line suppressor with multiple IFUs with field-of-view of several arcmin2 is ideal. Targets are moderately faint QSOs and Lyman-break galaxies of , but require an ELT larger than 30m. NIR observations at with S/N up to 100 is possible from average-luminosity GRBs and pop. III SNe. Targets need to be found using dedicated ground and space-based telescopes.
-
NIR, R=2000, S/N=100 (bright QSOs)
-
NIR, R=10000, S/N=100 (single target GRBs)
Intermediate : Metals: High resolution and S/N of 10000 optical spectra of bright QSOs (, ) and bright GRBs ( up to 7, lag is 1 day, , S/N=100) in single target mode are required to study the distribution of metals in the IGM, and its evolution with . The spectrograph should be blue sensitive and have a large wavelength range () to be able to cover a large range of transitions and constrain the ionisation corrections. The latter is the major uncertainty in inferring metallicity, so a large range is essential.
-
optical, R=40000, S/N= (single target bright QSOs, GRBs). Blue sensitive, large () coverage.
Lower : galaxy-IGM connection, UV-escape from galaxies: The main gain of an ELT is the possibility of observing fainter QSOs, which allows one to sample the metal distribution in the IGM, and its correlation with galaxies dramatically better by providing a much finer grid of lines along which the IGM can be probed. The QSOs and bright LBGs can be observed with optical, high spectroscopy (S/N=100) to probe the distribution of metals. A detailed correlation of these metals with galaxies requires the redshift determination of the fainter LBGs (up to 0.01) using optical/NIR MOS of , with multiple IFUs with a total FoV of several arcmin2, centered on LBGs and QSOs. NIR is required to obtain good redshifts for the galaxies from stellar and ISM lines, since many of the UV-lines can be significantly off-set from the redshift of the stars.
-
Optical/NIR, R=2000-5000, S/N=100 (0.01 LBGs) with multiple IFUs, FoV several arcmin2
-
Optical, R=50000, S/N=100 (bright LBGs, QSOs)
Many small programmes could be started at early stages of construction if the instruments are available. 8m-class telescopes will be used to find (candidate) LBGs and Lyman- emitters.
Acknowledgements.
We wish to thank IAU for a travel grant. TT thanks PPARC for the award of an Advanced Fellowship, and J Schaye, R Bower and I Smail for comments on the draft.References
- [Adelberger et al. 2003] Adelberger, K.L., Steidel, C.C., Shapley, A.E. & Pettini, M. 2003, ApJ584, 45
- [Adelberger et al. (2005)] Adelberger, K.L., Shapley, A.E., Steidel, C.C., Pettini, M., Erb, D.K. & Reddy, N.A. 2005, ApJ629, 636
- [Alcock & Paczynski(1979)] Alcock, C. & Paczynski, B. 1979, Nature281, 358
- [Bahcall & Salpeter(1965)] Bahcall, J. N., & Salpeter, E. E. 1965, ApJ142, 1677
- [Becker et al. (2001)] Becker, R. H., Fan, X., White, R., et al. 2001, AJ122, 2850
- [Bi et al. (1992)] Bi, H. G., Boerner, G., & Chu, Y. 1992, A&A266, 1
- [Bryan & Machacek(2000)] Bryan, G. L., & Machacek, M. E. 2000, ApJ534, 57
- [Bryan, Machacek, Anninos, & Norman(1999)] Bryan, G. L., Machacek, M., Anninos, P., & Norman, M. L. 1999, ApJ517, 13
- [\citenameCen et al.1994] Cen, R., Miralda’Escudé, J., Ostriker, J.P.& Rauch, M., 1994, ApJ437, L83
- [Chand et al. 2004] Chand, H., Srianand, R., Petitjean, P. et al. 2004, A&A417, 853
- [Curran et al. 2004] Curran, S. J., Kanekar, N & Darling, J. K., 2004, New Astronomy Reviews 48, 1095
- [Cowie, Songaila, Kim, & Hu(1995)] Cowie, L. L., Songaila, A., Kim, T., & Hu, E. M. 1995, AJ109, 1522
- [Croft et al. 1998] Croft, R. A. C. Weinberg, D. H. Katz, N., & Hernquist, L, 1998, ApJ495, 44
- [Croft et al. (1999)] Croft, R. A. C., Hu, W., & Davé, R. 1999, Phys. Rev. Lett.83, 1092
- [Davé, Hernquist, Katz & Weinberg (1999)] Davé, R., Hernquist, L., Katz, N., & Weinberg, D. 1999, ApJ511, 521
- [Djorgovski et al. (2001)] Djorgovski, S. G., Castro, S., Stern, D., & Mahabal, A. A. 2001, ApJ560, L5
- [Ellison et al. (2005)] Ellison, S. L., Hall, P. B., & Lira, P. 2005, AJ130, 1345
- [Gunn & Peterson(1965)] Gunn, J. E., & Peterson, B. A. 1965, ApJ142, 1633
- [Haardt & Madau(1996)] Haardt, F., & Madau, P. 1996, ApJ461, 20
- [Haehnelt et al. (1998)] Haehnelt, M. G., Steinmetz, M., & Rauch, M. 1998, ApJ495, 647
- [Hernquist et al. (1996)] Hernquist, L., Katz, N., Weinberg, D. H., & Miralda-Escudé, J. 1996, ApJ457, L51
- [Ivanchik et al. 2005] Ivanchik. A., Petitjean, P., Varshalovich, D., Aracil, B., Srianand, R., Chand, H., Ledoux, C. & Boisse, P. 2005, A&A440, 45
- [Ledoux et al.(1998)] Ledoux, C., Petitjean, P., Bergeron, J., Wampler, E. J., & Srianand, R. 1998, A&A337, 51
- [Ledoux et al. 2003] Ledoux, C., Petitjean, P., & Srianand, R. 2003, MNRAS346, 209
- [Lynds(1971)] Lynds, R. 1971, ApJ164, L73
- [McDonald et al. 2000] McDonald P., Miralda-Escude, J., Rauch, M., Sargent W. L. W., Barlow, T. A., Cen, R & Ostriker, J. P. 2000, ApJ543, 1
- [McDonald et al. (2001)] McDonald, P., Miralda-Escudé, J., Rauch, M., Sargent, W. L. W., Barlow, T. A., & Cen, R. 2001, ApJ562, 52
- [Murphy et al. 2003] Murphy, M. T., Webb, J. K. & Flambaum, V. V. 2003, MNRAS345, 609
- [Oh(2002)] Oh, S. P. 2002, MNRAS336, 1021
- [] Pieri, M.M., Schaye, J. & Aguirre, A., 2005, preprint, astro-ph/0507081
- [Rauch(1998)] Rauch, M. 1998, ARA&A36, 267
- [Ricotti et al. (2000)] Ricotti, M., Gnedin, N. Y., & Shull, J. M. 2000, ApJ534, 41
- [] Rollinde, E., Petitjean, P., Pichon, C., Colombi, S., Aracil, B., D’Odorico, V. & Haehnelt, M. G. 2003, MNRAS341, 1279.
- [Schaye et al. (2000)] Schaye, J., Theuns, T., Rauch, M., Efstathiou, G., & Sargent, W. L. W. 2000, MNRAS318, 817
- [Schaye(2001)] Schaye, J. 2001, ApJ559, 57
- [Schaye et al. (2003)] Schaye, J., Aguirre, A., Kim, T., Theuns, T., Rauch, M., & Sargent, W. L. W. 2003, ApJ596, 768
- [Songaila(2001)] Songaila, A. 2001, ApJ561, L153
- [Srianand, Petitjean & Ledoux 2000] Srianand R., Petitjean P. & Ledoux C. 2000, Nature408, 931
- [Theuns et al. (1998)] Theuns, T., Leonard, A., & Efstathiou, G. 1998a, MNRAS297, L49
- [Theuns et al. (1998)] Theuns, T., Leonard, A., Efstathiou, G., Pearce, F. R., & Thomas, P. A. 1998b, MNRAS301, 478
- [Theuns et al. (2000)] Theuns, T., Schaye, J., & Haehnelt, M. G. 2000, MNRAS315, 600
- [Theuns et al. (2002)] Theuns, T., Viel, M., Kay, S., Schaye, J., Carswell, R. F., & Tzanavaris, P. 2002a, ApJ578, L5
- [Theuns et al. (2002)] Theuns, T., Schaye, J., Zaroubi, S., Kim, T.-S., Tzanavaris, P., & Carswell, B. 2002b, ApJ567, L103
- [] Varshalovich, D. A., Ivanchik, A. V., Petitjean, P., Srianand, R. & Ledoux, C. 2001, AstL 27, 683
- [Viel et al. (2004)] Viel, M., Haehnelt, M. G., & Springel, V. 2004, MNRAS354, 684
- [Viel et al. (2005)] Viel, M., Lesgourgues, J., Haehnelt, M. G., Matarrese, S., & Riotto, A. 2005, Phys. Rev. D71, 063534
- [Wolfe 1995] Wolfe A. M. 1995, in: Meylan G. (ed.), Proc. ESO Workshop, QSO Absorption lines (Berlin: Springer), p. 13
- [Zhang et al. (1998)] Zhang, Y., Meiksin, A., Anninos, P., & Norman, M. L. 1998, ApJ495, 63