Tracing the Mass–Assembly History of Galaxies with Deep Surveys
Abstract
We use the optical and near-infrared galaxy samples from the Munich Near-Infrared Cluster Survey (MUNICS), the FORS Deep Field (FDF) and GOODS-S to probe the stellar mass assembly history of field galaxies out to . Combining information on the galaxies’ stellar mass with their star-formation rate and the age of the stellar population, we can draw important conclusions on the assembly of the most massive galaxies in the universe: These objects contain the oldest stellar populations at all redshifts probed. Furthermore, we show that with increasing redshift the contribution of star-formation to the mass assembly for massive galaxies increases dramatically, reaching the era of their formation at and beyond. These findings can be interpreted as evidence for an early epoch of star formation in the most massive galaxies in the universe.
1 Introduction
In recent years, there has been considerable interest in the relation of the stellar mass in galaxies and their star-formation rate (SFR), since this allows to quantify the contribution of the recent star formation to the build up of stellar mass for different galaxy masses. Cowie et al. (1996) were the first to investigate this connection for a -selected sample of galaxies at and noted an emerging population of massive, heavily star forming galaxies at higher redshifts, a phenomenon they termed “down-sizing”. Later on, the specific star-formation rate (SSFR), defined as the SFR per unit stellar mass, was used to study this relation.
2 Connecting Star Formation and Stellar Mass
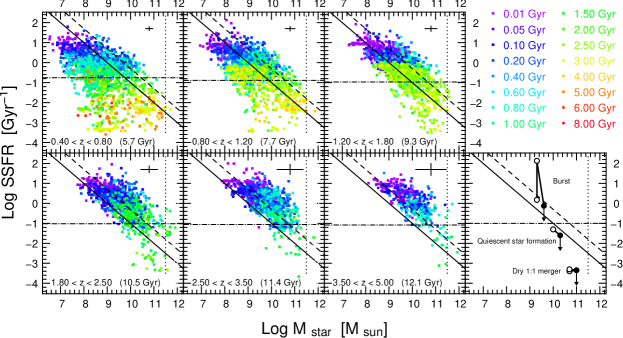
We have analysed the SSFR as a function of stellar mass and redshift out to (Feulner et al., 2005b) using a large sample of more than 6000 -band selected galaxies from MUNICS (Drory et al., 2001; Feulner et al., 2003). The SSFR decreases with mass at all redshifts, although we might not detect highly obscured galaxies. The low values of the SSFR of the most massive galaxies suggests that most of these massive systems formed the bulk of their stars at earlier epochs. Furthermore, stellar population synthesis models show that the most massive systems contain the oldest stellar populations at all redshifts. This is in agreement with the detection of old, massive galaxies at redshifts (Saracco et al., 2003; Cimatti et al., 2004; Saracco et al., 2005) and beyond (Chen & Marzke, 2004). In Fig. 1, where we have used the FDF (Heidt et al., 2003; Gabasch et al., 2004a) and GOODS-S samples, we show that this trend continues to even higher redshifts (Feulner et al., 2005a).
3 The Build-up of the Most Massive Galaxies
It is extremely interesting to investigate the average SSFR of galaxies with different masses as a function of redshift shown in Fig. 2 (Feulner et al., 2005a). While at redshifts the most massive galaxies are in a quiescent state, at redshifts the SSFR for massive galaxies increases by a factor of reaching the epoch of their formation at and beyond. While there is evidence for dry merging (i.e. without interaction-induced star formation) in the field galaxy population (Faber et al., 2005; Bell et al., 2005), this strong increase in the SSFR of the most massive galaxies suggests that at least part of this population was formed in an early period of efficient star formation in massive haloes.

References
- Bell et al. (2005) Bell, E. et al. 2005, ApJ, submitted, astro-ph/0506425
- Chen & Marzke (2004) Chen, H.-W. & Marzke, R. O. 2004, ApJ, 615, 603
- Cimatti et al. (2004) Cimatti, A., Daddi, E., Renzini, A., et al. 2004, Nature, 430, 184
- Cowie et al. (1996) Cowie, L. L., Songaila, A., Hu, E. M., & Cohen, J. G. 1996, AJ, 112, 839
- Drory et al. (2004) Drory, N., Bender, R., Feulner, G., et al. 2004, ApJ, 608, 742
- Drory et al. (2001) Drory, N., Feulner, G., Bender, R., et al. 2001, MNRAS, 325, 550
- Drory et al. (2005) Drory, N., Salvato, M., Gabasch, A., et al. 2005, ApJL, 619, L131
- Faber et al. (2005) Faber, S. M. et al. 2005, ApJ, submitted, astro-ph/0506044
- Feulner et al. (2003) Feulner, G., Bender, R., Drory, N., et al. 2003, MNRAS, 342, 605
- Feulner et al. (2005a) Feulner, G., Gabasch, A., Salvato, M., et al. 2005a, ApJL, 633, L9
- Feulner et al. (2005b) Feulner, G., Goranova, Y., Drory, N., Hopp, U., & Bender, R. 2005b, MNRAS, 358, L1
- Gabasch et al. (2004a) Gabasch, A., et al. 2004a, A&A, 421, 41
- Heidt et al. (2003) Heidt, J., Appenzeller, I., Gabasch, A., et al. 2003, A&A, 398, 49
- Saracco et al. (2005) Saracco, P., Longhetti, M., Severgnini, P., et al. 2005, MNRAS, 357, L40
- Saracco et al. (2003) Saracco, P., Longhetti, M., Severgnini, P., et al. 2003, A&A, 398, 127