First Attempt at Spectroscopic Detection of Gravity Modes in a Long-Period Pulsating Subdwarf B Star – PG 1627+01711affiliation: Observations reported here were obtained at the MMT Observatory, a joint facility of the Univerity of Arizona and the Smithsonian Institution.
Abstract
In the first spectroscopic campaign for a PG 1716 variable (or long-period pulsating subdwarf B star), we succeeded in detecting velocity variations due to g-mode pulsations at a level of 1.0–1.5 km s-1, just above our detection limit. The observations were obtained during 40 nights on 2 m class telescopes in Arizona, South Africa, and Australia. The target, PG 1627+017, is one of the brightest (V = 12.9) and largest amplitude (0.03 mag) stars in its class. It is also the visible component of a post-common envelope binary. Our final radial velocity data set includes 84 hours of time-series spectroscopy over a time baseline of 53 days, with typical errors of 5–6 km s-1 per spectrum. We combined the velocities with previously existing data to derive improved orbital parameters. Unexpectedly, the velocity power spectrum clearly shows an additional component at twice the orbital frequency of PG 1627+017, supporting Edelmann et al.’s recent results for several other short-period subdwarf B stars, which they claim to be evidence for slightly elliptical orbits. Our derived radial velocity amplitude spectrum, after subtracting the orbital motion, shows three potential pulsational modes 3–4 above the mean noise level of 0.365 km s-1, at 7201.0 s (138.87 Hz), 7014.6 s (142.56 Hz) and 7037.3 s (142.10 Hz). Only one of the features is statistically likely to be real, but all three are tantalizingly close to, or a one day alias of, the three strongest periodicities found in the concurrent photometric campaign. We further attempted to detect pulsational variations in the Balmer line amplitudes. The single detected periodicity of 7209 s, although weak, is consistent with theoretical expectations as a function of wavelength. Furthermore, it allows us to rule out a degree index of = 3 or = 5 for that mode. Given the extreme weakness of g-mode pulsations in these stars, we conclude that anything beyond simply detecting their presence will require larger telescopes, higher efficiency spectral monitoring over longer time baselines, improved longitude coverage, and increased radial velocity precision.
1 Introduction
Subdwarf B (sdB) stars are evolved hot compact stars (22,000 K T 40,000K, 5.0 log g 6.2) that are commonly found in the disk of our Galaxy (Saffer et al. 1994). They are core helium-burning stars with extremely thin hydrogen envelopes ( 0.01), believed to have masses of about 0.5 (Saffer et al. 1994; Heber 1986). There is considerable interest in their evolutionary history, in part because a large fraction of sdB stars occur in post-common envelope binaries (e.g. Allard et al. 1994; Green, Liebert & Saffer 1997; Maxted et al. 2001, Morales-Rueda et al. 2003). Their structural details provide an important independent test of stellar evolution theory because the vast majority of low mass stars are expected to develop nearly identical helium cores during their red giant phase. Within the last decade, two different types of multimode pulsators have been found among sdB stars: shorter period variables exhibiting mainly pressure (p-)modes, and longer period variables whose pulsations must be due to gravity (g-)modes. These discoveries have opened up the possibility of using asteroseismology to investigate the structure of sdB stars, and, by extension, the helium-burning cores of most red giants.
The first short-period pulsating sdB stars were discovered by astronomers from the South African Astronomical Observatory (Kilkenny et al. 1997), and are commonly called EC 14026 stars111Now formally named the V361 Hya stars, after the prototype. Independently and nearly simultaneously, their existence was predicted by Charpinet et al. (1996, 1997), based on a -mechanism associated with the radiative levitation of iron in the thin diffusion-dominated envelopes. The resulting low-order and low-degree (=0,1,2,3) radial and nonradial p-modes produce velocity variations primarily along the star’s radial axis. Typical EC 14026 stars have pulsation periods of 100–200 s with amplitudes of a few hundredths of a magnitude or less. As predicted by Charpinet et al., they are found mostly among the hotter sdB stars, clustering around Teff 33,500 K and log g 5.8, although a few cooler, lower gravity examples exist with somewhat longer periods (up to about 10 minutes). The current tally of published EC 14026 stars is 34 (Kilkenny 2002a, and references therein; Silvotti et al. 2002; Dreizler et al. 2002; Bonanno et al. 2003; Oreiro et al. 2004; Solheim et al. 2004; Baran et al. 2005), although more than half are relatively faint (V 14).
The second class of sdB pulsators was serendipitously discovered by Green et al. (2003) during a light curve survey originally intended to search for binary eclipses and reflection effects. PG 1716 stars (Reed et al. 2004), sometimes called long-period sdB variables, pulsate on timescales of approximately an hour. They have extremely small photometric amplitudes, of the order of millimags (Randall et al. 2004, 2005bc). In contrast to the EC 14026 stars, long-period sdB pulsators are found only among cooler sdB stars, clustering around Teff 27,000 K and log g 5.4. Another difference is that the slower pulsators are much more common. Thirty of these variables, roughly 80% of sdB stars with temperatures between 24000 K and 29500 K, have been confirmed since 2001, all but two brighter than V = 14 (Green et al., in preparation). Fontaine et al. (2003) showed that PG 1716 stars can be excited by the same -mechanism proposed by Charpinet et al., if their g-modes are due to higher-degree (=3,4,5…) nonradial pulsations. Thus, although the analogy is not perfect, sdB p-mode and g-mode pulsators bear a strong resemblance to the main sequence Cephei and Slowly Pulsating B stars, respectively.
Pulsational modes are most easily detected photometrically. Since the first discovery, several groups have conducted surveys to search for new EC 14026 stars (Kilkenny 2002b, and references therein; Billères et al. 2002; Solheim et al. 2004) and PG 1716 stars (ongoing Steward Observatory survey). There have now been a number of photometric campaigns on selected short-period pulsators (e.g., Kilkenny et al. 2002b), and more recently, long-period pulsators (Reed et al. 2004; Randall et al. 2004, 2005bc). The common goal is to detect a sufficient number of pulsational modes for asteroseismology. Unfortunately, experience has shown that photometry alone, especially if carried out on small telescopes, is usually insufficient to identify these modes unambiguously with a single theoretical model. Unique identifications have been achieved for less than a handful of sdB pulsators (all observed on a 4 m class telescope), most notably PG 0014+067 (Brassard et al. 2001), PG 1219+534 (Charpinet et al. 2005b), and Feige 48 (Charpinet et al. 2005a), but also including PG 1047+003 (Charpinet, Fontaine, & Brassard 2003).
Charpinet et al. (2000) pointed out that spectroscopic detection of radial velocity (RV) modes should contain complementary information that might help to solve the mode identification problem. The brightest EC 14026 star, PG 1605+072, was the ideal first target from an observational point of view, since it has the largest photometric amplitude variations (0.2 mag) of any sdB pulsator, and a very rich pulsational spectrum (Kilkenny et al. 1999). Due to its unusually low surface gravity, it also has the longest periods (200–550s) of any EC 14026 variable. O’Toole et al. (2000) were the first to detect radial velocity shifts in PG 1605+072 using medium-resolution time-resolved spectroscopy. Additional time-series spectroscopy has since been carried out at the 4 m Anglo Australian Telescope and the William Herschel Telescope (Woolf, Jeffery, & Pollacco 2002a) at higher spectral ( 1Å) and temporal resolution, and also at the Danish 1.5 m and the Mt. Stromlo 1.9 m by O’Toole et al. (2002). Woolf et al. resolved three pulsation modes, while O’Toole et al. identified five modes, all of which were present in Kilkenny et al.’s (1999) photometry. In 2002, an ambitious world-wide campaign, the Multi-Site Spectroscopic Telescope (MSST), was organized to resolve closely spaced periods in PG 1605+072 and to obtain more precise velocity amplitudes for weaker modes (Heber at al. 2003; O’Toole et al. 2004). This resulted in 151 hours of spectroscopy, leading to at least 20 detected periodicities in PG 1605+072.
Woolf, Jeffery, & Pollacco (2002b) also investigated KPD 1930+2752, a fainter EC 14026 variable (V = 13.8), but found no significant peaks in the RV power spectrum above their 4 km s-1 detection limit that matched known photometric modes. Telting & Østensen (2004) succeeded in recovering the one dominant 138 s pulsation mode in PG 1325+101 (also V = 13.8) at an amplitude of nearly 12 km s-1, using spectra from three nights on the Nordic Optical Telescope. However, it is apparent that it will be quite difficult to obtain high quality spectroscopic detections of a sufficiently large number of frequencies to clarify mode identification in significantly fainter, shorter period, and lower amplitude p-mode sdB pulsators, given the short exposures required and the difficulties of obtaining large blocks of time on bigger telescopes.
During the planning stages of the first multisite photometric campaign on a long-period sdB pulsator, PG 1627+017 (Randall et al. 2004), which took place during April–June 2003, it was natural to consider the feasibility of a complementary spectroscopic campaign to detect g-mode pulsations. Near-simultaneous spectroscopy and photometry are essential, because the amplitude of individual pulsation modes can change significantly over time (e.g. Kilkenny et al. 1999; O’Toole et al. 2002). Furthermore, assessing the reality of marginal spectroscopic detections is much simpler if the same frequencies are also present in the photometry.
One advantage of spectroscopy of long-period PG 1716 variables is that they are more common than their short-period EC 14026 counterparts, and thus there exist more bright targets for future investigations if spectroscopically observed g-modes prove helpful for mode identification. A primary disadvantage is that their pulsational amplitudes are significantly smaller. The fact that typical PG 1716 pulsational periods are roughly a factor of thirty longer than the periods in EC 14026 stars is both a blessing and a curse. Periods of an hour or longer can be more easily sampled spectroscopically using smaller telescopes, but the effective time baseline and the number of telescope nights required for comparable frequency resolution must also be about thirty times larger. From the ground, multisite observations to reduce daily aliases are much more critical for the long-period sdB variables, since only 4–10 cycles can be observed per night from any one site.
With these factors in mind, we organized a spectroscopic collaboration between Steward Observatory (SO) in Arizona, the South African Astronomical Observatory (SAAO), and Siding Spring Observatory (SSO) in New South Wales, Australia, which would potentially allow nearly 24 hour coverage of PG 1627+017 with 2 m class telescopes. Ideally, we hoped to get as much overlapping time as possible during an approximately 7–10 day period in May, with additional nights at two and four week intervals before and after the joint time in May, to improve the time baseline. As will be seen in §4, the telescope allocation committees were as generous as we could have wished, but the weather was considerably less so. In the end, we were able to acquire (barely) sufficient data for a productive first look at g-modes in long-period sdB stars.
One additional point deserves consideration. In addition to RV variations, the relative pulsational amplitudes as a function of wavelength provide another way to constrain mode identifications. Theory predicts that pulsational amplitudes should be much greater at the central wavelengths of the Balmer lines than in the nearby continuum. O’Toole et al. (2003) found a significant increase in their line index flux for higher order Balmer lines in PG 1605+072. The continuum amplitudes also increase slowly from redder wavelengths to bluer ones, with a particularly rapid increase from blue to ultraviolet. The ratio of UV/red flux is a strong function of the degree index l (Randall et al. 2004, 2005a). To help investigate the amplitude dependence on wavelength in our PG 1627+017 data, we obtained a number of additional spectra for the similar but apparently nonvariable sdB, PG 1432+004, in order to calculate the atmospheric extinction correction with wavelength.
In the remainder of this paper, we describe our multisite time-series spectroscopy for PG 1627+017 and present the results. In §2 and §3, we discuss the observed characteristics of our target and the feasibility of detecting g-modes in this star. §4 and §5 describe the observations obtained at each site and the reduction methods. A description of the radial velocity cross-correlations and the derived orbital parameters is given in §6. We discuss the power spectrum of the residual velocities in §7, and consider the wavelength dependence of the pulsational amplitudes in §8. §9 contains the summary and conclusions.
2 PG 1627+017
PG 1627+017 (16h29m35s.3, +01°38′19″) is one of the brightest known long-period sdB pulsators. It is easily observed from both hemispheres, and as shown in Figure 1, the 0.03 mag amplitude variations are relatively large for its type. At V = 12.899 0.019 (Allard et al. 1994), it has essentially the same brightness as PG 1605+072, y = 12.914 0.072 (Wesemael et al. 1992).
PG 1627+017 is also one of the coolest sdB stars, and has one of the lowest surface gravities. Morales-Rueda et al. (2003) derived Teff = 21600, log g = 5.12, and log (N(He)/N(H)) = 2.9 using solar metallicity line-blanketed LTE atmospheres. We have obtained additional time-averaged, high signal-to-noise spectra as part of a continuing program to provide homogeneous atmospheric parameters of a large sample of sdB stars. We use the MMT Blue spectrograph to acquire medium resolution (1Å) spectra, and the Steward 2.3 m spectrograph for low resolution (8.7Å) spectra. We fit our two PG 1627+017 spectra to hydrogen and helium line blanketed NLTE atmospheres (Green, Fontaine, & Chayer, in preparation) to obtain 23669 190 K, log g = 5.315 0.021, log (N(He)/N(H)) = 2.968 0.029 from the MMT spectra, and 23987 257 K, log g = 5.250 0.034, log (N(He)/N(H)) = 2.901 0.105 from the Steward spectra.222The significant difference in our effective temperatures compared to Morales-Rueda et al.’s is due to the use of models with zero metals vs solar metallicity, neither of which adequately describes the diffusion-dominated outer layers of sdB stars. More realistic sdB temperatures will only be obtained using customized model atmospheres appropriate for each individual metallicity distribution, however, PG 1627+017’s relative position in the log g vs. Teff diagram remains the same regardless of which models are used. The cool temperature of PG 1627+017 is consistent with the longest observed quasi-periods (2h) yet found in any of the known long-period sdB pulsators, while the low gravity contributes to the relatively large pulsational amplitudes seen in Figure 1. Details of the photometric pulsation periods and amplitudes can be found in Randall et al. (2004; 2005b).
Finally, we note that PG 1627+017, like many sdB stars, is a post-common envelope binary. Morales-Rueda et al. (2003) derived an orbital period of 0.829226 day and an amplitude of 73.5 km s-1.
3 Feasibility
Radial velocity precision is obviously a crucial consideration for successful spectroscopic detection of the smaller g-mode amplitudes. We were encouraged by our previous success during the MSST campaign on PG 1605+072. Steward Observatory’s contribution to MSST was 1.8Å resolution spectra obtained during six clear contiguous nights on the 2.3 m Bok telescope on Kitt Peak. Due to a combination of observing technique and data reduction methods, the noise in the RV power spectrum for PG 1605+072 from the single-site Bok data was well under 1 km s-1, lower by almost a factor of two (Green et al., in preparation), than was achieved by O’Toole et al. (2002). With a much longer time baseline for PG 1627+017, we expected to be able to detect any g-modes having amplitudes greater than 1 km s-1.
As noted above, PG 1627+017 has the same brightness as PG 1605+072. For the latter, exposures with the 2.3 m spectrograph were held to 45 s in order to adequately sample the main 365–530 s periods. With the same telescope and instrument setup, 200 s integrations for PG 1627+017 would allow a factor of two improvement in both the signal-to-noise (S/N) and the velocity errors, yet the pulsational periods would be sampled 3–4 times better. All else being equal, the increased exposures and improved sampling should largely compensate for the factor of six reduction in the observed photometric amplitudes of PG 1627+017 relative to PG 1605+072, given a suitably longer time baseline.
Unfortunately, this is not the whole story. All previous spectroscopic mode detections in sdB pulsators were found in p-mode pulsators, and it was not clear what to expect for g-modes. The problem with linear pulsation theory is that, precisely, it is linear and thus no information is provided about amplitudes of modes. Only nonlinear theory is able, in principle, to provide information on the expected amplitudes, but, in practice, the usefulness of nonlinear theory is quite limited.
While the motions in p-mode pulsators are predominantly in the radial direction, they are in the horizontal direction for g-mode pulsators. Linear theory does not provide estimates of amplitudes per se, but it gives a formula to estimate the ratio of the horizontal to radial velocity amplitudes (see, e.g., equation 7.3 of Unno et al. 1979). As applied to the dominant 480 s mode in PG 1605+072, this formula indicates that the ratio of radial to horizontal velocities is about 17:1. If we now consider a long period g-mode in PG 1627+017, say 7000 s, this ratio goes down to 1:15. However, this does not mean that we should scale the expected velocity excursions by these amounts, and conclude that velocity variations will not be seen in PG 1627+017. Indeed, one can hope to pick up the “horizontal” motions near the limb, which would translate into radial velocity variations. This is precisely what has been done by van Kerkwijk, Clemens, & Wu (2000) and Thompson et al. (2003), who obtained time-resolved spectroscopy of G29–38, a pulsating (g-mode) ZZ Ceti star. Against perhaps naive expectations, they were able to measure velocity variations of several km s-1 associated with g-mode motions. Furthermore, they succeeded with a white dwarf, where the expected ratio of radial-to-horizontal velocities is more like 1:250.
4 Observations
We were allocated 40 nights for time-series spectroscopy of PG 1627+017: 24 nights on the SO 2.3 m Bok telescope (March–July), a week on the SAAO 1.9 m telescope in May, and 9 nights on the SSO 2.3 m telescope, also in May. The SAAO and the SSO sites were badly affected by winter clouds on a majority of their nights. Much more unexpectedly, half of the SO nights were also clouded out, and several other nights were affected by significant cirrus. In addition, the June SO nights suffered a noticeable drop in atmospheric transparency due to smoke from nearby wildfires. Tables 1 and 2 list the details for all scheduled nights on each separate telescope. 104 hours of observations from 21 usable telescope nights resulted in 1473 spectra between mid-March and early June.
A paramount consideration for a multisite campaign is the accuracy of the UT time in the image headers from different observatories. The time systems at all sites were considered to be accurate to within one second, thus the main uncertainty was whether or not there was any significant delay between the UT time stamp and the actual moment the shutter opened.
4.1 Steward Observatory (SO)
The Boller & Chivens Cassegrain spectrograph at Steward’s 2.3 m Bok telescope was used with an 832/mm grating in second order and a 1 mm Schott 8612 blocking filter. In this instrumental configuration, the dispersion is 0.7Å/pixel over a wavelength range of 3755–4595Å, giving a spectral resolution of 1.8Å (R = 2315) with a 1.5′′ slit. The 1200x800 pixel Loral/Fairchild/Imaging Systems CCD was thinned, packaged, and backside treated by the Steward Observatory CCD Laboratory for enhanced blue response (80% at 3700Å, 95% at 4000Å). The CCD gain and readnoise are 2.1 e-/ADU and 5.5 e-, respectively. We used on-chip binning of 3 pixels in the spatial direction, and further windowed the CCD to 1200x135 pixels to reduce the overhead time between spectra to 12 s. The time stamp comes from a GPS server at the telescope, and is accurate to within a few milliseconds. We conducted extensive engineering tests to determine the time lag correction between the ccd shutter and the UT time stamp in the image header and verify its repeatability (to within 0.2 s). We also determined that there was no detectable flexure in the wavelength direction for hour angles up to 5 hours at constant declination.
Spectra of PG 1627+017 were usually taken in approximately hour-long sets of sixteen 200 s exposures, with 60 s HeAr calibration arcs before and after. Prior to each set, we rotated our slit so that it would be at the parallactic angle at the midpoint of the set, to minimize light loss due to atmospheric dispersion. At the same time, we also adjusted the collimator focus, which varies with dome temperature, to maintain the same FWHM of the arc lines throughout the night. During program exposures, we hand-guided the star on the slit, since we felt that the autoguider in use at the time was unable to maintain sufficient centering for uniform illumination of the slit, possibly leading to systematic velocity effects.
During the April and June runs (especially the latter, because of smoke from wildfires), we often used shorter sets for PG 1627+017, alternating with exposures of a nearby constant luminosity sdB, PG 1432+004, in order to measure the atmospheric extinction. PG 1432+004 was observed over the same or a slightly larger range of airmass than our target star.
4.2 South African Astronomical Observatory (SAAO)
We used the 74′′ (1.9 m) Cassegrain spectrograph with a 1200/mm grating in first order. Spectra were projected onto a SITe CCD that was prebinned by 2 pixels in the spatial direction, and windowed to 1792x256 pixels. The gain and readnoise are 0.9 e-/ADU and 5.94 e-, respectively. The time lag between the UT time stamp and the shutter opening is less than a few milliseconds for this system. With a dispersion of 0.5Å/pixel and a 1.5′′ slit, we obtained a spectral resolution of 1.0Å over the selected wavelength range 3680–4490Å. Spectra were taken sequentially in frame transfer mode, with 600 s integrations per image bounded by 60 s CuAr arcs.
The SAAO observations were the only ones not observed at the parallactic angle, since the spectrograph slit is aligned east-west and not easily rotated. Without an atmospheric dispersion compensator, it was considerably more difficult to center the blue image on the slit using only a red acquisition TV and guider.
4.3 Siding Spring Observatory (SSO)
The Double beam spectrograph (DBS) with a 1200/mm grating in second order was used with a 1752x532 SITe CCD, binned 1x4 and windowed to 1752x113 pixels. Only the blue spectra were used in the following analysis. The gain and readnoise are 1 e-/ADU and 6 e-, respectively. The time stamp accurately reflects the shutter opening time. The 0.5Å/pixel dispersion and 2′′ slit gave a spectral resolution of 1.0Å over the useful wavelength range of 3680–4444Å. The SSO 2.3 m telescope has an alt-az mount, and therefore the slit was always aligned at the parallactic angle.
The DBS and the CCD imager were mounted on opposite sides at the f/18 Nasmyth focus, allowing a quick switch between spectroscopy and photometry according to weather conditions. Spectra were taken when conditions were too poor to obtain photometry relative to reference stars in the same image, although that turned out to include the majority of the available observing time for PG 1627+017. The spectroscopic exposure times were adjusted to obtain a satisfactory S/N ratio, averaging about 200 s, and the images were bounded by 60 s TiAr arcs.
5 Reductions
The spectra were bias subtracted, flat-fielded, and cleaned of cosmic rays in the standard manner. All subsequent data reduction was done with IRAF333The Image Reduction and Analysis Facility, a general purpose software package for astronomical data, is written and supported by the IRAF programming group of the National Optical Astronomy Observatories (NOAO) in Tucson, AZ. tasks at Steward, including background removal and extraction to the one dimensional spectra, in order to have complete homogeneity between all of the different data sets. The calibration arc identification and wavelength dispersion corrections were done with the IRAF onedspec package. We used an appropriate combination of each observatory’s line lists, the IRAF package datafiles idhenear.dat and cuar.dat, and the MIT Wavelength Tables (Phelps 1982), to find an accurate wavelength for every identifiable unblended line in the spectrum that was sufficiently above the noise threshold. The one dimensional spectra from each observatory were calibrated using exactly the same set of arc lines for every spectrum. The dispersion solutions were determined by linear interpolation between the preceding and following arc exposures according to the UT times at mid-exposure. The wavelength-corrected spectra were then resampled onto a logarithmic wavelength scale, in preparation for the RV cross-correlations. The continuum was removed by fitting a cubic spline, dividing by the fit, and subtracting 1.0 to get a mean continuum level of zero.
We calculated the S/N per pixel for each spectrum, including CCD readnoise as well as photon statistics errors from the star and sky. A number of spectra from each observatory turned out to have very low S/N, due to clouds. For the following analysis, we discarded all those with S/N 10. This left 1161 SO spectra with a median S/N = 39, 184 SAAO spectra with a median S/N = 24, and 128 SSO spectra with a median S/N = 18.
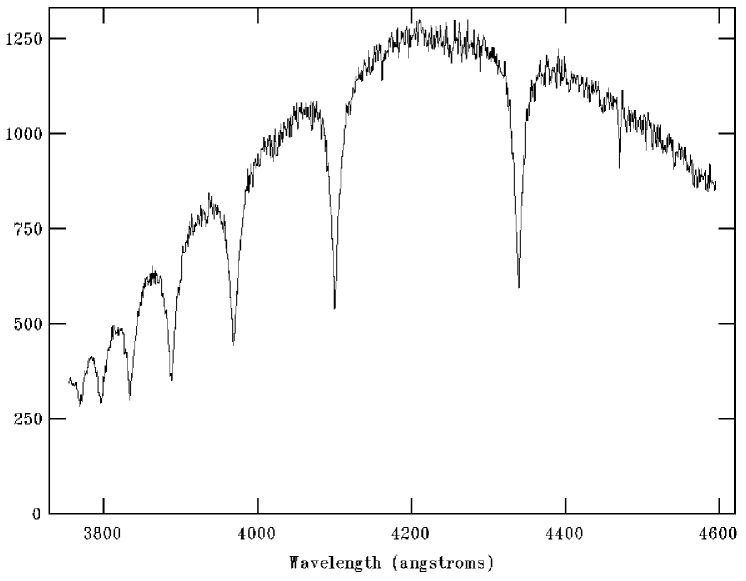
The PG 1627+017 spectrum in Figure 2 shows the characteristic sdB Balmer lines. The 4471Å and 4026Å He I lines are much less obvious, and most of the metal lines appear lost in the noise. Nevertheless, we note that both helium and metal lines add considerable power to the cross-correlations, even for the lower resolution SO data. Weak lines are more important still for the SAAO and SSO data, where the higher resolution must compensate for lower S/N.
6 Radial Velocities and Orbital System Parameters
6.1 Measurements and Errors
Radial velocities were derived using the double precision version of the IRAF task fxcor444Available at http://iraf.noao.edu/scripts/extern/rvx.pl, which cross-correlates object spectra against a template spectrum. Our experience has been that higher precision RV’s are obtained from fxcor if the spectra and templates are all identically resampled onto a log scale and continuum subtracted prior to the cross-correlation, rather than within the fxcor task itself. Separate templates for each night were constructed by combining a large number of the higher S/N spectra for that night. The higher the S/N of the template, and the more closely its spectrum matches the object spectra, the better the cross-correlation velocities will be. For the most precise relative velocities, a high S/N template of the star itself, taken with the same instrumental setup, is preferable to a theoretical template or to a high S/N template of a different star, because the pattern of weak helium and metal lines varies so widely from one sdB star to another.
The Fourier filter parameters were chosen such that only narrow lines and the sharp cores of the Balmer lines would contribute to the cross-correlation. Although the wide profiles of the hydrogen lines visually dominate the spectra, the extra power gained by including their wings in the cross-correlation does not seem to translate into increased accuracy, presumably because the cross-correlation peak is so much wider. Our preferred filter parameters for the SO data were derived from a number of trial-and-error tests using spectra of constant velocity sdB stars (obtained during previous observing runs with the same instrumental configuration). Best results were obtained using a ramp filter with values for IRAF’s fxcor wavenumber parameters, cuton and fullon, corresponding to approximately the Balmer line FWHM and half of that FWHM, respectively. The optimum values for the fxcor cutoff and fulloff parameters were nearly equal, corresponding to a pixel value somewhat smaller than the instrumental resolution, as measured by the FWHM of the arc lines. The optimal parameters for the SAAO and SSO spectra were determined in a similar manner. We fit the cross-correlation peaks with a gaussian function, since this results in higher precision than the other available options (parabola, center1d, etc). (We note that while the single precision fxcor gaussian fitting routine sometimes fails to find a good solution, the double precision version always works well.) The Ca II K line region near 3933Å was excluded from the cross-correlation, to avoid potential interstellar contamination and/or imperfect background sky subtraction (most of the spectra were taken near full moon).
The final velocities were derived with an iterative procedure. We constructed rough templates by median filtering the higher S/N spectra for each night, weighted by the number of counts in each spectrum prior to continuum subtraction. The individual spectra were cross-correlated against this initial template. An improved template was then constructed, after Doppler-shifting to remove the derived velocities. Pixellation was not an issue, since the star’s orbital velocity shifted the lines over multiple pixels. A few iterations were sufficient for convergence. Finally, we determined the night-to-night zero point differences, separately for each observatory, by cross-correlating the final velocity templates from each night against each other.
The IRAF fxcor routine outputs velocities and velocity errors. It is important to note that fxcor’s errors are correct only to within a scaling factor, which depends on the number of counts in the spectra and the Fourier filter parameters used. Armandroff, Olszewksi, & Pryor (1995) outlined a procedure using Monte Carlo simulations covering the entire range of S/N in the data to determine the appropriate scaling factors needed to derive the formal errors. While this procedure is invaluable for investigations involving many different stars, it is extremely time consuming and, by its nature, only addresses the internal errors, not any systematic errors. We chose instead to use the observed scatter of the PG 1627+017 velocities to estimate the actual errors, as described in the following sections.
6.2 Orbital Parameters
In order to search for pulsational velocity variations in a star that is a member of a binary, the orbital velocity must first be subtracted. We began with the assumption of a circular orbit, as usual with post-common envelope binaries. We used five sets of velocities observed over a 7.5 year time interval to derive the orbital solution: the three sets of SO, SAAO, and SSO (2003) velocities discussed above, Morales-Rueda et al.’s (2003) velocities from data taken in 2000–2001, and the velocities listed in Table 3, derived from 1Å resolution MMT spectra going back to 1996. The MMT velocities are part of another ongoing program to study the binary properties of a representative sample of sdB stars (Green et al. 2004); the zero point of the MMT velocities is known to be within 2–3 km s-1 of the standard IAU radial velocity system. Since the SO, SAAO, and SSO cross-correlations provided only relative velocities, a separate zero point term for each set of velocity data was included in the solution, to ensure that all the data were on the velocity system defined by the MMT data.
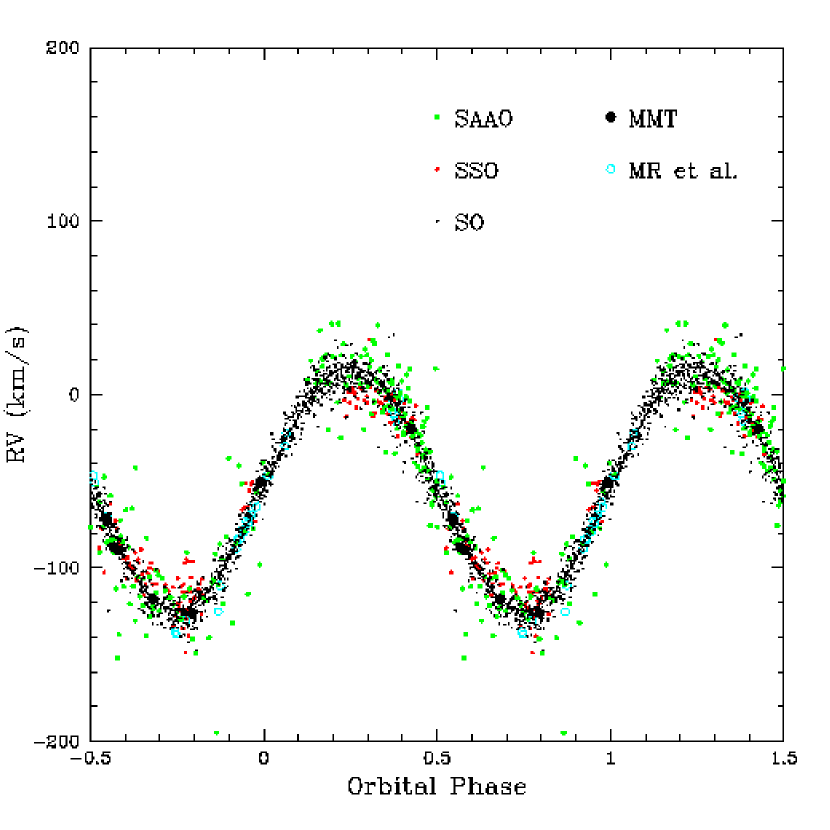
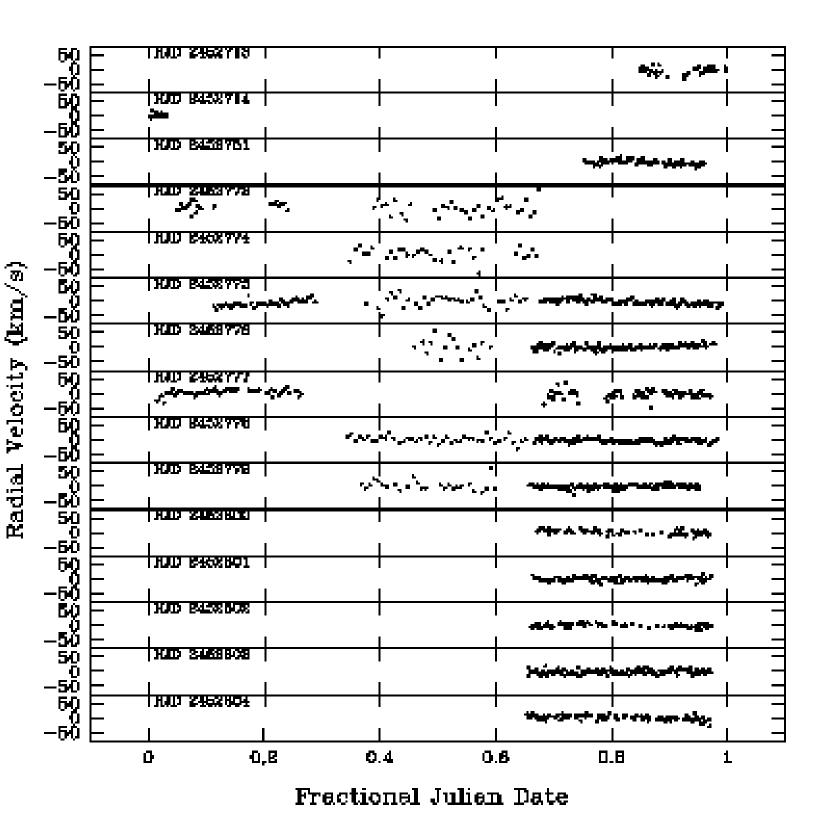
The period search algorithm that we employed uses the Singular Value Decomposition (SVD) method (Press et al. 1992) to minimize the goodness-of-fit parameter for various sine curves over a range of periods. The orbital solution requires an appropriate weight for each velocity, which is normally the inverse square of its error. Without knowing the SO, SAAO, and SSO error scale factors at the start, we used an iterative procedure to determine the orbital parameters. We derived an initial solution by fitting a sine curve to the Morales-Rueda et al. and MMT velocities only, for which the errors were already known. We then subtracted the orbital velocity contribution from the SO, SAAO, and SSO velocities, and used the standard deviation of the velocity residuals as a first estimate of the mean error for that site. The ratio of the estimated error to the average fxcor error provided the necessary error scaling factor. The advantage of this procedure is that it takes into account both internal and systematic errors. We rederived our orbital solution using all five sets of weighted velocities, and then recalculated the standard deviations of the SO, SAAO, and SSO velocity residuals to find an improved scale factor. The resulting periodogram gives a best fit orbital period of 0.8292056 0.0000014 days. The derived sinusoidal orbital velocity curve is plotted in Figure 3 together with all of the observed velocities, folded with the orbital period. The velocity residuals for each individual night, after subtracting the orbital motion, are shown in Figure 4.
Inspection of figures 3 and 4 reveals some problems that merit further discussion. First, the SAAO data (green dots) are disappointingly noisy, and second, systematic trends with time in the SSO data (red dots) apparently conspired to suggest a smaller orbital velocity amplitude than is indicated by any of the other velocity data. Fortunately for the orbital parameters, it turns out that neither the SAAO nor the SSO data set had a measurable effect on the solution. This is partly due to the error scaling procedure described above, which resulted in very small weights for those spectra. The typical (median) errors derived using the velocity scatter about the theoretical curve were 6.6 km s-1, 16 km s-1, and 24 km s-1 for the SO, SAAO, and SSO velocities, respectively. In any case, there were so few spectra from either of those two sites relative to the large number of contemporary SO spectra, that the orbital solution would have been negligibly affected with any acceptable choice of error scaling parameter. We will return to the question of the appropriate errors and the weighting in the following section.
The derived parameters for PG 1627+017 are listed in Table 4. The ephemeris for time T0, defined to be the time when the sdB star is at inferior conjunction, is
HJD(T0) = (2 452 804.7723 0.0034) + (0.8292056 0.0000014) E
6.3 Nature of the Unseen Companion
The times of superior conjunction (orbital phase = 0.5), combined with the photometric light curves, are sufficient to show that PG 1627+017 is not an eclipsing system. The stellar radius and rotational velocity given in Table 4 assume a typical sdB mass of 0.49 and tidally locked components. The 2MASS JHK colors, JH = 0.107 and JK = 0.068, do not permit a main sequence secondary with a mass greater than 0.4–0.5 (Green et al. 2005). The orbital period and derived mass of the unseen companion, M2 0.257 0.011 , suggest that the secondary is a white dwarf, especially since there are no known sdB + dM binaries with periods longer than 0.33 days and minimum secondary masses greater than 0.2. Additionally, we know that a main sequence companion with M2 0.25 in an orbit shorter than one day should produce a small but observable reflection effect (Maxted et al. 2002). The pulsational brightness variations in PG 1627+017 would almost certainly overwhelm a small reflection effect for any visual inspection, but the reflection should be clearly detectable as a 0.83 day (13.96 Hz) periodicity in a photometric power spectrum. Randall et al. (2005b) did not note such a periodicity in the results of their seven week photometry campaign, primarily because their flattening procedure to correct for differential atmospheric extinction removed nearly all power at frequencies longer than 0.1 Hz. We can now report that a reexamination of the power spectrum using Randall et al.’s unflattened PG 1627+017 light curves reveals no evidence for any peak near 13.96 Hz, even probing well below the minimum 3 noise threshold. Since there is no reflection effect, we conclude that the secondary companion in PG 1627+017 is indeed a white dwarf.
7 Time-Series Analysis
Since the quality of our velocities varies considerably between different sites, from night to night, and even within nights at a single site, it was necessary to use a weighted Fourier Transform technique, such as described in Kjeldsen & Frandsen (1992). This requires revisiting the error scaling. Weighting by the previously derived errors effectively reduces the contribution of the SSO and SAAO velocities to almost zero, which negates any advantage that might be obtained from more complete longitude coverage. Although the scaled errors for the SAAO data are not too unreasonable, in view of the velocity scatter in both Figures 3 and 4, the very large systematic errors in the SSO velocities (the red dots in Figure 3) are not appropriate weighting factors for investigating velocity variations on time scales shorter than one night. The SSO scatter about their nightly trends in Figure 4 is nearly as good as the scatter in the SO data. Therefore, we used an alternate method of error scaling for the input to the Fourier transform, in which we detrended the data in Figure 4 by subtracting a linear fit from each night’s light curve, prior to determining the standard deviations. In other words, the mean errors now correspond to the scatter about the nightly trend. With this scheme, the median scaled errors for the SO, SAAO, and SSO data sets are 5.2 km s-1, 9.5 km s-1, and 6.2 km s-1.
As mentioned earlier, complete longitude coverage is particularly valuable for long-period sdB variables, to reduce aliasing. However, using all the data listed in Table 1 resulted in a rather noisy power spectrum, so we experimented with a number of different subsets of the data. After trying numerous combinations, we concluded that the best longitude coverage with the lowest noise was obtained from the subset comprised of the last two SSO nights, the last two SAAO nights plus two short sections of the second (HJD between 774.4 and 774.52) and third SAAO nights (775.48 to 775.56), and all of the SO data except the first March night and the first quarter of the fifth SO night.
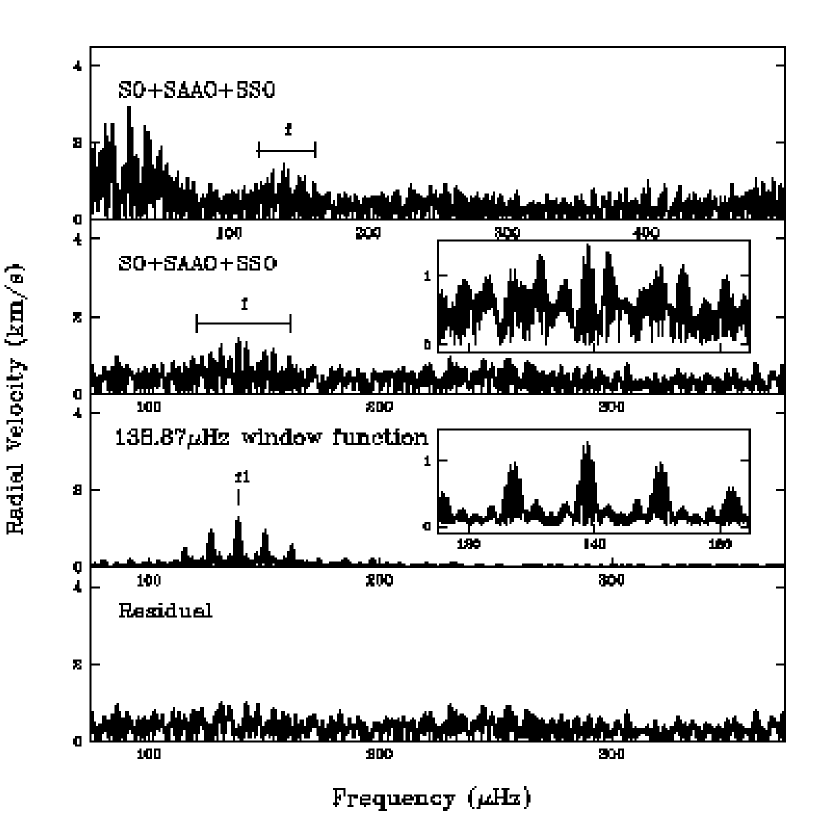
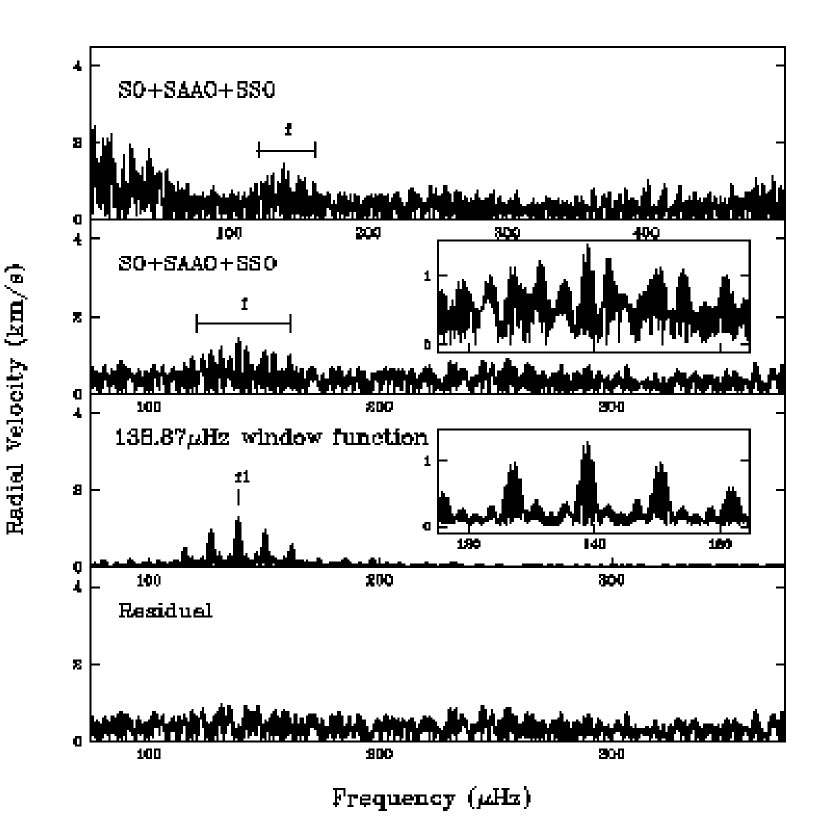
Figure 5 shows the amplitude spectrum for the best data set, which is comprised of 1285 spectra representing 84 hours of spectroscopy over a 53 day time period. (Note that any uncertainties due to the already low duty cycle of 6.6% must be exacerbated by the nonuniform distribution of the observations in both longitude and time.) The top panel shows several weaker peaks near the middle, representing excess power in the frequency range between 120 and 160 Hz, as well as a few stronger peaks at very low frequencies (discussed below). By design, we obtained our spectroscopic observations during the same April–June 2003 time period covered by Randall et al.’s (2004, 2005b) photometric campaign on PG 1627+017. The midrange peaks in Figure 5 fall in the same 120 to 170 Hz range as the strongest of the photometric pulsation modes, the first indication that our data have reached the level where g-modes can be spectroscopically detected in this star. There is no further structure to be found at frequencies above 375 Hz as shown in the top panel of Figure 5.
The second panel in Figure 5 is a slightly expanded view of the top panel, without the low frequencies. The window function for one of the peaks is plotted in the third panel, with insets showing the details of the excess power structure. The bottom panel shows the result of pre-whitening (e.g. Billères et al. 2000) by the strongest peak (f1) at 138.87 Hz. In the pre-whitening procedure, the full Fourier Transform of the lightcurve was calculated, and a peak-finding algorithm was used to determine the frequencies of the peaks rising above a specified threshold in the Fourier domain, assumed to be three times the mean level of the background noise. The frequency of the highest amplitude peak was used as a fixed parameter in a nonlinear least-squares fitting procedure to find the corresponding amplitude and phase that best fit the lightcurve. The sine-wave generated for that frequency, amplitude, and phase was subtracted from the lightcurve, removing the strongest peak as well as any associated sidelobes. The FT was then recalculated. If any other peaks had still remained above the chosen noise threshold, the procedure would have been repeated to remove the next strongest frequency, and so on, until no more significant peaks were left. In our case, a single iteration suffices, because only one peak appears to be significant. We will return to this point following a brief discussion of the low frequencies.
When calculating the Fourier transform (FT), it is important to start with a lower frequency limit of zero. Otherwise, if there is real power at very low frequencies that isn’t properly subtracted, the corresponding sidelobes at higher frequencies might affect the subsequent analysis. Typically, the lowest frequency peaks are simply assumed to result from longterm instrumental drifts, and often they can be simply ignored. Instrumental drifts do occur in our data, as seen in Figure 4, but they are not responsible for the strongest low frequency effect in the top panel of Figure 5. The central peak of the most obvious low frequency window function pattern turns out to be 27.910 Hz, exactly half of the orbital period (27.916 Hz), to within the errors. The reality of this peak, and its frequency, are indisputable, as they were derived and corroborated in three independent analyses.
Edelmann et al. (2005) find similar radial velocity distortions in at least three, and possibly five, other sdB stars, which they conclude must be evidence for slightly elliptical orbits. Short-period sdB binary systems like these are considered to be the result of mass transfer followed by common envelope ejection. Even small residual eccentricities would be quite surprising, as it is widely expected that the components will emerge from the common envelope phase with completely circularized orbits (e.g. Terman, Taam & Hernquist 1994; also Taam, personal communication). A theoretically more palatable possibility would be another light source within the binary (e.g. the unseen companion or its heated face) whose changing Balmer absorption line spectrum, as seen by an earth observer, might distort the radial velocity curve from being purely sinusoidal. However, as noted above, no contribution at this frequency is detected in Randall et al.’s simultaneous photometry, down to a small fraction of a percent, and the photometry is considerably more sensitive than our spectroscopy. Furthermore, we were unable to reconcile the phases of the half-orbital term and the orbital ephemeris with what would be expected from any type of light variation mechanism around the orbit. More work is clearly needed to clarify this problem.
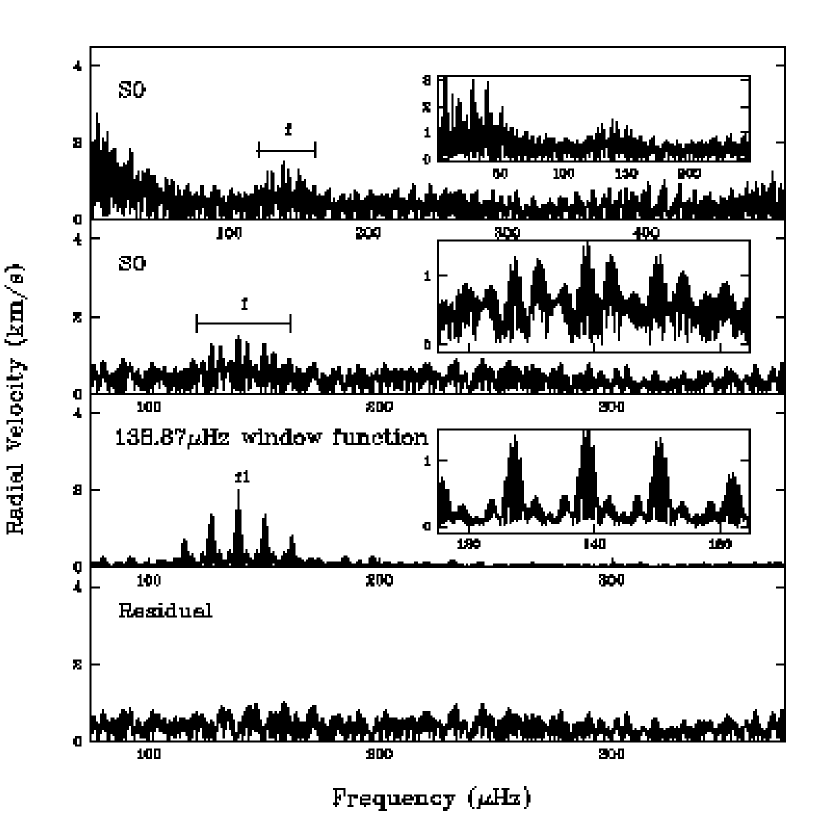
Regardless of the underlying mechanism, including in our orbital solution a small harmonic term with twice the orbital frequency removed the majority of the low frequency structure (Figure 6), without detectably altering the frequency or amplitude of the main higher frequency peaks. The remaining very low frequency peaks can be reasonably attributed to the observed instrumental drifts, as seen in Figure 4, and their removal does not affect the 120–160 Hz frequencies either.
The highest peak in the pulsational range in Figure 6 (top two panels) is the one at 7201.0 s (138.87 Hz). Its amplitude, 1.44 km s-1, is almost 4 above the mean noise level of 0.365 km s-1. As stated earlier, prewhitening by this frequency leaves no other significant peaks above the noise level. However, at the same time that our peak-finding algorithm located the 138.87 Hz peak, it also found two other nearby peaks with only slightly weaker amplitudes, about 1.23 km s-1, at frequencies of 7014.6 s (142.56 Hz) and 7037.3 s (142.10 Hz). The amplitudes are sufficiently comparable that we cannot be sure which of the three peaks is the truly significant one. It could well be the one with the formally highest amplitude, or it might be one of the others. Separate trials showed that pre-whitening by either of the other two frequencies was also sufficient to reduce all the other peaks below the 3 noise level. To assess the possibility that peaks of these amplitudes might occur by chance, we calculated the false alarm probability (Scargle 1982; Horne Baliunas 1986). Using the observed noise level of 0.365 km s-1, there is a 94% chance that the strongest peak is real, or about a 74% chance for either of the two weaker peaks. Therefore, it seems highly probable that we have detected at least one real periodicity, although the data are too ambiguous to specify with any certainty which one it is.
The amplitudes of the three peaks vary somewhat if we use different sets of input nights or different weighting, although the 7201 s peak is always the strongest. The three possible peaks are robust in the sense that they always show up at the same periodicities, to within a fraction of a second, for most combinations of input velocity data that we tried, as long as the last two nights of SSO data are included and assigned non-negligible weights. Unfortunately, there is little difference even when we discard the SAAO and SSO nights entirely, which means that our campaign gained relatively little advantage from the additional longitude coverage. Using only the SO data with a low frequency (“elliptical”) term included in the subtracted orbital solution (Figure 7), the sidelobes in the window function are a little stronger, marginally higher peaks are found at 7200.5 s and 7013.1 s, although the 7037 s peak is no longer distinguishable, and the noise is slightly increased to 0.374 km s-1.
It is instructive to compare the frequencies of the photometric and spectroscopic detections. Randall et al.’s (2004, 2005b) photometric analysis uncovered a fairly rich pulsational amplitude spectrum with the strongest peak (amplitude 0.49%) at 6630 s (150.83 Hz), and the next two strongest peaks at 6664 s (150.06 Hz) and 7035 s (142.15 Hz) (amplitudes 0.39% and 0.38%, respectively). The one day alias of our 7201 s peak is 6646 s (150.48 Hz), which happens to lie halfway between the two strongest and closest photometric peaks. Furthermore, the other two potential detections at 7014 s (142.56 Hz) and 7037 s (142.10 Hz) are comparably close to the next strongest photometric peak in the photometry. Could the 7201 s spectroscopic peak be an undistinguished blend, and are the spectroscopic uncertainties large enough to identify our peaks with the photometric detections? The frequencies derived from the Fourier transform have no formal error estimates attached to them, but Kjeldsen’s (2003) eqn. 3, = 0.44 * 1/SNR * 1/T, together with our peak SNR of about 3.9, gives an error that is about 1/10 of the time resolution. The nominal spectroscopic time baseline of 53 days would therefore suggest a very tiny error of only 0.02 Hz. However, Kjeldsen’s equation does not include the uncertainty from beating between closely spaced modes in the star or the effect of the window function, which is demonstrably very complex (as seen in the third panel insets in Figures 5, 6, and 7) due to our extremely low duty cycle.
In any case, the likelihood that all of the three possible spectroscopic peaks should correspond so closely with the three strongest photometric peaks purely by chance is very remote. It seems obvious that we have recovered one or more of the photometric modes, considerably strengthening the argument for a spectroscopic detection of g-mode pulsation in this star.
8 Amplitude Variations as a Function of Wavelength
Theory predicts that luminosity variations in sdB stars should be wavelength dependent, with the largest amplitudes at the positions of the Balmer lines and at bluer continuum wavelengths, especially toward the ultraviolet (see, e.g., Randall et al. 2005a). Although we suspected that our modest wavelength range (3755–4595Å) would be too small to show much of a continuum effect, we nevertheless acquired spectra for the nearby, apparently constant luminosity sdB star, PG 1432+004, in order to correct for atmospheric extinction as a function of wavelength. PG 1432+004 (14h35m19s.8, +00°13′52″) was observed only at the Steward Observatory 2.3 m telescope, in April and again in June when the extinction was problematic due to smoke from fires. PG 1432+004 rises and sets two hours ahead of PG 1627+017, and has very nearly the same brightness (V = 12.75) and declination, which made it very easy to observe between sets of PG 1627+017 observations.
To calculate the extinction, we divided the PG 1432+004 spectra into 63 wavelength bins. We normalized each spectrum by the counts at 4485–4585Å, summed the counts in each wavelength bin, and fit a straight line as a function of wavelength. The extinction corrections were applied to the normalized PG 1627+017 spectra, which were then shifted to the rest wavelength before determining the counts in their wavelength bins.
We computed power spectra for the bluest continuum region that could be well measured ( 3950Å), but as expected, the wavelength difference between that point and the reference wavelength at the red end of the spectrum was far too small to distinguish any pulsational effects.
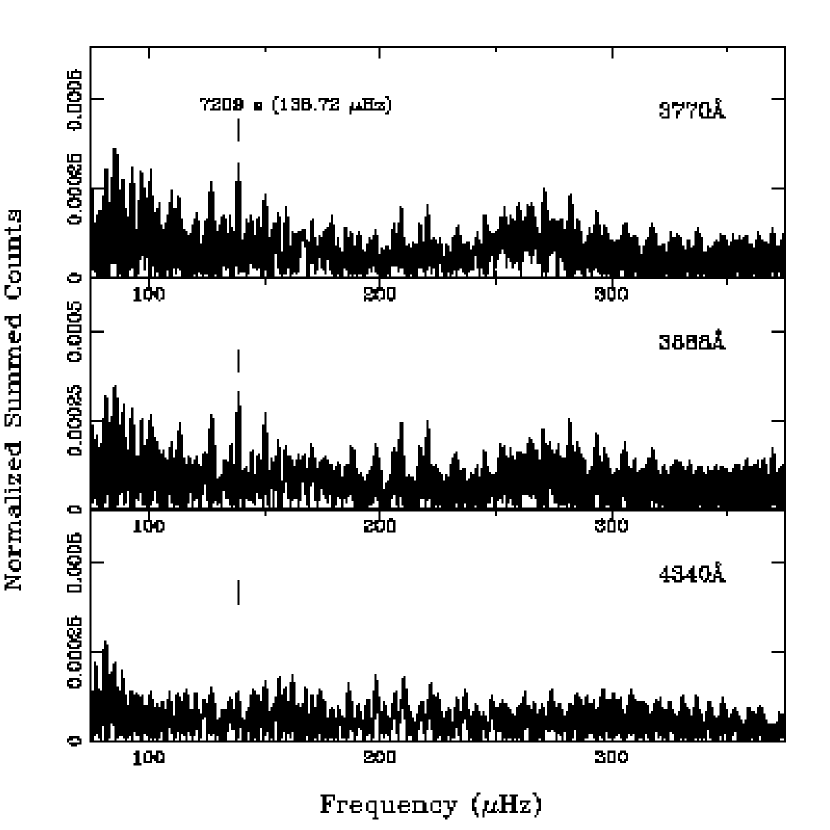
On the other hand, the higher order Balmer lines did exhibit noticeable amplitude variations, that were weak or absent in H and H (the longest wavelength Balmer lines in the spectra). Figure 8 shows the FT’s for three representative Balmer lines, H11 (top), H8 (center), and H (bottom). Unfortunately, only one frequency corresponding to 7209 s (138.7 Hz) could be convincingly detected above the noise in any of the amplitude power spectra. (Two lower peaks, most easily seen in the central panel, slightly more than 10 Hz to either side of the 7209 s peak, are sidelobes.)
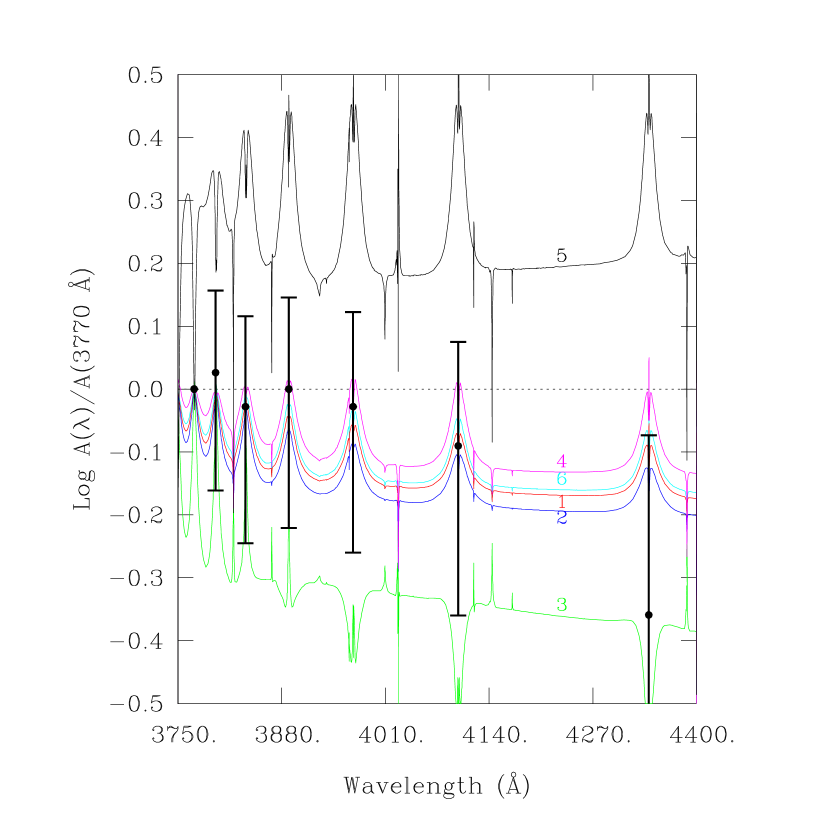
While the observed amplitudes are not known to sufficient accuracy to allow the determination of the index for the 7209 s mode, it is still interesting to investigate if, at least, some constraints could not be derived. Randall et al. (2005a) have recently adapted the theory of multicolor photometry to pulsating sdB stars, including detailed nonadiabatic effects in the atmospheric layers. Following that paper, we computed the expected relative amplitudes of a 7209 s g-mode for a model of PG 1627+017 using the atmospheric parameters listed in Table 4. Our results are presented in Figure 9 which shows the expected monochromatic amplitude of the 7209 s mode relative to that of the core of the H11 line at 3770Å for different assumed values of the degree index . The points with error bars are our measured line core amplitudes with respect to the amplitude of the H11 line. Not unexpectedly, the uncertainties on the amplitude ratios are so large that we cannot discriminate between values of = 1, 2, 4, or 6. Interestingly, however, our data are good enough to rule out the possibility that the 7209 s mode has a value of = 3 or = 5.
9 Summary and Conclusions
We were allocated 40 nights during March–July 2003 on 2 m class telescopes in Arizona, South Africa, and Australia to attempt the first spectroscopic detection of gravity modes in a long-period (g-mode) sdB pulsator. Our equatorial target, PG 1627+017, is one of the brightest PG 1716 variables, with moderately large amplitudes for its type. Previous photometry suggested pulsational periods of the order of 1–2 hours and amplitudes 1%. For ground-based observations, minimum time baselines of many weeks are required to adequately resolve the modes, as well as good longitude coverage to eliminate aliasing. Order-of-magnitude calculations suggested that we would need a detection limit 1 km s-1 and a velocity precision about 4–5 km s-1, to set useful upper limits on possible g-mode amplitudes. Ideally, we wanted to obtain time-series spectroscopy on 2 m class telescopes for a week of overlapping nights at all three observatories during the middle of the corresponding photometric campaign, plus additional blocks of 4–5 nights at a time at Steward Observatory, every few weeks for at least a month or so before and after the main effort. Although such spotty coverage can’t provide very good resolution, it took a huge effort merely to obtain this much 2 m telescope time and carry out the observations. It would be extremely difficult to get a higher duty cycle without dedicated telescopes. Unfortunately, bad weather limited the number of our useful nights to a bare minimum of 18: a total of 11 nearly overlapping May nights from the three sites, plus one additional April night and five June nights in Arizona.
The final velocity data set included 84 hours of time-series spectroscopy over a formal time baseline of 53 days. We combined our new velocities for PG 1627+017 with published velocities from Morales-Ruelas et al. (2003), and with newly reported MMT velocities (Table 3), to derive improved orbital parameters (Table 4).
Surprisingly, the radial velocity power spectrum shows a significant peak at 27.910 Hz, which, to within the errors, is exactly half of the orbital period (27.916 Hz), corroborating Edelmann et al.’s (2005) discovery of similar small velocity distortions in several other short-period sdB stars. Edelmann et al. conclude that slightly elliptical orbits are the only possible explanation. We are not completely convinced that this is the case, but we could not find any alternative explanations. The simultaneous photometry and spectroscopy campaigns for PG 1627+017 constrain the possibilities even more tightly, because the mechanism responsible for the half-orbital velocity term produced no detectable brightness variations.
In spite of an overall efficiency of only 6.6% and a somewhat higher detection limit than we had hoped, we appear to have reached the level where g-modes can be observed in a sdB star. The power spectrum of the residual velocities, after subtracting the orbital motion, shows excess power in the same 120–170 Hz frequency range as the observed photometric pulsations. Three peaks are found at 7201.0 s (138.87 Hz), 7014.6 s (142.56 Hz) and 7037.3 s (142.10 Hz), with amplitudes that are 3–4 above the mean noise level of 0.365 km s-1. At least one of the peaks is likely to be real based on noise statistics alone, but all three are good candidates because each one is tantalizingly close to, or a one day alias of, one of the three strongest photometric peaks found by Randall et al. (2004, 2005b). As this is most unlikely to happen by chance, we conclude that we have indeed detected g-mode pulsations in PG 1627+017 at the 1.0–1.5 km s-1 level. This indicates that the strongest velocity mode in this cool, low gravity, g-mode pulsator, relative to its 0.03 mag photometric variations, is only about a factor of two weaker than the strongest velocity mode (14 km s-1) observed in the correspondingly cool, low gravity p-mode pulsator, PG 1605+072, relative to its 0.2 mag photometric variations.
We further attempted to detect pulsational variations in the Balmer line amplitudes. The higher order Balmer lines, in particular, showed evidence for amplitude variations with a periodicity of 7209 s, once again quite close to the dominant photometric frequencies. The trend of the pulsational amplitudes with wavelength is consistent with with theoretical expectations, and we were able to rule out the = 3 and = 5 possibilities for that mode.
We conclude that spectroscopic detection of gravity modes in sdB stars is (just) within the realm of possibility for the strongest PG 1716 pulsators. Truly useful results for velocity modes would require much higher efficiency spectral monitoring over at least a comparable time baseline (6–8 weeks), with a radial velocity accuracy closer to 1–2 km s-1. Achieving this level of efficiency and precision with ground-based facilities is very unlikely at present, since it would require long blocks of telescope time on multiple telescopes larger than 2 m, with good longitude coverage. Since the necessary RV accuracy would also be a problem for satellite observations, it appears that spectroscopic mode detection in the PG 1716 stars, as well as in many EC 14026 stars, has a way to go before it will be truly practical.
References
- Allard et al. (1994) Allard, F., Wesemael, F., Fontaine, G., Bergeron, P., & Lamontagne, R. 1994, AJ, 107, 1565
- Armandroff et al. (1995) Armandroff, T.E., Olszewski, E.W., & Pryor, C. 1995, AJ, 110, 2131
- Baran et al. (2005) Baran, A., Pigulski, A., Kozieł, D., Ogłoza, W., Silvotti, R., & Zoła, S. 2005, MNRAS, 360, 737
- Billères et al. (2000) Billères, M., Fontaine, G., Brassard, P., Charpinet, S., Liebert, J., & Saffer, R. A. 2000, ApJ, 530, 441
- Billères et al. (2002) Billères, M., Fontaine, G., Brassard, P., & Liebert, J. 2002, ApJ, 578, 515
- Bonanno et al. (2003) Bonanno, A., Catalano, S., Frasca, A., Mignemi, G., & Paternò , L. 2003, A&A, 398, 283
- Brassard et al. (2001) Brassard, P., Fontaine, G., Billères, M., Charpinet, S., Liebert, J., & Saffer, R. A. 2001, ApJ, 563, 1013
- Charpinet et al. (2003) Charpinet, S., Fontaine, G., & Brassard, P. 2003, in White Dwarfs, NATO Science Series, Vol. 105, eds. D. de Martino, R. Silvotti, J.-E. Solheim, & R. Kalytis (Dordrecht: Kluwer), 69
- Charpinet et al. (2005a) Charpinet, S., Fontaine, G., Brassard, P., Billères, M., Chayer, P., & Green, E.M. 2005a, A&A, 443, 251
- Charpinet et al. (1997) Charpinet, S., Fontaine, G., Brassard, P., Chayer, P., Rogers, F.J., Iglesias, C.A., & Dorman, B. 1997, ApJ, 483, L123
- Charpinet et al. (1996) Charpinet, S., Fontaine, G., Brassard, P., & Dorman, B. 1996, ApJ, 471, L103
- Charpinet et al. (2000) Charpinet, S., Fontaine, G., Brassard, P., & Dorman, B. 2000, ApJS, 131, 223
- Charpinet et al. (2005b) Charpinet, S., Fontaine, G., Brassard, P., Green, E.M., & Chayer, P. 2005b, A&A, 437, 575
- Dreizler et al. (2002) Dreizler, S., Schuh, S. L., Deetjen, J. L., Edelmann, H., & Heber, U. 2002, A&A, 386, 249
- Edelmann et al. (2005) Edelmann, H., Heber, U., Altmann, M., Karl, C., & Lisker, T. 2005, A&A, 442, 1023
- Fontaine et al. (2003) Fontaine, G., Brassard, P., Charpinet, S., Green, E.M., Chayer, P., Billères, M., & Randall, S.K. 2003, ApJ, 597, 518
- Green et al. (2003) Green, E.M., Fontaine, G., Reed, M.D., Callerame, K., Seitenzahl, I.R., White, B.A., Hyde, E.A., Østensen, R., Cordes, O., Brassard, P., Falter, S., Jeffery, E.J., Dreizler, S., Schuh, S.L., Giovanni, M., Edelmann, H., Rigby, J., & Bronowska, A. 2003, ApJ, 583, L31
- Green et al. (2005) Green, E.M., For, B.-Q., & Hyde, E.A. 2005, in 14th European Workshop on White Dwarfs, Vol. 334, eds. D. Koester, & S. Moehler (San Francisco: ASP), 363
- Green et al. (2004) Green, E.M., For, B.-Q., Hyde, E.A., Seitenzahl, I.R., Callerame, K., White, B.A., Young, C.N., Huff, C.S., Mills, J., & Steinfadt, J.D.R. 2004, Ap&SS, 291, 267
- Green et al. (1997) Green, E.M., Liebert, J.W., & Saffer, R.A. 1997, in Third Conference on Faint Blue Stars, ed. A.G.D. Philip, J.W. Liebert, & R.A. Saffer (Schenectady: L.Davis Press), 417
- Heber (1986) Heber, U. 1986, A&A, 155, 33
- Heber et al. (2003) Heber, U., et al. 2003, in White Dwarfs, NATO Science Series, Vol. 105, eds. D. de Martino, R. Silvotti, J.-E. Solheim, & R. Kalytis (Dordrecht: Kluwer), 105
- Horne & Baliunas (1986) Horne, J.H., & Baliunas, S.L. 1986, ApJ, 302, 757
- Kilkenny et al. (2002a) Kilkenny, D. 2002a, in IAU Coll. 185, Radial and Nonradial Pulsations as Probes of Stellar Physics, ed. C. Aerts, T.R. Bedding, & J. Christensen-Dalsgaard (San Francisco:ASP), 356
- Kilkenny et al. (2002b) Kilkenny, D., Billères, M., Stobie, R.S., Fontaine, G., Shobbrook, R.R., O’Donoghue, D., Brassard, P., Sullivan, D.J., Burleigh, M.R., & Barstow, M.A. 2002b, MNRAS, 331, 399
- Kilkenny et al. (1997) Kilkenny, D., Koen, C., O’Donoghue, D., & Stobie, R.S. 1997, MNRAS, 285, 640
- Kilkenny et al. (1999) Kilkenny, D., Koen, C., O’Donoghue, D., van Wyk, F., Larson, K.A., Shobbrook, R., Sullivan, D.J., Burleigh, M.R., Dobbie, P.D., & Kawaler, S.D. 1999, MNRAS, 303, 525
- Kjeldsen (2003) Kjeldsen, H. 2003, Ap&SS, 284, 1
- Kjeldsen & Frandsen (1992) Kjeldsen, H., & Frandsen S. 1992, PASP, 104, 413
- Maxted et al. (2001) Maxted, P.F.L., Heber, U., Marsh, T.R., & North, R.C. 2001, MNRAS, 326, 1391
- Maxted et al. (2002) Maxted, P.F.L., Marsh, T.R., Heber, U., Morales-Rueda, L., North, R.C., & Lawson, W.A. 2002, MNRAS, 333, 231
- Morales-Rueda et al. (2003) Morales-Rueda, L., Maxted, P.F.L., Marsh, T.R., North, R.C., & Heber, U. 2003, MNRAS, 338, 752
- O’Toole et al. (2002) O’Toole, S.J., Bedding, T.R., Kjeldsen, H., Dall, T.H., & Stello, D. 2002, MNRAS, 334, 471
- O’Toole et al. (2000) O’Toole, S.J., Bedding, T.R., Kjeldsen, H., Teixeira, T.C., Roberts, G., van Wyk, F., Kilkenny, D., D’Cruz, N., & Baldry, I.K. 2000, ApJ, 537, L53
- O’Toole et al. (2004) O’Toole, S.J., Falter, S., Heber, U., Jeffery, C.S., Dreizler, S., Schuh, S.L., & the MSST+WET teams 2004, Ap&SS, 291, 457.
- O’Toole et al. (2003) O’Toole, S.J., Jørgensen, M.S., Kjeldsen, H., Bedding, T.R., Dall, T.H., & Heber, U. 2003, MNRAS, 340, 856
- Oreiro et al. (2004) Oreiro, R., Ulla, A., Pérez Hernández, F., Østensen, R., Rodríguez López, C., & MacDonald, J. 2004, A&A, 418, 243
- MIT (1982) Phelps, F.M., III 1982, MIT Wavelength Tables, vol. 2 (MIT:Cambridge, Mass.)
- Press et al. (1992) Press, W.H., Teukolsky, S.A., Vetterling, W.T., & Flannery, B.P. 1992, Numerical Recipes in Fortran 77, Second Edition, (Cambridge University Press:Cambridge, Mass.), p. 51
- Randall et al. (2005a) Randall, S.K., Fontaine, G., Brassard, P., & Bergeron, P. 2005a, ApJS, 161, 456
- Randall et al. (2005b) Randall, S.K., Fontaine, G., Green, E.M., Brassard, P., Kilkenny, D., Crause, L., Terndrup, D.M., Daane, A., Kiss, L.L., Jacob, A.P., Bedding, T.R., For, B.-Q., & Quirion, P.-O. 2005b, ApJ, submitted
- Randall et al. (2004) Randall, S., Fontaine, G., Green, E., Kilkenny, D., Crause, L., Cordes, O., O’Toole, S., Kiss, L., For, B.-Q., & Quirion, P.-O. 2004, Ap&SS, 291, 465
- Randall et al. (2005c) Randall, S.K., Matthews, J.M., Fontaine, G., Rowe, J., Kuschnig, R., Green, E.M., Brassard, P., Chayer, P., Guenther, D.B., Moffat, A.F.J., Rucinski, S., Sasselow, D., Walker, G.A.H., & Weiss, W.W. 2005c, ApJ, 633, 460
- Reed et al. (2004) Reed, M.D., Green, E.M., Callerame, K., Seitenzahl, I.R., White, B.A., Hyde, E.A., Giovanni, M.K., Østensen, R., Bronowska, A., Jeffery, E.J., Cordes, O., Falter, S., Edelmann, H., Dreizler, S., & Schuh, S.L. 2004, ApJ, 607, 445
- Saffer et al. (1994) Saffer, R.A., Bergeron, P., Koester, D., & Liebert, J. 1994, ApJ, 432, 351
- Scargle (1982) Scargle, J.D. 1982, ApJ, 263, 835
- Silvotti et al. (2002) Silvotti, R., Østensen, R., Heber, U., Solheim, J.-E., Dreizler, S., & Altmann, M. 2002, A&A, 383, 239
- Solheim et al. (2004) Solheim, J.-E., Østensen, R., Silvotti, R., & Heber, U. 2004, Ap&SS, 291, 419
- Telting & Østensen (2004) Telting, J.H. & Østensen, R.H. 2004, A&A, 419, 685
- (50) Terman, J.L., Taam, R.E., & Hernquist, L. 1994, ApJ, 422, 729
- Thompson et al. (2003) Thompson, S.E., Clemens, J.C., van Kerkwijk, M.H., & Koester, D. 2003, ApJ, 589, 921
- (52) Unno, W., Osaki, Y., Ando, H., & Shibahashi, H. 1979, Nonradial Oscillations of Stars, Tokyo: Univ. Tokyo Press
- van Kerkwijk et al. (2000) van Kerkwijk, M.H., Clemens, J.C., & Wu, Y. 2000, MNRAS, 314, 209
- Wesemael et al. (1992) Wesemael, F., Fontaine, G., Bergeron, P., Lamontagne, R., & Green, R.F. 1992 AJ, 104, 203
- Woolf et al. (2002a) Woolf, V.M., Jeffery, C.S., & Pollacco, D.L. 2002a, MNRAS, 329, 497
- Woolf et al. (2002b) Woolf, V.M., Jeffery, C.S., & Pollacco, D.L. 2002b, MNRAS, 332, 34
| Start UT date | Begin HJD | End HJD | Observatory | Telescope | Nspec | Nhours |
|---|---|---|---|---|---|---|
| (year 2003) | (2452000+) | (2452000+) | (S/N 10) | |||
| 15 March | 713.849 | 714.033 | SObbData not included in RV power spectrum | 2.3 m | 53 | 2.94 |
| 16 March | – | – | SO | 2.3 m | 0 | – |
| 10 April | – | – | SO | 2.3 m | 0 | – |
| 13 April | – | – | SO | 2.3 m | 0 | – |
| 14 April | – | – | SO | 2.3 m | 0 | – |
| 15 April | – | – | SO | 2.3 m | 0 | – |
| 22 April | 751.755 | 751.960 | SO | 2.3 m | 76 | 4.22 |
| 23 April | – | – | SO | 2.3 m | 0 | – |
| 12 May | – | – | SSO | 2.3 m | 0 | – |
| 13 May | – | – | SO | 2.3 m | 0 | – |
| 13 May | 773.048 | 773.241 | SSObbData not included in RV power spectrum | 2.3 m | 25 | 1.75 |
| 13 May | 773.389 | 773.674 | SAAObbData not included in RV power spectrum | 1.9 m | 33 | 5.50 |
| 14 May | – | – | SO | 2.3 m | 0 | – |
| 14 May | – | – | SSO | 2.3 m | 0 | – |
| 14 May | 774.348 | 774.670 | SAAOccPartial night’s data included in power spectrum (see text) | 1.9 m | 32 | 5.33 |
| 15 May | – | – | SO | 2.3 m | 0 | – |
| 15 May | 775.113 | 775.288 | SSO | 2.3 m | 45 | 2.50 |
| 15 May | 775.376 | 775.651 | SAAOccPartial night’s data included in power spectrum (see text) | 1.9 m | 34 | 5.67 |
| 16 May | 775.679 | 775.989 | SO | 2.3 m | 116 | 6.44 |
| 16 May | – | – | SSO | 2.3 m | 0 | – |
| 16 May | 776.460 | 776.590 | SAAObbData not included in RV power spectrum | 1.9 m | 17 | 2.83 |
| 17 May | 776.664 | 776.978 | SO | 2.3 m | 114 | 6.33 |
| 17 May | 777.015 | 777.264 | SSO | 2.3 m | 58 | 3.22 |
| 17 May | – | – | SAAO | 1.9 m | 0 | – |
| 18 May | 777.683 | 777.971 | SOccPartial night’s data included in power spectrum (see text) | 2.3 m | 79 | 4.39 |
| 18 May | – | – | SSO | 2.3 m | 0 | – |
| 18 May | 778.343 | 778.651 | SAAO | 1.9 m | 42 | 7.00 |
| 19 May | 778.667 | 778.984 | SO | 2.3 m | 119 | 6.61 |
| 19 May | – | – | SSO | 2.3 m | 0 | – |
| 19 May | 779.368 | 779.599 | SAAO | 1.9 m | 26 | 4.33 |
| 20 May | 779.657 | 779.952 | SO | 2.3 m | 112 | 6.22 |
| 21 May | – | – | SSO | 2.3 m | 0 | – |
| 10 June | 800.671 | 800.969 | SO | 2.3 m | 76 | 4.22 |
| 11 June | 801.664 | 801.972 | SO | 2.3 m | 114 | 6.33 |
| 12 June | 802.661 | 802.971 | SO | 2.3 m | 82 | 4.56 |
| 13 June | 803.655 | 803.972 | SO | 2.3 m | 120 | 6.67 |
| 14 June | 804.654 | 804.969 | SO | 2.3 m | 100 | 5.56 |
| 04 July | – | – | SO | 2.3 m | 0 | – |
| 05 July | – | – | SO | 2.3 m | 0 | – |
| 06 July | – | – | SO | 2.3 m | 0 | – |
| Start UT date | Begin HJD | End HJD | No. of spectra | No. of hours |
|---|---|---|---|---|
| (year 2003) | (2452000+) | (2452000+) | (S/N 10) | |
| 14 April | 743.684 | 743.859 | 64 | 3.56 |
| 10 June | 800.713 | 800.894 | 16 | 0.89 |
| 12 June | 802.702 | 802.895 | 20 | 1.11 |
| 14 June | 804.694 | 804.872 | 10 | 0.56 |
| HJD | V | Verr |
|---|---|---|
| (2450000+) | (km s-1) | (km s-1) |
| 243.810746 | 72.81 | 1.48 |
| 260.762533 | 50.61 | 1.59 |
| 287.754529 | 71.29 | 1.34 |
| 626.801965 | 19.73 | 1.20 |
| 627.760116 | 89.81 | 1.26 |
| 642.768932 | 117.98 | 1.41 |
| 2531.603374 | 87.75 | 1.35 |
| 2532.622904 | 126.22 | 1.35 |
| Parameter | Value |
|---|---|
| Teff | 23669 190 |
| log g | 5.315 0.021 |
| R () | 0.255 0.013 |
| Period (days) | 0.8292056 0.0000014 |
| T0 (days) | 2452804.7723 0.0034 |
| K (km s-1) | 70.10 0.13 |
| (km s-1) | 54.16 0.27 |
| Vrot (km s-1) | 15.567 0.823 |
| M2,min () | 0.257 0.011 |