Morpho-kinematic modeling of gaseous nebulae with SHAPE
Abstract
We present a powerful new tool to analyse and disentangle the 3-D geometry and kinematic structure of gaseous nebulae. The method consists in combining commercially available digital animation software to simulate the 3-D structure and expansion pattern of the nebula with a dedicated, purpose built rendering software that produces the final images and long slit spectra which are compared to the real data. We show results for the complex planetary nebulae NGC 6369 and Abell 30 based on long slit spectra obtained at the San Pedro Mártir observatory.
Presentamos una nueva herramienta poderosa para analizar y desenredar la geometría 3-D y la estructura cinemática de nebulosas gaseosas. El método consiste en combinar software comercial para animación digital para simular la estructura 3-D y el modo de expansión de la nebulosa junto con un software de representación gráfica de imagenes y perfiles de línea diseñado especialmente para este propósito. Las imágenes resultantes se comparan directamente con datos reales. Presentamos resultados para las complejas nebulosas planetarias NGC 6369 y Abell 30 basados en espectros de rendija larga obtenidos en el observatorio de San Pedro Mártir.
ISM: modeling \addkeywordPlanetary nebulae: individual (NGC6369), individual (Abell 30) \addkeywordStars: Mass loss
0.1 Introduction
In recent years, the discovery of a variety of complex structures in planetary nebulae has opened many questions regarding the origin and evolution of these objects (e.g. López 2000). Deviations from simple expanding shells can include collimated outflows, poly-polar and point-symmetric structures, rings or disks. These observations have lead to a wealth of theoretical research into the effects of stellar magnetic fields, rapid rotation and binarity of the central stars, and their evolutionary path from spherically symmetric to bipolar mass-loss (e.g. Balick & Frank, 2002, and references therein). In the absence of spherical symmetry, the tilt of the nebula with respect to the line of sight and the location and position angle of the slit on the nebula can often result in complicated position-velocity (P-V) diagrams that can be difficult to interpret. The correct interpretation of the nebular 3-D geometry and kinematic structure of PNe is key to the understanding of the dynamics ruling their origin and evolution.
Modeling of line emission intensity maps have been used to obtain density distributions over the face of the nebula in order to assess 3-D structures, assuming pure photoionization from the central star (e.g. Monteiro et al. 2004; Morisset, Stasińska & Peña, 2005) but without incorporating kinematic information or assuming simple velocity laws (e.g. Ragazzoni et al. 2001).
In this paper we present a new interactive 3-D modeling tool called SHAPE which combines the versatility of commercial 3-D modeling software with a rendering module specifically developed for application in astrophysical research. The application of this method yields a 3-D emissivity and velocity distribution for the object. Furthermore, different velocity laws can be applied to different sections of the nebula to reproduce the complex velocity patterns often observed in PNe. We exemplify the power of this new method with models of the particularly complex planetary nebulae Abell 30 and NGC 6369.
0.2 Problem Definition
The problem we attack with SHAPE is to characterize the current 3-D morphology and velocity field of a nebula based on imagery and spectral kinematic information. Detailed knowledge of this information leads to a better understanding of the physical structure and dynamical evolution of a gaseous nebula.
The projected image on the sky of an extended nebula provides bidimensional spatial information of its structure. On the other hand, the velocity field provides information on the radial component of the velocity vector along the line of sight and conveys limited but useful information on its depth or third spatial dimension. However, an unambiguous solution of the complete 3-D structure at least requires full knowledge of the velocity field. This situation is usually not given, although topological and symmetry information apparent in the images and spectra may help resolve ambiguities. The simplest case occurs if the velocity of a volume element is constant over most of the expansion time. In complex objects, this type of velocity distribution can be expected if the nebula has evolved from a relatively short mass-loss event and is now moving ballistically (e.g. Zijlstra et al. 2001) or from a continuous interaction of a wind with small scale structures (Steffen & López, 2004). In these cases, after a sufficiently long time, the velocity pattern becomes proportional to the distance from the center (a hubble-like velocity law). The expansion of such a nebula is self-similar, i.e. the global shape is conserved over time.
Under such conditions, the velocity vector is proportional to the position vector of every material element in the nebula. The shape of the nebula along the line of sight is mapped linearly into the corresponding component of the velocity vector. Hence, the Doppler-shift, which is equivalent to the velocity component along the line of sight, is a map of the structure that is lost in a direct image, i.e. the long-slit spectrum allows a view of the nebula from a direction perpendicular to the line of sight. This situation can clearly be appreciated in the case of axisymmetric bipolar nebulae, where the line profiles also show a bipolar structure that represents the depth or third dimension of the 2-D image on the sky. In many planetary nebulae an expansion velocity proportional to distance from central star seems to be a reasonable approximation at least for the brightest regions (e.g. Wilson 1950, Weedman 1968). However, more complex velocity structures can be expected when one or more mass loss events arise over a significant timescale compared with the age of the nebula.
Sabbadin et al. (2000) have used the assumption of a radial velocity field proportional to the distance from the central star to reconstruct the 3-D structure of a number of nebulae with a ”tomographic” method. This tomography works well as long as there are no significant deviations from the hubble-like velocity law.
0.3 The 3D modeling system
In this section we describe our new version of the code SHAPE as a tool to find the 3-D structure and kinematics of gaseous nebulae.
Originally SHAPE was based on a description of structure and kinematics using parametric geometrical equations on a regular 3-D grid (Steffen et al. 1996). This code was adapted with a simple graphical interface by Harman et al. (2004). It has been applied to a variety of objects from individual knots in planetary nebulae (López, Steffen & Meaburn, 1997) to moderately complex structures in active galactic nuclei (Steffen et al. 1996). In the present upgraded version we have devised a completely different approach based on particle systems, rather than a regular grid, in combination with a commercial 3-D animation package, which we describe next.
As our 3-D modeling software we use Autodesk 3DStudio Max 7 (3DStudio Max is a trademark of Autodesk Media and Entertainment, see the website www.discreet.com for detailed software information). We apply the available tools of this software to create a particle and velocity distribution in space and time in order to model an object. In particular we use the ParticleFlow particle system to generate particle distributions which are then exported and rendered in SHAPE .
SHAPE renders images and spectral information from the kinematics of the model particle distribution. Key parameters such as orientation of the object on the sky, location and width of the slit, seeing values and spectral and spatial resolution are handled interactively in the graphical interface of SHAPE .
The general modeling process is as follows. With the inspection of available observations one obtains an initial rough idea of the structure and topology of the object, which is then reproduced in the modeling software. For this purpose one produces a distribution of particles in space with its corresponding velocities. The particles may be distributed over a topologically complex surface or throughout a volume. The resulting emissivity is integrated along the line of sight. The modeling software allows a very complex object to be built and since all the features may be variable in time, the time evolution of the object may also be explored.
As a guide during modeling, a spectal preview feature has been developed. For a limited number of particles it allows a rough version of the P-V diagrams to be visualized during modeling in the viewport of 3DStudio Max.
The particle data are then exported into an external file. This file is read by the core code of SHAPE , which produces the rendered image and corresponding P-V diagram. In contrast to the real-time feature described above, the core code of SHAPE is not limited by the number of particles. It has been tested with up to one million particles. The rendered images are then compared with the observations. To improve a model, changes may be introduced at any point of the procedure until, after a number of iterations, a satisfactory approximation to the observations are obtained. Alternative solutions to an ambiguous dataset will not be automatically found, but may be sought for separately.
The processing of the data, including the viewing direction, the emissivity, internal structure, size and other parameters of individual particles is controled via a dedicated graphical interface. This interface has been programmed as a module of the modeling software 3DStudio Max and is fully integrated in its interface.
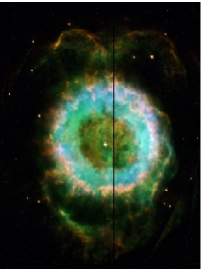
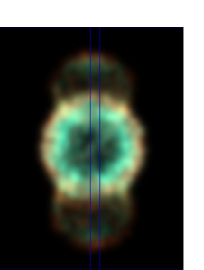
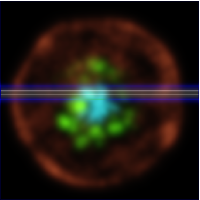
An important analytic feature of SHAPE is the possibility to apply different colors to sections of a complex object. This allows a clear distinction of them in the P-V diagrams, which helps considerably in the interpretation of the observed spectra. By combining models of various emission lines, color images are obtained to be compared with similar images from observations (see Figure 1). A red-blue coloring mode allows a clear distinction between red and blue-shifted regions in the model image.
Sequences of varying parameters like slit position and width, as well as orientation of the object allow a systematic search for the best parameters that match the observations or the production of image sequences for animations which help considerably to visualize the 3-D structure of the object. The P-V diagrams of objects that have been modeled as evolving in time can also be visualized as a time sequence in animation form.
The most important current limitation of SHAPE is that only optically thin nebulae can be modeled. The code does not perform any physical radiation transport or line emission calculation. What it does is to directly assign a relative emissivity distribution, which is sufficient for its main purpose, the characterization of the structure and kinematics of a nebula. Moreover, SHAPE can also be used to produce complex density distributions and kinematics from which photoionization models can be calculated using codes like NEBU_3D (Morisset et al, 2005). The current apparent drawbacks can hence be largely overcome by combining SHAPE with codes which calculate radiation transport. We aim at this next step in the near future.
0.3.1 The rendering code
The core code of SHAPE renders images and P-V diagrams from the position and velocity data provided with 3DStudio Max. Each particle is read from a file and its emission mapped to the image and spectrum. The intensity and color of the emission from a particle may depend on the position in the object or on the substructure of which it is part. The particles may also have a finite size larger than single image pixels, as a well as an internal emissivity structure. At this time this internal emissivity distribution may be either constant, an exponential or a gaussian fall-off. This is useful mostly for the initial modeling stages, before the convolution with the seeing parameters are applied, because convolution eliminates all internal particle structure. Particle sizes smaller than the seeing together with a sufficiently large number of particles ensure adequate sampling of the object structure.
The image blurring due to seeing is modeled by convolution with a gaussian point-spread function and including emission from within one FWHM of the seeing disk outside the spectrograph slit. The contribution of this emission decreases with distance from the edge of the slit. The instrumental resolution is included in the convolution of the raw image and P-V diagram with gaussian kernals of FWHM corresponding to the spatial and velocity resolution of the instruments. A Fast-Fourier-Transform algorithm is applied to calculate the convolutions with gaussian kernels. After convolution, the P-V diagrams can be used to obtain one-dimensional line profiles adding all or sections of the emission along the spacial domain, which are often useful in work with low spatial resolution on the nebulae. The core code of SHAPE has been programmed updating the Fortran code of the original version.
In the following sections we present two example models to reproduce observations of objects with different degrees of complexity. An additional good example for an application of SHAPE on the complex structure of NGC 6302 can be found in Meaburn et al. (2005).
0.4 Observations and models
0.4.1 NGC 6369
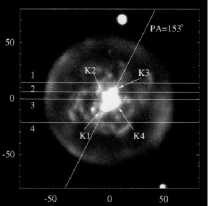
Our model of NGC 6369 is based on a long-slit spectrum obtained with MES (Meaburn et al. 2003) on the 2.1 m telescope at the San Pedro Martir Observatory. The spectral resolution is 10 km s-1 and the seeing 1.5 arcsec. The image has been obtained from the Hubble Heritage Team, NASA, STScI (Figure 1). The spectrograph slit was located in the east-west direction, which is coincident with the main axis of the object (as indicated in the model image in Figure 1). The slit width corresponds to 1.5 arcsec on the sky.
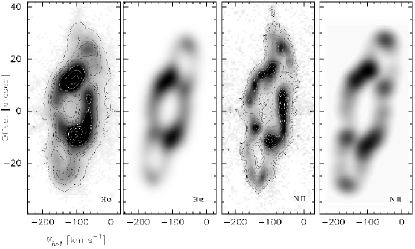
The observed spectra (Figure 2, left) show that the central ”barrel” and the ”lobes” are connected and probably conform a single topological closed surface. Therefore we have started the modeling process with an initially spherical shape and deformed it such that it matches our initial estimate of the 3-D shape according to the image and spectrum. We then applied a brightness map to the surface which approximates the emissivity distribution from the H and NII emission lines. The structure and emission distribution is then adjusted interactively until a satisfactory match was found. Figure 3 shows the 3-D structure of NGC 6369 depicted as a central ellipsoid with two opposite, off-axis, protruding lobes.
We have modeled the nebula’s expansion with two different velocity laws. Based on the observation that the highest and lowest projected velocities in the spectra are similar for the barrel and the lobes, we considered a constant expansion velocity directed perpendicularly to the surface. This corresponds roughly to an energy driven bubble (in this case three different bubbles, the barrel and the two lobes). In this case we did not find any shape that would reasonably resemble the image and spectra simultaneously.
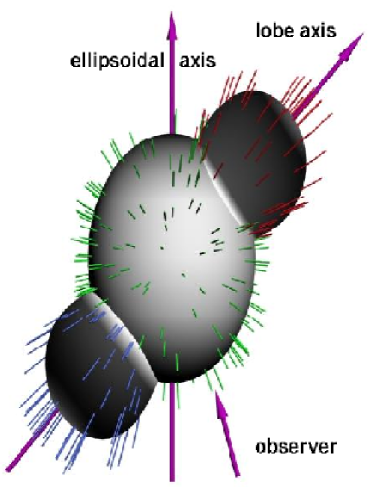
The second model assumes that the velocity is proportional to distance and the direction of motion is radial from the center of the nebula. The resulting surface model with representative velocity vectors is shown in Figure 3. For the H emission we assume that emission comes from a region somewhat inside this surface and for NII slightly outside, with some overlapping around the surface that is shown (as seen in the observed spectra and images). The rendered image and spectrum are shown in Figures (1) and (2), respectively. The particle number density is proportional to the brightness on the 3-D surface (see Fig.3), which is not accurately represented in the image due to lighting effects of this visualization, which emphasizes the topology of the 3-D structure.
Our modeling indicates, that the line of sight is close to the ellipsoid’s symmetry axis (tilt ) and the axis of the lobes is tilted approximately with respect to that axis. The ratio between the height and the diameter of the barrel is not well constrained by the current modeling and observations. We estimate that this ratio is of the order . The model images and P-V diagrams have spatial and spectral resolution corresponding to those in our observations, which are 1.5 arcsec and 10 km s-1 using a slitwidth of 1.5 arcsec in the simulation.
We find that the model with the velocity law proportional to distance produces an acceptable fit to the observed image and spectrum. This suggests that this flow is in a relaxed momentum driven state; though the lobes appear to move slightly slower than expected in this case (Figure 2). This might be an indication for a short-lived collimated outflow, which is not acting on the lobes anymore, and/or a stronger interaction of the lobes with the ambient medium due to their lower densities.
Monteiro et al. (2004) proposed a “diabolo”-type structure for NGC 6369 based on the analysis of spectral imaging data of a number of ions. The diabolo model in this case necessarily implies a narrow waist in the equatorial plane with its symmetry axis close to the line of sight. With this orientation such a narrow torus-like waist is expected to have very low velocity along the line of sight, and in the H longslit spectrum it should appear as a narrow feature near the systemic velocity. The observations presented in Figure 2 do not show evidence for a narrow low-velocity waist. However, bright emission regions near the systemic velocity in the line profiles are apparent. In our model this is due to both, an intrinsic equatorial density enhancement as seen in the image (Figure 1) as well as a long tangential line of sight through the spheroidal main nebula. Thus, our model does not require a waist to reproduce this feature. NGC 6886 and NGC 6565 are two remarkably similar nebulae to NGC 6369, both in terms of morphology and line-profile structure. Turatto et al. (2002) have modeled the structure of NGC 6565 with their tomographic method obtaining similar results to ours.
0.4.2 Abell 30
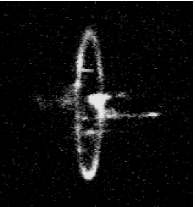
Abell 30 is a hydrogen deficient planetary nebula with a spherical [OIII] shell and complex knotty and filamentary structures in the central region. The inner region contains unusual cometary knots with large velocity spikes in the P-V diagrams. Meaburn & López (1996) describe its kinematics as ”dramatic”. In this section we present a model produced with SHAPE as a further illustration of its flexibility to handle complex kinematic structures which may be very different from a hubble-like velocity law. Observations of Abell 30 have been adopted from figures 1 and 2a in Meaburn & López (1996) which are reproduced here in Figure 4. The observations may be compared with our model model image and P-V diagram for one slit position as shown in Figure (5).
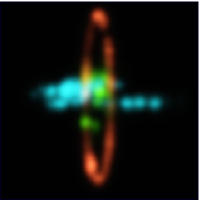
The outer shell was modeled as a sphere with some variations in brightness and a constant radial expansion. A random distribution of knots and filaments was used for the inner regions. For the cometary knots, particles where emitted from discrete points which then interacted with a central spherically symmetric wind, accelerating the particles outwards and producing the high-speed features in the P-V diagrams. Support for the existence of such a wind in Abell 30 comes from observations of X-rays (Chu, Chang & Conway, 1997).
For the model we adapted the parameters similar to those of the observations with seeing between 1 and 2 arcsec and a width of the slit of 1.9 arcsec. For the model we used 1.5 and 1.9 arcsec respectively. Since the object is basically spherically symmetric, except for the random distribution of brightness variations of the outer shell and the distribution of knots in the central region, the specific orientation of the model is not a fundamentally important parameter.
At this time no attempt was made to match individual small-scale features with those in Abell 30. Still, the spectrum in Figure 5 matches the observed one very well. This model shows how different methods can be used to combine substructures which have a variety of complexity and kinematic signatures.
0.5 Discussion and Conclusions
In this paper we have presented the upgraded version of SHAPE , with a novel approach to the determination of the three-dimensional structure and kinematics of gaseous nebula. SHAPE combines the capabilities of commercial 3-D modeling software with a purpose-built rendering software and graphical control interface for its application to astrophysical nebulae. SHAPE produces images and P-V diagrams for highly complex nebulae. The results can be compared directly with observations and help to understand structure, kinematics and orientation of the objects.
The kinematics as observed from long-slit spectra often provides sufficient information about the 3-D structure and topology of an object for the modeling with SHAPE to provide a self-consistent 3-D structure. In addition the SHAPE models can be applied directly as input density distributions for photo-ionization codes. In SHAPE one can define and combine different velocity laws that fit complex structures. Solutions are expected to be most reliable if the object shows evidence for a significant degree of symmetry, then the full 3-D structure and kinematics can be deduced unambiguously. In other cases the object may be devided into regions or subsystens which allows them to be solved separately.
We are currently building a catalogue of of synthetic emission line profiles with SHAPE that should be a useful reference to interpret long-slit observations of PNe with diverse morphologies and orientations.
In this paper we showed applications of SHAPE to the planetary nebulae Abell 30 and NGC 6369. As a result of our application of SHAPE to new observations of the planetary nebula NGC 6369, we propose that its basic structure is that of a ellipsoidal or barrel-shaped main nebula with bipolar protrusions at a large angle to the symmetry-axis of the main nebula. Abell 30 has been modeled combining different velocity patterns to fit the expanding shell and the inner high-velocity knots.
Acknowledgements.
We acknowledge support from DGAPA-UNAM projects IN111803 and IN112103 as well as CONACYT projects 37214 and 43121.References
- (1) Balick, B., Frank, A., 2002, ARAA, 40, 439-486
- (2) Chu, Y.-H., Chang, T.H., Conway, G.M., 1997, ApJ, 482, 891-896
- (3) Harman, D.J., Bryce, M., López, J.A., et al., 2004, MNRAS, 348, 1047-1054
- (4) López, J.A., Steffen, W., Meaburn, J., 1997, ApJ, 485, 697-702
- (5) López, J.A., 2000, RevMexAA Conf. Series, 9, 201
- (6) Meaburn, J., López, J.A., Steffen, W., Graham, M.F., Holloway, A.J., 2005, AJ, 130, 2303-2311
- (7) Meaburn, J., López, J.A., Gutiérrez, L., Quiróz, F., Murillo, J.M., Valdéz, J., Pedrayez, M., 2003, RMxAA, 39, 185
- (8) Meaburn, J., López, J.A., 1996, ApJ, 472, L45-L47
- (9) Monteiro, H., Schwarz, H.E., Gruenwald, R., Heathcote, S., 2004, ApJ, 609, 194-202
- (10) Morisset, C., Stasińska, Peña, M., 2005, MNRAS, 360, 499-508
- (11) Ragazzoni, R., Cappellero, E., Benetti, S., Turatto, M., Sabbadin, F., 2001, A&A, 369, 1088
- (12) Sabbadin, F., Cappellero, E., Benetti, S., Turatto, M., Zanin, C., 2000, A&A, 355, 688-698
- (13) Steffen, W., Holloway, A.J., Pedlar, A., 1996, MNRAS, 282, 130-136
- (14) Steffen, W., López, J.A., 2004, ApJ, 612, 319-331
- (15) Turatto, M., Cappellaro, E., Ragazzoni, R., et al., 2002, A&A, 384, 1062-1085
- (16) Weedman, D.W., 1968, ApJ, 153, 49
- (17) Wilson, O., 1950, ApJ, 111, 279
- (18) Zijlstra, A. A., Chapman, J. M., Hekkert, P. L., et al., 2001, MNRAS, 322, 280-308