Far-UV Observations of a Thermal Interface in the Orion-Eridanus Superbubble
Abstract
Diffuse far-UV emission arising from the edge of the Orion-Eridanus superbubble was observed with the SPEAR imaging spectrometer, revealing numerous emission lines arising from both atomic species and H2. Spatial variations in line intensities of Civ, Siii, and Ovi, in comparison with soft X-ray, H and dust data, indicate that these ions are associated with processes at the interface between hot gas inside the bubble and the cooler ambient medium. Thus our observations probe physical conditions of an evolved thermal interface in the ISM.
Subject headings:
ultraviolet: ISM — line: identification — ISM: bubbles — ISM: lines and bands1. Introduction
The Orion-Eridanus Superbubble (OES) is a large cavity in the interstellar medium (ISM) created by some combination of stellar winds and supernovae from the enclosed Orion OB1 stellar association, (e.g. Reynolds & Ogden 1979). Its comparable proximity and size (300 pc) give it a large apparent angular extent of 30∘ (Burrows & Guo 1996), allowing for detailed study of its structure. The complicated morphology and dynamics, described by Guo et al. (1995), indicate that the OES is still evolving and expanding into the ISM and thus it likely includes a variety of interfaces and asymmetries resulting from interacting phases of interstellar gas. The OES has clearly-delineated thermal boundaries between the ambient ISM and the suberbubble cavity. The cavity is bright in soft X-ray (SXR) emission, indicating that it is filled with hot TK gas (see Heiles et al. 1999). For example, the X-ray edge of the OES toward Galactic South (lower right of Fig. 1) coincides with a ridge of H emission produced by cooler T K gas, beyond which still-cooler neutral H and dust are seen in 21-cm (Heiles et al. 1999) and infrared (Burrows et al. 1993).
We took a detailed far ultraviolet (FUV) emission spectrum with the
SPEAR instrument
to study the physical conditions across one edge of the OES,
where hot and cooler gas are likely to be interacting.
SPEAR (aka FIMS) spectrally images
diffuse FUV background radiation with
550, using
two large field of view (FOV) imaging spectrographs
optimized for measuring diffuse emission:
the Short ’S’ (900-1150 Å)
and Long ’L’ (1350-1750 Å)
channels.
The instrument and on-orbit performance are described
in Edelstein et al. (2005a).
2. Observations and Data Reduction
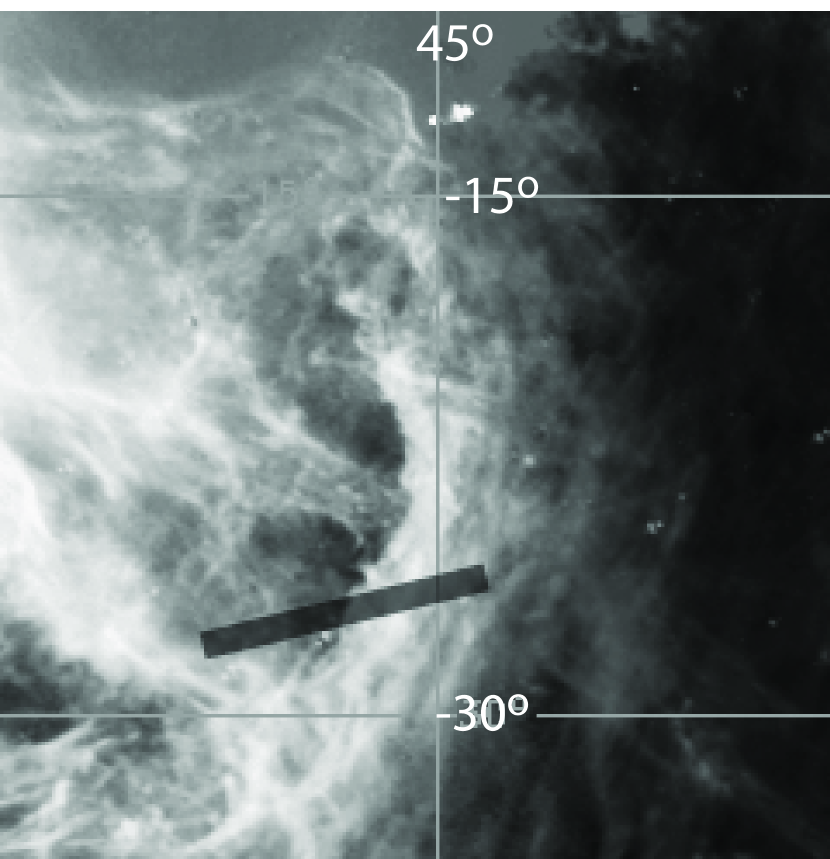
SPEAR observed a fixed location in the OES where hot X-ray emitting gas abuts cooler H and infrared (IR) emitting gas. The imaged field (see Fig.1) spans the bright outermost H front called ’Arc B’ by Boumis et al. (2001), and is large enough to simultaneously measure both the hot X-ray region inside and the colder IR region outside the bubble. The target was observed over 60 orbits in Dec 2003 for a cumulative exposure time of 31 ks.
The data were processed as described in Edelstein et al. (2005b).
We removed data recorded at times with high count rate
( for S and
for L channel) to mitigate
terrestrial airglow contamination.
Spectra were binned by 1 Å, smoothed by a 3 Å running boxcar,
and fluxed to Line Units (LU, photons s-1cm-2sr-1).
All of the L channel photons were mapped to the sky and
the image inspected for the presence of stars.
Two 20-wide image features are consistent with
stellar profiles, with a flux of
erg s-1cm-2Å-1.
If the features are indeed
caused by faint UV stars, then they contribute no more than
7% of the background continuum flux over 1∘ –
an unimportant source of error in our spectral line analysis.
Potential stellar contributions to the S channel are even less significant.
3. Spectral Analysis
The raw spectra show a strong underlying background component in addition to the many emission lines of interest. We used a spectral model (Korpela et al. 2005) to simultaneously fit the background and overlying emission lines. The background model has an equivalent total intensity of 3500 continuum units (CU, photons s-1cm-2sr-1Å-1) in the S channel and 1000 CU in L. The background signal primarily consists of contributions from instrumental dark noise (80 of the background in S channel) and starlight scattered by interstellar dust (60 in L), with instrumentally-scattered geocoronal Ly- emission also contributing to the S background. The starlight is fit by a canonical power-law (index=0.26) stellar luminosity function which is absorbed and scattered by intervening dust and gas with N(Hi)cm-2, a value similar to the N(Hi)cm-2 measured in this location by the Leiden/Dwingeloo Survey (Hartmann & Burton 1997). We subtract the fitted background model from the raw spectrum to obtain a net emission spectrum. Many emission lines are apparent in this net spectrum. The strongest are terrestrial in origin - arising from airglow in Earth’s upper atmosphere - including the bright Lyman series from 912-1026 Å, Oi at 990/1041 Å, some fraction of Ni at 1133 Å, and Oi prominently at 1356 Å and possibly blending with Heii at 1641 Å. We identify and attribute most of the remaining lines to astrophysical sources, namely originating in the OES or ISM.
Several significant emission features could not be accounted for by neutral or ionized atomic species. A theoretical spectrum of H2 fluorescence lines (Draine 2004, private communication), however, provides a good fit to most of these lines and blends. The total H2 flux is 19 kLU in S channel, and 32 kLU in L. This is 10 of the integrated flux from the scattered stellar continuum fit, whose band-averaged value is 400 and 570 CU in the S and L channel, respectively. Thus we have discovered a significant H2 component toward the OES. We defer discussion of this component to future work; see Ryu et al. (2005) for an analysis of the physical parameters and proposed location and origin of the H2 gas detected by SPEAR over the entire Eridanus region. For the present analysis, we subtracted the modeled H2 component to obtain a net atomic emission spectrum, shown in Fig. 4.
We find lines from species with a wide range of ionization potentials (6-114 eV), indicative of both cool and hot interstellar gas along the sight-line. The spectral model (Korpela et al. 2005) was used to estimate the emission line strengths. Some of the most significant (S/N3) astrophysical line model detections are Ovi and Nii in S channel, and Siiv, Oiv], Siii, Civ, and Alii in L channel. A list of identified atomic lines, observed line centers to the nearest 1 Å, total line flux, and signal to noise ratio is shown in Table 1. The spectral model finds traces of other lines including Feii, Ari and Siii, along with other undetected lines. Before these identifications can be made secure, however, more careful analysis is required to account for potential confusion from H2 fluorescence and airglow lines. Such analysis was done for Ciii (977Å), which is close to the Ly (973Å) airglow line. We only establish an upper limit (90% confidence) to the Ciii flux, which is included in the Table 1.
| Wavelength | Species | Intensity | S/N |
|---|---|---|---|
| (Å) | ID | (LU) | |
| 977 | Ciii | 3.6 | 1.7 |
| 990a,ba,bfootnotemark: | Oi | 0.2 | 0.4 |
| 990bbBlended Line | Niii | 0.9 | 1.6 |
| 1013 | Siii? | 0.7 | 1.3 |
| 1032 | Ovi | 2.0 | 3.4 |
| 1038 | Ovi | 1.0 | 1.8 |
| 1067 | Ari? | 0.8 | 1.5 |
| 1074aaAttributed to Airglow | Hei | 2.4 | 4.2 |
| 1085 | Nii | 1.8 | 3.0 |
| 1134aaAttributed to Airglow | Ni | 5.3 | 7.2 |
| 1358aaAttributed to Airglow | Oi | 3.6 | 17.1 |
| 1394 | Siiv | 0.9 | 5.5 |
| 1403bbBlended Line | Siiv | 0.4 | 2.8 |
| 1404bbBlended Line | Oiv] | 0.7 | 4.2 |
| 1417 | Siv? | 0.2 | 1.6 |
| 1533 | Siii | 2.1 | 13.0 |
| 1549 | Civ | 2.2 | 12.7 |
| 1640bbBlended Line | Heii | 0.5 | 2.0 |
| 1641a,ba,bfootnotemark: | Oi | 0.9 | 3.4 |
| 1657 | Ci | 0.6 | 2.3 |
| 1671 | Alii | 1.9 | 6.3 |
3.1. Spatial Variation of FUV Emission Intensity
In order to understand the origin of the observed FUV emission-line species, we have examined the spatial variation of emission along the long dimension of the SPEAR FOV for three bright emission lines that trace species of very different ionization states, and compared the spatial variations to other bands. The emission lines used in this analysis are Ovi (1032 Å), Civ (1549 Å), and Siii (1533 Å). Energies of 114, 48, and 8 eV are required to produce Ovi, Civ, and Siii, respectively.
For the Civ and Siii analysis, we divided the L-channel FOV into 1.0∘ bins and made separate spectra for each location. The Civ and Siii intensity were clearly diminished in some locations, so we defined a baseline spectrum with relative intensity zero in the location where both lines were weakest. We then subtracted this baseline Civ/Siii spectrum from the other spectra after scaling to fit the continuum in a quiet region (around 1500 Å). Assuming that the continuum did not change between FOV locations, scaling and subtracting the baseline spectrum leaves only the excess line emission at each location. We then fit Gaussian line profiles to the residuals to measure the Civ and Siii excess intensity. There is little if any Siii emission in the baseline spectrum, so we assume that the excess intensity is similar to the absolute intensity for Siii. We note that the absolute intensity of Civ, however, may be significantly underestimated because there is a strong, broad Civ absorption line in the scattered stellar background not taken into account here.

We measured Ovi relative intensity variations using a
similar approach.
The Ovi (1032 Å) line is resolved, but close to the intense
Ly airglow line (1026 Å), which dominates all features in
the S channel. So instead of scaling to the continuum, we performed a
near-unity scaling to fit the short wavelength shoulder of the
Ly line profile. Fig 2 shows the spectra
for the four locations after this scaling but before subtraction.
Note how the Ovi intensity is clearly enhanced in two adjacent
locations. (At the distance of the OES, this 12∘ zone
corresponds to 510 pc.)
Assuming that the airglow line profile
did not change between locations, scaling to Ly and subtracting
the baseline leaves only the excess Ovi emission at each location.
Again there is little if any Ovi emission in the minimum
location, so we assume that the excess intensity is approximately equal
to its absolute intensity.
4. Discussion
The global structure and coherence of the OES is a matter of some debate. In particular, it has been suggested that one of the two prominent H filaments in the region (’Arc A’, see Boumis et al. (2001)) may be part of a more distant shell structure unrelated to the OES. But Arc A only grazes the edge of SPEAR’s FOV where we measure no enhancement, while Arc B’s FUV enhancement is quite prominent in the center of the FOV. Since the features are unconfused and the contribution from Arc A is minimal, we presume that our measurements are dominated by Arc B.
The present SPEAR observations reveal interstellar gas with a wide range of ionization toward the OES whose origin and location we wish to clarify. The emission line species detected range from low ionization state ions (e.g. Siii, Alii) which can be created entirely by photo-ionization of the cold neutral ISM by the ambient interstellar radiation field, to species (e.g. Siiv, Civ) that can be created either by photo-ionization or by thermal ionization, to species (e.g. Ovi, Heii, Oiii]) likely created only by thermal excitation because of their high ionization potentials or low optical depth.
The OES has been previously observed twice in the UV. Paresce et al. (1983) observed regions of the OES near our target with a narrow-band photometer and concluded that their measured increase in the UV count rate over the bubble edge was most likely due to some combination of H2 fluorescence, thermal, or Hi two-photon emission from ionized gas. Two small, 1∘, fields (within 5∘ of our target but not spanning the bubble edge) were observed with the low-resolution spectrometer (Murthy et al. 1993). They attributed a strong FUV continuum to starlight scattered by interstellar dust with possible small additional contributions from unidentified emission lines and two-photon continuum emission from Hi radiative decay. These previous data were insufficient to detect spectral line variation across the bubble interface, leaving questions unanswered about how the FUV emission is linked to the physical properties of the bubble’s interface with the ambient interstellar media.
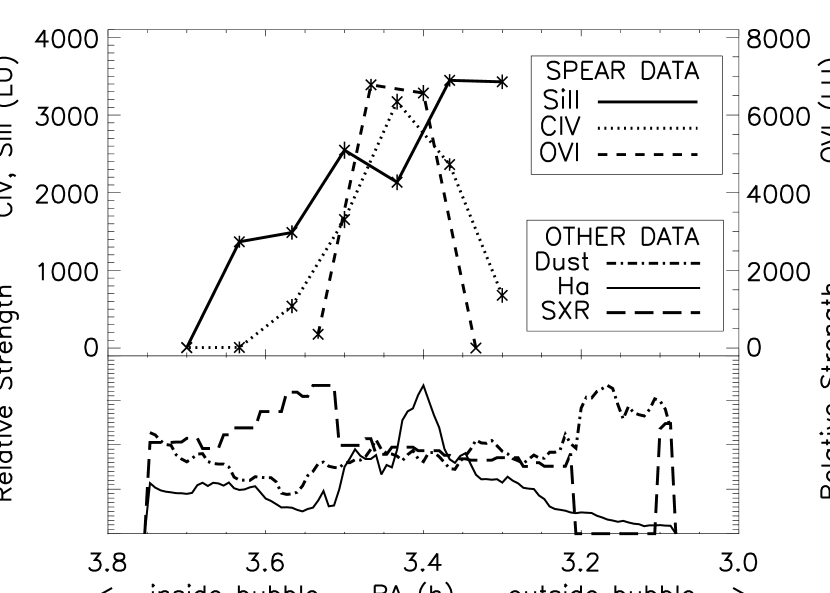
The spatial variation analysis results are shown in the upper panel of Fig. 3, which plots line strength of the three analyzed species per one-degree bin along the FOV: four bins in S channel, and seven in L. The high-ionization lines Ovi and Civ are expected to trace high-temperature gas, while the low-ionization Siii line should trace lower-temperature gas and dust. Since the SPEAR FOV spans a thermal boundary in the OES, separate spectra sample locations both inside and outside the superbubble. The lower panel shows spatial variation in emission from three other wavebands for comparison: 1.4 keV SXR (Snowden et al. 1995), dust (Schlegel et al. 1998), and H (Finkbeiner 2003). (Data obtained from NASA’s SkyView facility, http://skyview.gsfc.nasa.gov). We note that both Civ and Ovi intensity are highest at RA= 3.45h, where H emission peaks. This behavior strongly supports the inference that the majority of Civ and Ovi emission originates from the OES thermal interface. The ambient media outside the bubble are likely far too cold to produce Ovi, while the hot, thin X-ray emitting gas inside has too low of an Ovi or Civ ionization fraction and emission measure to produce measurable emission. The Siii emission, in contrast, increases outside the bubble where the enhanced dust reddening map indicates cool ambient gas resides.
Whether the interface contains a fast interstellar shock is an important question about its nature. Hartigan et al. (1987) provide a means for probing this using the Ovi/Ciii (977Å) flux ratio, a sensitive indicator of shock velocity. In an observation a few degrees away from ours at a similar location on the H interface, Murthy et al. (1993) detect Ciii at 20 kLU but do not robustly detect Ovi, at 1010 kLU. Our firm 3 kLU detection of Ovi is consistent with their result, being well below their detection threshhold, but our Ciii upper limit is much smaller at 3.6 kLU. The Ovi/Ciii ratios from Voyager and SPEAR data, 1 and 0.8 respectively, could arise from a shock with velocity 140-180 km/s according to the Hartigan models. However, Naranan et al. (1976) compared the OES to Vela and Cygnus – two middle-aged supernova remnants known to contain fast shocks – and found Eridanus to be older, larger, and fainter in X-ray emission, concluding that if the OES has a supernova origin then it is more evolved with much lower velocities. Additionally, the SPEAR observations of Vela (Nishikida et al. 2005) and Cygnus (Seon et al. 2005) show two orders of magnitude more OVI and CIII emission than Eridanus, and have OVI/CIII ratios between one and two. Moreover, there are no direct observations of high-velocity gas in the Eridanus region that could produce highly-ionized species such as Ovi by thermal heating from fast shocks. Both Heiles et al. (1999) and Reynolds & Ogden (1979) showed the OES Hi/H shell to be expanding at 20 km/s, and interstellar absorption observations (Welsh & Lallement 2005) show no high-velocity absorption components. Finally, if the Voyager and SPEAR measurements are sampling a similar interface, then it is puzzling that the Voyager measurement of Ciii so far exceeds the SPEAR upper limit. We believe the difficulty in assesment of background subtraction and separating Ly from Ciii in Voyager data could have compromised the result and explain the discrepancy.
We conclude that a fast shock is one possibility at the interface, but
there is not a plurality of evidence to support it. We suggest that
a slow shock or a ’quiescent’ (non-shock) thermal interface between
the hot X-ray producing interior cavity of the OES
and the cool ambient medium could be responsible for
producing the highly-ionized species we observe.
5. Conclusions
We have discovered numerous diffuse atomic and molecular FUV emission lines emanating from both hot and cool gas toward the OES. Of these lines, only Ovi has been previously detected in the OES at all, though not at the bubble edge. We measured intensity variations of Ovi, Civ, and Siii emission across the interface between the hot bubble interior and the ambient cooler media. The Ovi and Civ emission are greatly enhanced at the interface, and clearly show an ionized stratification. While these ions could be formed in a fast shock, we suggest that a quiescent thermal interface model is also consistent with the FUV observations and with other previous observations finding only low-velocity gas. We have also observed a significant H2 component, despite the moderate total hydrogen column in this direction.
The spatial variation of emission line intensity across the interface holds much promise for probing the physics of the interface, especially when applied to species of widely varying ionization potential. To further probe the physics of the OES region, we intend to extend our analysis to additional spectral lines and to two more deep observations SPEAR made of the OES toward nearby fields. We will also test interface models predicting the spectral components. These new data can contribute to the understanding of interstellar thermal heating sources and interfaces by comparing the FUV emission line observations with predictions made with interface models invoking shocks, conduction, and turbulent mixing.
References
- Boumis et al. (2001) Boumis, P. et al. 2001, MNRAS, 320, 61
- Burrows & Guo (1996) Burrows, D. & Guo, Z. 1996, in Roentgenstrahlung from the Universe, 221–224
- Burrows et al. (1993) Burrows, Singh, Nousek, Garmire, & Good 1993, ApJ, 406, 97
- Edelstein et al. (2005a) Edelstein, J. et al. 2005a, ApJ, in press (this volume)
- Edelstein et al. (2005b) —. 2005b, ApJ, in press (this volume)
- Finkbeiner (2003) Finkbeiner, D. P. 2003, ApJS, 146, 407
- Guo et al. (1995) Guo, Burrows, Sanders, Snowden, & Penprase 1995, ApJ, 453, 256
- Hartigan et al. (1987) Hartigan, P., Raymond, J., & Hartmann, L. 1987, ApJ, 316, 323
- Hartmann & Burton (1997) Hartmann, D. & Burton, W. B. 1997, Atlas of galactic neutral hydrogen (Cambridge; New York: Cambridge University Press)
- Heiles et al. (1999) Heiles, C., Haffner, L. M., & Reynolds, R. J. 1999, in ASP Conf. Ser. 168: New Perspectives on the Interstellar Medium, 211–+
- Korpela et al. (2005) Korpela, E. J. et al. 2005, ApJ, in press (this volume)
- McGlynn et al. (1998) McGlynn, T., Scollick, K., & White, N. 1998, in IAU Symp. 179: New Horizons from Multi-Wavelength Sky Surveys, 465–+
- Murthy et al. (1993) Murthy, J., Im, M., Henry, R., & Holberg, J. 1993, ApJ, 419, 739
- Naranan et al. (1976) Naranan, Shulman, Friedman, & Fritz 1976, ApJ, 208, 718
- Nishikida et al. (2005) Nishikida, K. et al. 2005, ApJ, in press (this volume)
- Paresce et al. (1983) Paresce, F., Bowyer, S., & Jakobsen, P. 1983, A&A, 124, 300
- Reynolds & Ogden (1979) Reynolds, R. J. & Ogden, P. M. 1979, ApJ, 229, 942
- Ryu et al. (2005) Ryu, K. et al. 2005, ApJ, in press (this volume)
- Schlegel et al. (1998) Schlegel, D. J., Finkbeiner, D. P., & Davis, M. 1998, ApJ, 500, 525
- Seon et al. (2005) Seon, K. I. et al. 2005, ApJ, in press (this volume)
- Snowden et al. (1995) Snowden, S. L., et al. 1995, ApJ, 454, 643
- Welsh & Lallement (2005) Welsh, B. Y. & Lallement, R. 2005, A&A, 436, 615
