Far Ultraviolet Spectral Images of the Vela Supernova Remnant
Abstract
We present far-ultraviolet (FUV) spectral-imaging observations of the Vela supernova remnant (SNR), obtained with the Spectroscopy of Plasma Evolution from Astrophysical Radiation (SPEAR) instrument, also known as FIMS. The Vela SNR extends in the FUV and its global spectra are dominated by shock-induced emission lines. We find that the global FUV line luminosities can exceed the 0.1–2.5 keV soft X-ray luminosity by an order of magnitude. The global O VI:C III ratio shows that the Vela SNR has a relatively large fraction of slower shocks compared with the Cygnus Loop.
1 Introduction
The Vela supernova remnant (SNR) has been studied in great detail due to its proximity (250pc; Cha et al., 1999) and its large angular diameter of (Aschenbach et al., 1995). The remnant is 10,000 years old (Reichley et al., 1970) and its overall emission is dominated by the interaction of the SN blast wave with the interstellar medium (ISM), but also has a pulsar and plerionic nebula near its center.
Vela is one of two Galactic SNRs (the other being the Cygnus Loop) that has been extensively studied in the UV. The UV emission from SNRs arises primarily in shocks driven by the supernova blast wave into interstellar clouds. The shock velocities responsible for the UV emission lie in the range 50-300 km s-1, and heat the gas to temperatures of K. The hot shocked gas can also be studied via absorption so long as there are suitable background continuum sources.
Absorption line studies of Vela using Copernicus showed the presence of O VI and N V, high ionization species expected in shocked gas, and also high velocity components of lower ionization species (Jenkins et al., 1976a, b). Absorption line studies have also been carried out with IUE (Jenkins et al., 1984; Nichols & Slavin, 2004), HST (Jenkins & Wallerstein, 1995; Jenkins et al., 1998) and FUSE (Slavin et al., 2004). These studies have shown the existence of fast shocks (160 km s-1) distributed widely but inhomogeneously across the face of the remnant, and also the variations in the dynamic pressure driving these shocks.
Emission line studies of Vela have been carried out using IUE (Raymond et al., 1991), HUT (Raymond et al., 1997), FUSE (Sankrit et al., 2001, 2003) and Voyager 2 UVS (Blair et al., 1995, henceforth BVL). These observations, except for the ones obtained by Voyager 2, were of regions with angular extents of order an arc-minute and probed the properties of individual shock fronts. BVL analyzed Voyager 2 spectra of a region in the northern part of Vela, which showed strong C III and O VI emission features. They found variations in the flux ratios on scales of 0.2∘. They also concluded from the overall flux ratio between the two lines that slower shocks (those unable to produce O VI) were more prevalent in Vela than in the Cygnus Loop. FUSE spectra of a few regions in Vela well separated from each other have strong C III lines and relatively weak or no O VI, and show the presence of slower shocks ( km s-1) spread over the face of the remnant (Sankrit, 2004).
We present spectral images of the Vela SNR in several FUV lines and FUV spectra of the entire remnant. The data were obtained with SPEAR (The Spectroscopy of Plasma Emission from Astrophysical Radiation), also known as FIMS (Far-ultraviolet Imaging Spectrograph). SPEAR, launched Sepember 27, 2003 on the Korean satellite STSAT-1, is a dual-channel FUV imaging spectrograph (S channel 900 - 1150 Å, L channel 1350 - 1750 Å, 550) with a large imaged field of view (S: 4.0, L: 7.5, spatial resolution ) optimized for the observation of diffuse emission (see Edelstein et al., 2005a, b, for an overview of the instrument and mission.). A large effective field of view can be obtained by sweeping across the sky. This combination of instrument properties yields a dataset that supplements data obtained in previous UV studies of the remnant. The data allow us to estimate the total flux from Vela in several FUV lines.
In the following sections we present the observations (§2), discuss the spectral images (§3) and the total spectrum (§4). The last section (§5) summarizes the importance of these data for the study of SNRs.
2 Observation and Data Analysis
The Vela SNR region was observed between January 31 and February 4, 2004. The data were processed as described in Edelstein et al. (2005a, b) including rejection of data for which the attitude knowledge was poor (30’) or data contaminated by airglow, evident from an increased count rate at the end of each orbit (10% of the data). The resulting number of photons and exposure obtained over 16 orbits were (4.4, 7214 s) and (1.8, 6307 s) for the L channel and S channel, respectively. While the SNR region was entirely observed in the L channel, the S channel coverage was incomplete. The photon’s sky coordinates (, ) and wavelengths () were binned to 0.15∘ (similar to the SPEAR imaging resolution after attitude reconstruction) and to 1 Å, respectively and combined with exposure maps to create a 3-d count-rate data cube (, , ) for each spectral channel. We identified data contaminated by bright stars in each channel as pixels in the wavelength-integrated total count rate image that exceeded 3 times the median count rate of a relatively star-free area. The L and S channels contained 20% and 10% of the total pixels identified as stars, respectively.
To create spectral images, the data cube was summed across the waveband of interest with star pixels removed. Star pixel “holes” were filled with a linear fit to adjacent pixels at the “hole’s” declination. The undetected stars have a flux ergs s-1 cm-2Å-1 in the SPEAR L channel. Improved stellar identification, removal and reconstruction methods are currently being developed.
Net spectral images for specific emission lines, , were constructed by subtracting a continuum image, , made from a similar width spectral region adjacent to the emission line from an image, , made from a spectral region including the emission line, i.e. . This approach often results in an over-subtraction of the lower intensity pixels. The continuum selected from the global spectra is not suitable for lower intensity pixels because of the non-zero slope of the adjacent continuum. Therefore we apply a variable scaling factor, , to the subtraction of the continuum image: . For each line image, the factor was set for each image pixel associated with a bin of a five-bin intensity histogram of such that 70% (i.e. 2) of those pixels would have a net positive flux. The resulting values of were 1.0 at high to medium intensity bins and decreased for the lowest one to three intensity bins, depending on , with a typically minimum value of 0.6 for the lowest intensity bin. The resulting were smoothed using a 3-pixel (0.45∘) square median smoothing function. Diffuse spectra were derived by totaling photons and exposure over regions of interest, excluding bright star pixels, and then smoothed by a 3 Å boxcar function.
3 Spectral Images
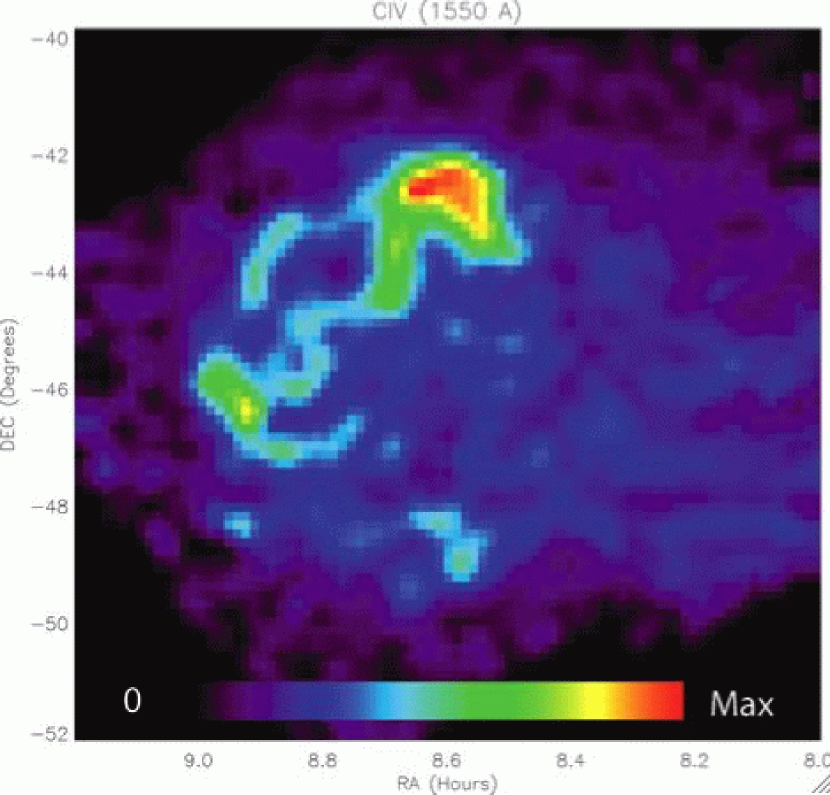
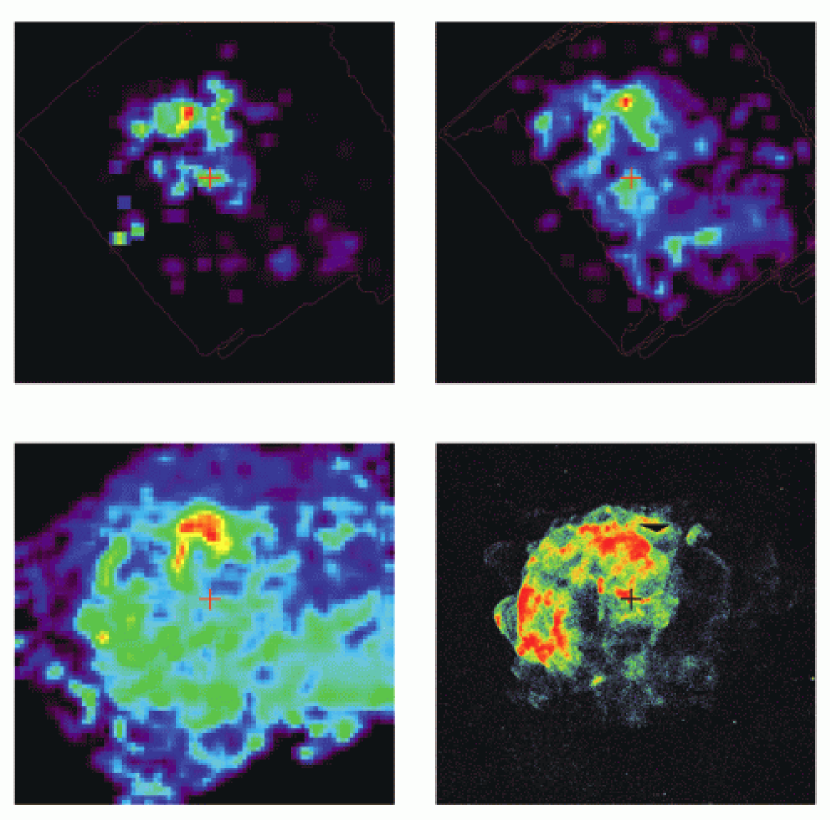
We show the C IV (1543–1557 Å) image of Vela in Fig. 1. This is the most prominent emission line in the L channel, and the figure shows the overall morphology of the FUV emission from the SNR. Images of Vela in C III (974-980 Å), O VI (1019-1033 Å), Si IV & O IV] (1398–1413 Å) are shown in Fig. 2. Also shown for comparison is the ROSAT All-Sky Survey (RASS) 1/4 keV image of the same region. The SPEAR maps show that FUV emission is present over most of the Vela SNR. The C III map in particular shows the widespread presence of radiative shocks. O VI and C III trace gas at very different ionization states. O VI production requires a shock velocity of about 150 km/s while C III is produced even in 80 km/s shocks. There is some overall correspondence between the two, showing where the FUV producing shocks exist, but C III is more extended. C IV and Si IV & O IV] images show a close correlation: C IV, Si IV, and O IV] have comparable ionization potentials and are roughly co-extensive in the post-shock gas.
Although the FUV and X-ray emission features are not closely correlated, their extent is roughly the same. Lu & Aschenbach (2000) attribute the X-ray emission to thermal emission from a hot, thin gas in the SNR interior. We used the plasma temperatures and emission measures in Table 1 of Lu & Aschenbach (2000) as input for CHIANTI (Dere et al., 1997; Young et al., 2003) and confirmed that they produce insufficient thermal FUV emission by several orders of magnitudes compared with the observed emission. The FUV emission comes from shocks that have been driven into interstellar clouds. These clouds are large enough that they have not been destroyed by the blast wave sweeping over them, and they have a high covering factor. The total FUV luminosity of Vela exceeds the total soft X-ray luminosity (see §4). Thus, the overall radiation rate of the SNR is dominated by shocks in higher density regions traced by their FUV emission.
The most prominent localized feature is an intense knot of emission near (, )=(8.6 h, -42.5∘) that appears at all FUV wavelengths, including the soft X-ray band. A detailed comparison shows that the peak emission for each FUV wavelength and the soft X-ray are non-coincident and arranged in an arc, suggesting that the feature could be a complex and intense bow shock perhaps analogous to the X-ray “bullet shocks,” or “knots,” of similar scale. Aschenbach et al. (1995) identified six (labeled A through F) of these X-ray knots and suggested that they were created by high-density ejecta shock-heating the ambient medium. The FUV images appear to be limb brightened along the north-east shell boundary and, notably, joins the X-ray knot D to the main shell in C IV and Si IV/O IV].
FUV emission is absent from the knot B region despite its similarity in X-ray intensity to knot D. This is consistent with FUV emission arising from shocked interstellar media because the knot D bullet is believed to be encountering a more dense ambient media than knot B. An FUV enhancement particularly notable in O VI, whose localized intensity peak is coincident with the Vela pulsar, and C III, which coincides with the Vela-X radio continuum nebula (Haslam et al., 1982; Bock et al., 1998, Figures 1 & 2), is coincident with a soft X-ray ridge, suggestive of a shock structure. Curiously, there is little associated C IV or Si IV & O IV] emission from the same area in comparison to the region of maximum intensity (, )=(8.6 h, -42.5∘). This suggests that we are detecting at least two markedly different physical conditions in the region surrounding the Vela pulsar. A more detailed examination will be necessary to tell if these are related, or merely happen to lie along the same line of sight.
4 FUV Spectra
The diffuse SPEAR FUV spectra from the entire Vela SNR region are shown in Fig. 3. The spectra show strong emission lines from highly ionized atoms produced by high velocity shocks and/or hot plasmas. Detected lines include C III (977 Å), N III (990 Å), O VI (1032, 1038 Å), O IV] and Si IV (1400, 1403 Å unresolved), N IV (1486 Å), C IV (1548, 1550 Å), He II (1640 Å), and O III] (1660, 1666 Å). The emission line-like feature near 1695 Å is instrumental.
Table 1 shows the observed FUV line intensities averaged over the SNR. The C IV, He II, and O III] line profiles were fitted with a Gaussian line profile and a local linear background, while the C III and O VI 1032 Å lines required an additional Gaussian line profile to fit airglow lines adjacent to C III and O VI 1032. The O VI doublet intensity was calculated by multiplying the 1032 Å line intensity by 1.5 (assuming a 2:1 ratio between 1032, 1038) since SPEAR does not have the spectral resolution necessary to resolve O VI 1038 and C II∗ 1037. For C III and O VI, we assumed that the average intensity calculated from areas with sky coverage applied to the entire SNR. Since the Vela SNR appears to be faint at the edges, it is likely that the intensities are slightly overestimated. The estimated systematic uncertainty in the SPEAR sensitivity is (Edelstein et al., 2005a). The Voyager 2 UVS measurements of O VI and C III line intensities at 28 Å resolution (BVL) are in agreement within a factor of two below SPEAR measurements in an area near () UVS pointings. The global observed O VI:C III ratio is , consistent within a factor of about two (both above and below) reported by BVL.
We apply multiplicative correction factors (shown in Table 1) to the observed global FUV luminosities, presuming a diameter of and distance of 250 pc, to derive dereddened luminosities. These correction factors were calculated by Sankrit et al. (2003) by assuming R=3.1 for selective extinction, E(B-V)=0.1 (Wallerstein & Balick, 1990), and using the extinction curve suggested by Fitzpatrick (1999). The integrated C III or O VI line luminosity can exceed the entire 0.1 - 2.5 keV luminosity, ergs s-1 (Lu & Aschenbach, 2000), by more than an order of magnitude, confirming the importance of the FUV waveband to SNR cooling.
Vela’s global FUV luminosity can be compared with that of the Cygnus Loop (Blair et al., 1991). Vela is about five times less luminous than Cygnus in the X-ray and in C IV, about twice as faint in O VI, and is equally as luminous in C III. The observed O VI:C III ratio of Cygnus is , illustrating the relatively large fraction of slower shocks in Vela compared with Cygnus. For Cygnus, Rasmussen & Martin (1991) showed that the O VI luminosity is at least as much as the 0.1–4 keV X-ray luminosity (Ku et al., 1984); the combined O VI, C III, C IV luminosity was found to be ten times as large as the X-ray luminosity (Blair et al., 1991). In both the Cygnus Loop and Vela, the supernova blast wave is expanding into inhomogeneous surroundings, and the radiative shocks in the denser interaction regions emit strongly in the FUV.
5 Summary and Future Work
We have presented global FUV spectral images and spectra of the Vela SNR. Our data indicate inhomogeneous shock-induced emission from the SNR surface. The images show limb brightening and knots of emission. The spectra are consistent with past FUV observations of Vela. The global FUV luminosities of emission lines can exceed the soft X-ray luminosity by an order of magnitude, providing an efficient cooling channel to the SNR.
The data will be used to compare the global FUV morphology with images in other wavebands and examine how the SNR evolves and interacts with the ambient ISM. SPEAR spectra toward previously observed regions (ex. Raymond et al., 1997; Sankrit et al., 2001) will be modeled in detail to determine the physical properties of the regions. Mapping the O VI:C III ratio will allow us to map the distribution of shock velocities across Vela. Furthermore, the global SPEAR spectra can be compared with those of neighboring regions to investigate Vela’s association with the Gum nebula.
References
- Aschenbach et al. (1995) Aschenbach, B., Egger, R., & Trümper, J. 1995, Nature, 396, 587
- Blair et al. (1991) Blair, W. P., Long, K. S., Vancura, O., & Holberg, J. B. 1991, ApJ, 374, 202
- Blair et al. (1995) Blair, W. P., Vancura, O., & Long, K. S. 1995, AJ, 110, 312
- Bock et al. (1998) Bock, D. C.-J., Turtle, A. J., & Green, A. J. 1998, AJ, 116, 1886
- Cha et al. (1999) Cha, A. N., Sembach, K. R., & Danks, A. C. 1999, ApJ, 515, L25
- Dere et al. (1997) Dere, K. P., Landi, E., Mason, H. E., Monsignori Fossi, B. C., & Young, P. R. 1997, ApJS, 125, 149
- Edelstein et al. (2005a) Edelstein, J., Korpela, E. J., Adlofo, J., Bowen, M., Feuerstein, W. M., Hull, J., Jelinsky, S., Nishikida, K., McKee, K., Berg, P., Chung, R., Fischer, J., Min, K. W., Oh, S.-H., Rhee, J.-G., Ryu, K., Shinn, J.-H., Han, W., Lee, D.-H., Seon, K.-I., Jin, H., Yuk, I.-S., Park, J.-H., & Nam, U.-W. 2005a, ApJ, submitted
- Edelstein et al. (2005b) Edelstein, J., Min, K. W., Han, W., Korpela, E. J., Nishikida, K., Welsh, B. Y., Heiles, C., Feuerstein, W. M., Adlofo, J., Bowen, M., McKee, K., Lim, J.-T., Ryu, K., Shinn, J.-H., Nam, U.-W., Park, J.-H., Yuk, I.-S., Jin, H., Seon, K.-I., Lee, D.-H., & Sim, E. 2005b, ApJ, submitted
- Fitzpatrick (1999) Fitzpatrick, E. L. 1999, PASP, 111, 63
- Haslam et al. (1982) Haslam, C. G. T., Stoffel, H., Salter, C. J., & Wilson, W. E. 1982, A&AS, 47, 1
- Jenkins et al. (1998) Jenkins, E. B., Tripp, T. M., Fitzpatrick, E. L., Lindler, D., Danks, A. C., Beck, T. L., Bowers, C. W., Joseph, C. L., Kaiser, M. E., Kimble, R. A., Kraemer, S. B., Robinson, R. D., Timothy, J. G., Valenti, J. A., & Woodgate, B. E. 1998, ApJ, 492, L147
- Jenkins & Wallerstein (1995) Jenkins, E. B. & Wallerstein, G. 1995, ApJ, 440, 227
- Jenkins et al. (1976a) Jenkins, E. B., Wallerstein, G., & Silk, J. 1976a, ApJ, 209, L87
- Jenkins et al. (1976b) —. 1976b, ApJS, 32, 681
- Jenkins et al. (1984) Jenkins, E. B., Wallerstein, G., & Silk, J. 1984, ApJ, 278, 649
- Ku et al. (1984) Ku, W. H.-M., Kahn, S. M., Pisarski, R., & Long, K. S. 1984, ApJ, 278, 615
- Lu & Aschenbach (2000) Lu, F. J. & Aschenbach, B. 2000, A&A, 362, 1083
- Nichols & Slavin (2004) Nichols, J. S. & Slavin, J. D. 2004, ApJ, 610, 285
- Rasmussen & Martin (1991) Rasmussen, A. & Martin, C. 1991, ApJ, 396, 103L
- Raymond et al. (1997) Raymond, J. C., Blair, W. P., Long, K. S., Vancura, O., Edgar, R. J., Morse, J., Hartigan, P., & Sanders, W. T. 1997, ApJ, 482, 881
- Raymond et al. (1991) Raymond, J. C., Wallerstein, G., & Balick, B. 1991, ApJ, 383, 226
- Reichley et al. (1970) Reichley, P. E., Downs, G. S., & Morris, G. A. 1970, ApJ, 159, L35
- Sankrit (2004) Sankrit, R. 2004, in Proceedings of the conference “How Does The Galaxy Work?”, ed. E. J. Alfaro, E. Perez, & J. Franco (Dordrecht; London; Kluwer Academic), 177
- Sankrit et al. (2003) Sankrit, R., Blair, W. P., & Raymond, J. C. 2003, ApJ, 587, 242
- Sankrit et al. (2001) Sankrit, R., Shelton, R. L., Blair, W. P., Sembach, K. R., & Jenkins, E. B. 2001, ApJ, 549, 416
- Slavin et al. (2004) Slavin, J. D., Nichols, J. S., & Blair, W. P. 2004, ApJ, 606, 900
- Wallerstein & Balick (1990) Wallerstein, G. & Balick, B. 1990, MNRAS, 245, 701
- Young et al. (2003) Young, P. R., Del Zanna, G., Landi, E., Dere, K. P., Mason, H. E., & Landini, M. 2003, ApJS, 144, 135
| Species | C III | O VI | C IV | He II | O III] | X-ray |
|---|---|---|---|---|---|---|
| Observed intensity () | 2.6 | 2.7 | 2.3 | 0.5 | 0.5 | |
| Reddening correction | 4.47 | 3.73 | 2.07 | 2.03 | 2.03 | |
| Dereddened luminosity ( ergs s-1) | 26.8 | 22.7 | 8.0 | 1.3 | 1.5 | 2.2 |