Keplerian discs around post-AGB stars:
a common phenomenon?
††thanks: Based on observations with the P7 photometer at the m
Swiss Telescope, La Silla (Chile) and at the Flemish Mercator
Telescope, La Palma (Spain) and on observations with the Submillimetre
Common-User Bolometer Array (SCUBA) at the James Clerk Maxwell
Telescope (JCMT), Mauna Kea, Hawaii.
Abstract
Aims. We aim at showing that the broad-band SED characteristics of our sample of post-AGB stars are best interpreted, assuming the circumstellar dust is stored in Keplerian rotating passive discs.
Methods. We present a homogeneous and systematic study of the Spectral Energy Distributions (SEDs) of a sample of 51 post-AGB objects. The selection criteria to define the whole sample were tuned to cover the broad-band characteristics of known binary post-AGB stars. The whole sample includes 20 dusty RV Tauri stars from the General Catalogue of Variable Stars (GCVS). We supplemented our own Geneva optical photometry with literature data to cover a broad range of fluxes from the UV to the far-IR.
Results. All the SEDs display very similar characteristics: a large IR excess with a dust excess starting near the sublimation temperature, irrespective of the effective temperature of the central star. Moreover, when available, the long wavelength fluxes show a black-body slope indicative of the presence of a component of large mm sized grains.
Conclusions. We argue that in all systems, gravitationally bound dusty discs are present. The discs must be puffed-up to cover a large opening angle for the central star and we argue that the discs have some similarity with the passive discs detected around young stellar objects. We interpret the presence of a disc to be a signature for binarity of the central object, but this will need confirmation by long-term monitoring of the radial velocities. We argue that dusty RV Tauri stars are those binaries which happen to be in the Population II instability strip.
Key Words.:
stars: AGB and post-AGB – stars: binaries: general – stars: circumstellar matter1 Introduction
Post-AGB stars are low and intermediate initial mass (- M☉) stars which have suffered a large and dusty mass-loss phase at the end of the Asymptotic Giant Branch (AGB) during which almost the whole stellar envelope was expelled. They are evolving at constant luminosity on a fast evolutionary track in which the central star crosses the HR-diagram from a cool AGB photosphere to the ionizing temperature of the central star of a Planetary Nebula (PN). Given the small evolutionary timescale of about years, post-AGB stars are rare and not many are known (e.g Szczerba et al. 2001; Van Winckel 2003).
Discussions on the morphology of PNe usually start with a display of the aesthetic pictures of the Hubble Space Telescope (HST) showing the complex geometry and structure of the nebulae, immediately followed by the puzzling and contradictory finding that, on the AGB, the mass-loss is found to be spherically symmetric. During the transition time, the star and circumstellar envelope must undergo fundamental and rapid changes in structure, mass-loss mode and geometry which are still badly understood. The debate on which physical mechanisms are driving the morphology changes gained even more impetus from the finding that also resolved cooler post-AGB stars or Proto-Planetary Nebulae (PPNe) display a surprisingly wide variety in shapes and structures, very early in their post-AGB evolution (Balick & Frank 2002, and references therein).
In a survey of 27 PPNe, 21 were found to be resolved (Ueta et al. 2000). Moreover, the degree of asymmetry could be linked to the pole-to-equator density contrast, as determined on the basis of high spatial resolution mid-infrared images (Meixner et al. 1999). Recently also Gledhill (2005) found evidence for axi-symmetry in the dust density in his polarimetric imaging survey of candidate post-AGB stars. The detached shells correspond to stars with an optically thin expanding circumstellar envelope whereas the bipolar and unresolved targets have optically thick dust structures, probably in the form of discs. It is suggested once again that this bifurcation in morphology is rooted in the presence or absence of a binary companion, which determines whether or not a disc forms.
Stunning kinematic information resulted from the extensive CO survey of Bujarrabal et al. (2001): it appears to be a fundamental property of the omnipresent fast molecular outflow in PPNe, that it carries a huge amount of linear momentum, up to times the momentum available for a radiation driven wind. Clearly, other momentum sources have to be explored. Some molecular jets are resolved by high spatial resolution imaging (Sahai 2004). The formation process of the strongly collimated jets is, however, still badly understood. An intriguing suggestion is that the processes similar to the jet formation in low-mass young stellar objects operate and that the jets are born in accretion discs. This mechanism requires a significant amount of mass orbiting the post-AGB star. Such a disc could be present, but likely only in binary stars. Testing of such an hypothesis is severely hampered by the lack of observational information on binarity in PNe and PPNe but also on our poor theoretical understanding of AGB evolution in binary systems. Note that most objects which were detected in CO are strongly embedded and the sample is probably biased towards more massive PPNe.
Probing binarity in PNe and embedded PPNe directly with radial velocity monitoring is not easy. For optically bright post-AGB stars, this is different and some famous examples exist in which it is clear that the binary nature of the central object must have played a key role in the evolution of the system.
The most famous example is certainly HD 44179, the central star of the Red Rectangle nebula. It displays a huge and broad IR excess. The IR luminosity is times stronger than the optical luminosity (Leinert & Haas 1989; Waelkens et al. 1996). Van Winckel et al. (1995) have shown that HD 44179 is a spectroscopic binary with an orbital period of days. The eccentricity is a remarkably high . Since its discovery by Cohen et al. (1975), HD 44179 has often been used as an archetypical example of a C-rich post-AGB object, but it is now generally accepted that many of the remarkable phenomena and the peculiar morphology of the nebula (for an overview see Cohen et al. 2004) are closely related to the presence of a stable circumbinary disc around the binary central star. The longevity of the disc was dramatically confirmed by the detection of cool O-rich crystalline silicate dust grains in the disc (Waters et al. 1998). The mixed chemistry is best explained assuming the formation of the O-rich disc predated the more recent C-rich transition of the central object. Recent Spitzer data show, however, that also far from the central star, the nebula appears to have a dust component which is O-rich (Markwick-Kemper et al. 2005). The (chemical) history of the binary, disc and nebula is therefore far from understood. The disc is resolved in ground-based high spatial-resolution imaging at optical and near-IR wavelengths (Men’shchikov et al. 2002, and references therein) as well as in HST optical images (Cohen et al. 2004). The disc was also resolved in interferometric CO(2-1) maps, and the Keplerian kinematics of the disc were directly detected (Bujarrabal et al. 2003, 2005). HD 44179 shows a considerable amount of dust processing in the disc with indications of the presence of very large grains (Jura et al. 1997) and possibly even macro-structures (Jura & Turner 1998).
Another remarkable evolved object with a long-lived disc is HR 4049. It is a binary with an orbital period of days with a remarkably high eccentricity of . Also in this object, the circumstellar material shows a mixed chemistry with both carbon rich and oxygen rich features. The SED of the dust is also very peculiar as it can be fitted with a single black-body of about 1150 K, from m down to m. These SED characteristics are very constraining and the best model for the circumstellar material is, that the dust is trapped in a very opaque dust torus at Keplerian rotation (Dominik et al. 2003). It is clear that also in this object the dusty disc plays a lead role in the (future) evolution. Other examples exist and there is substantial observational evidence that the systems are all likely surrounded by a circumstellar orbiting disc (Van Winckel 2003). Note that so far only for the Red Rectangle the Keplerian disc is spatio-kinematically resolved by CO interferometric maps (Bujarrabal et al. 2005).
To gain insight in the evolution of binary systems and their circumstellar material, we report in this contribution on a homogeneous and systematic study of a sample of objects with similar IR characteristics as the known binary post-AGB stars. The main aim is to study the broad-band SEDs in a systematic way, in order to gain insight in the possible evolutionary link between the different objects.
Our sample and the selection criteria are presented in Sect. 2. In Sect. 3 we present our photometric data complemented with the literature values and the results of the large all sky surveys. In Sect. 4 we present the detailed Spectral Energy Distribution (SED) construction of all individual objects. Distances to the objects are estimated in Sect. 5. We end this extensive study with a detailed discussion in Sect. 6. Conclusions are summarized in Sect. 7.
2 Programme stars
Our total sample of 51 stars was defined on several observational criteria inspired by the characteristics of known post-AGB stars in binary systems. The whole sample is given in Table 1. Besides these proven binaries, we discuss also RV Tauri stars with IRAS detections of good quality and a sample of newly identified objects, originally found by one of us (T. Lloyd Evans) in search of new candidate RV Tauri stars.
| 1 | 2 | 3 | 4 | 5 | 6 | 7 | 8 | 9 | 10 | 11 | 12 |
| No | IRAS number | HD number or | Spectral | (J2000) | (J2000) | [Fe/H] | Reference Model Parameters | Type | Reference Binarity | ||
| GCVS name | type | (h m s) | () | (K) | (cgs) | ||||||
| 1 | IRAS 041665719 | TW Cam | G3I | 04 20 48.1 | 57 26 26 | 4800 | 0.0 | Giridhar et al. (2000) | RV Tauri | ||
| 2 | IRAS 044402605 | RV Tau | G2I | 04 47 06.8 | 26 10 44 | 4500 | 0.0 | Giridhar et al. (2000) | RV Tauri | ||
| 3 | IRAS 052082035 | M0e+F | 05 22 59.423 | 20 32 53.03 | 4000 | 0.5 | from spectral type | New Sample | |||
| 4 | IRAS 060341354 | DY Ori | G0I | 06 06 12.3 | 13 53 09 | 6000 | 1.5 | Gonzalez et al. (1997b) | RV Tauri | ||
| 5 | IRAS 060720953 | CT Ori | F9I | 06 09 57.4 | 09 52 35 | 5500 | 1.0 | Gonzalez et al. (1997a) | RV Tauri | ||
| 6 | IRAS 061082743 | SU Gem | G5I | 06 14 00.8 | 27 42 12 | 5750 | 1.125 | Wahlgren (1992) | RV Tauri | ||
| 7 | IRAS 061601701 | UY CMa | G0V | 06 18 16.367 | 17 02 34.72 | 5500 | 1.0 | from spectral type | RV Tauri | ||
| 8 | IRAS 061761036 | HD 44179 | F1I | 06 19 58.2160 | 10 38 14.691 | 7500 | 0.8 | Waelkens et al. (1992) | post-AGB | Van Winckel et al. (1995) | |
| 9 | IRAS 063385333 | HD 46703 | F3I | 06 37 52.4253 | 53 31 01.957 | 6250 | 1.0 | from spectrum | post-AGB | Hrivnak, private communication | |
| 10 | IRAS 064723713 | ST Pup | F7I | 06 48 56.4131 | 37 16 33.332 | 5750 | 0.5 | Gonzalez & Wallerstein (1996) | RV Tauri | Gonzalez & Wallerstein (1996) | |
| 11 | IRAS 070081050 | HD 52961 | F6I | 07 03 39.6314 | 10 46 13.067 | 6000 | 0.5 | Waelkens et al. (1991b) | post-AGB | Waelkens et al. (1992) | |
| 12 | IRAS 071402321 | SAO 173329 | F5I | 07 16 08.271 | 23 27 01.61 | 7000 | 1.5 | Van Winckel (1997) | post-AGB | Van Winckel et al. (1995) | |
| 13 | IRAS 072840940 | U Mon | G0I | 07 30 47.5 | 09 46 37 | 5000 | 0.0 | Giridhar et al. (2000) | RV Tauri | Pollard & Cottrell (1995) | |
| 14 | IRAS 080113627 | AR Pup | F0I | 08 03 01.1 | 36 35 47 | 6000 | 1.5 | Gonzalez et al. (1997b) | RV Tauri | ||
| 15 | IRAS 085444431 | F3 | 08 56 14.182 | 44 43 10.73 | 7250 | 1.5 | Maas et al. (2003) | New Sample | Maas et al. (2003) | ||
| 16 | IRAS 090602807 | F5 | 09 08 10.1 | 28 19 10 | 6500 | 1.5 | Maas et al. (2005) | New Sample | |||
| 17 | IRAS 091444933 | G0 | 09 16 09.1 | 49 46 06 | 5750 | 0.5 | Maas et al. (2005) | New Sample | |||
| 18 | IRAS 092566324 | IW Car | F7I | 09 26 53.4 | 63 37 48 | 6700 | 2.0 | Giridhar et al. (1994) | RV Tauri | ||
| 19 | IRAS 094004733 | M0 | 09 41 52.9 | 47 47 03 | New Sample | ||||||
| 20 | IRAS 095387622 | G0 | 09 53 58.5 | 76 36 53 | 5500 | 1.0 | Maas et al. (2005) | New Sample | |||
| 21 | IRAS 101582844 | HR 4049 | A6I | 10 18 07.5903 | 28 59 31.201 | 7500 | 1.0 | Dominik et al. (2003) | post-AGB | Waelkens et al. (1991b) | |
| 22 | IRAS 101745704 | K:rr | 10 19 18.1 | 57 19 36 | New Sample | ||||||
| 23 | IRAS 104565712 | HD 93662 | K5 | 10 47 38.3965 | 57 28 02.679 | 4250 | 0.5 | from spectral type | New Sample | ||
| 24 | IRAS 110006153 | HD 95767 | F0I | 11 02 04.314 | 62 09 42.84 | 7600 | 2.0 | Van Winckel (1997) | post-AGB | Van Winckel et al. (1995) | |
| 25 | IRAS 111185726 | GK Car | M0I | 11 14 01.3 | 57 43 09 | RV Tauri | |||||
| 26 | IRAS 114720800 | F5I | 11 49 48.5 | 08 17 21 | 5750 | 1.0 | from spectrum | ||||
| 27 | IRAS 120674508 | RU Cen | F6I | 12 09 23.7 | 45 25 35 | 6000 | 1.5 | Maas et al. (2002) | RV Tauri | ||
| 28 | IRAS 121854856 | SX Cen | G3V | 12 21 12.6 | 49 12 41 | 6000 | 1.0 | Maas et al. (2002) | RV Tauri | Maas et al. (2002) | |
| 29 | IRAS 122224652 | HD 108015 | F3Ib | 12 24 53.501 | 47 09 07.51 | 7000 | 1.5 | Van Winckel (1997) | post-AGB | ||
| 30 | IRAS 132588103 | G5 De | 13 31 07.1 | 81 18 30 | New Sample | ||||||
| 31 | EN TrA | F2Ib | 14 57 00.6847 | 68 50 22.879 | 6000 | 1.0 | Van Winckel (1997) | RV Tauri | Van Winckel et al. (1995) | ||
| 32 | IRAS 154695311 | F3 | 15 50 44.0 | 53 20 44 | 7500 | 1.5 | Maas et al. (2005) | New Sample | |||
| 33 | IRAS 155565444 | F8 | 15 59 32.1 | 54 53 18 | New Sample | ||||||
| 34 | IRAS 162303410 | F8 | 16 26 20.29 | 34 17 12.3 | 6250 | 1.0 | Maas et al. (2005) | New Sample | |||
| 35 | IRAS 170384815 | G2p(R)e | 17 07 36.3 | 48 19 08 | 4750 | 0.5 | Maas et al. (2005) | New Sample | |||
| 36 | IRAS 172334330 | G0p(R) | 17 26 57.5 | 43 33 13 | 6250 | 1.5 | Maas et al. (2005) | New Sample | |||
| 37 | IRAS 172434348 | LR Sco | G2 | 17 27 56.1 | 43 50 48 | 6250 | 0.5 | Maas et al. (2005) | New Sample | ||
| 38 | IRAS 175342603 | 89 Her | F3I | 17 55 25.1889 | 26 02 59.966 | 6500 | 1.0 | Waters et al. (1993) | post-AGB | Waters et al. (1993) | |
| 39 | IRAS 175303348 | AI Sco | G4I | 17 56 18.5 | 33 48 47 | 5000 | 0.0 | from spectrum | RV Tauri | ||
| 40 | IRAS 181230511 | G5 | 18 14 49.4 | 05 12 55 | 5000 | 0.5 | from spectral type | New Sample | |||
| 41 | IRAS 181583445 | F6 | 18 19 13.6 | 34 44 32 | 6500 | 1.5 | from spectral type | New Sample | |||
| 42 | IRAS 182812149 | AC Her | F4I | 18 30 16.2 | 21 52 00 | 5500 | 0.5 | Van Winckel et al. (1998) | RV Tauri | Van Winckel et al. (1998) | |
| 43 | IRAS 185640814 | AD Aql | G8I | 18 59 08.1 | 08 10 14 | 6300 | 1.25 | Giridhar et al. (1998) | RV Tauri | ||
| 44 | IRAS 191250343 | F2 | 19 15 00.8 | 03 48 41 | 7750 | 1.0 | Maas et al. (2005) | New Sample | |||
| 45 | IRAS 191632745 | EP Lyr | A4I | 19 18 17.5 | 27 50 38 | 7000 | 2.0 | Gonzalez et al. (1997b) | RV Tauri | ||
| 46 | IRAS 191570247 | F3 | 19 18 22.5 | 02 42 09 | 7750 | 1.0 | Maas et al. (2005) | New Sample | |||
| 47 | IRAS 200561834 | QY Sge | G0 De | 20 07 54.8 | 18 42 57 | 5850 | 0.7 | Rao et al. (2002) | New Sample | ||
| 48 | IRAS 201171634 | R Sge | G0I | 20 14 03.8 | 16 43 35 | 5750 | 0.0 | Gonzalez et al. (1997b) | RV Tauri | ||
| 49 | IRAS 203432625 | V Vul | G8I | 20 36 31.8 | 26 36 17 | 5250 | 1.0 | from spectral type | RV Tauri | ||
| 50 | IRAS 223271731 | HD 213985 | A2I | 22 35 27.5259 | 17 15 26.889 | 8250 | 1.5 | from spectrum | post-AGB | Van Winckel et al. (1995) | |
| 51 | BD39∘4926 | A9I | 22 46 11.2273 | 40 06 26.294 | 7500 | 1.2 | Van Winckel et al. (1995) | post-AGB | Kodaira et al. (1970) |
2.1 Confirmed binary post-AGB stars
The group of binary post-AGB stars in our sample was assembled in a rather coincidental way on the basis of independent detailed star-to-star analyses. We included the proven binaries in our programme star sample and in Col. of Table 1 we give a reference where the orbital motion of the objects was discussed. The orbital elements themselves are listed in Table 5.
The photospheres of several binary post-AGB stars (e.g. HR 4049 (Lambert et al. 1988; Waelkens et al. 1991a), HD 44179 (Waelkens et al. 1992), HD 52961 (Van Winckel et al. 1992) and BD39∘4926 (Kodaira et al. 1970)) are strongly affected by a poorly understood selective depletion process. The basic scenario of this process is that circumstellar gas is separated from the dust and subsequently re-accreted onto the star (Mathis & Lamers 1992; Waters et al. 1992). Since that gas is devoid of refractories, the photosphere will be altered chemically, and this may result in very Fe-poor stars which are rich in non-refractories like Zn and S. This process is very efficient in the four named binaries where there is observational evidence for the presence of a dusty stable reservoir (Van Winckel et al. 1995). Efficient separation of circumstellar gas and dust is not evident and Waters et al. (1992) argued that the most favourable circumstances may occur if the circumstellar dust is indeed trapped in a stable disc. Note that for one strongly depleted object, BD39∘4926, there was no IR excess detected by IRAS.
In the few cases where ISO spectra are available, the dust processing is strong, which results in a large crystallinity fraction of the grains (e.g. Molster et al. 2002). Also the dust grain size distribution is different in discs than in outflows and where long wavelength fluxes are available, they indicate the presence of large, m sized and even cm sized dust grains (e.g. Shenton et al. 1995).
Obviously such a disc must play an important role in these systems and, although the indirect observational evidence for the presence of a stable disc is well established in the binary stars, the actual structure let alone the formation, stability and evolution are not well understood. Note that only for HD 44179 is this disc spatially resolved. For all other objects, the presence of the disc was postulated.
2.2 Classical RV Tauri stars from the General Catalogue of Variable Stars with strong IR excess
RV Tauri stars form a class of classical pulsating variables. They are luminous (I-II) supergiant pulsating variables, the light curve of which shows alternating deep and shallow minima with a formal period (measured between one deep minimum and the next) of 30 to 150 days and a brightness range of up to four magnitudes. The spectral type is typically F to G at minimum and G to K at maximum. There are two main photometric varieties of RV Tauri stars: the RVa types maintain a roughly constant mean brightness; RVb types show on top of their pulsational period a longer term ( to days) periodicity.
With their high luminosity and often large IR excesses due to thermal radiation from circumstellar dust, there is general agreement that RV Tauri stars are low-mass objects in transition from the Asymptotic Giant Branch (AGB) to white dwarfs (Jura 1986). It was noted already in the seventies that many RV Tauri stars show a considerable near-IR excess caused by a hot dust component (Gehrz & Ney 1972; Gehrz 1972; Lloyd Evans 1985), which was attributed to the possible presence of a dusty disc. Morris (1987) suggested that circumstellar dust could indeed exist in a disc structure in binary systems, either in a circumbinary disc or in a disc around one of the components. The weak circumstellar CO emission (e.g. Bujarrabal et al. 1988) together with the black-body spectral index at long wavelengths observed in some RV Tauri stars (De Ruyter et al. 2005) corroborate the conclusion that the circumstellar dust is not freely expanding but confined.
In recent years it has become clear that also many RV Tauri photospheres show chemical anomalies pointing to an efficient depletion of refractory elements (Giridhar et al. 1994; Giridhar & Ferro 1995; Giridhar et al. 1998, 2000; Gonzalez et al. 1997b, a; Van Winckel et al. 1998; Maas et al. 2002). The many affected stars show that the depletion process is a very common phenomenon in evolved stars. Giridhar et al. (2005) show that depletion in RV Tauri stars is less strong when the central star is cooler, which is interpreted as pointing to a stronger dilution due to a deeper convective envelope in the cooler stars. The depletion patterns are not seen in objects for which the intrinsic metallicity is smaller than about one tenth solar ([/]).
It is clear that the observational restriction that depletion is only active in binary stars, which was formulated when only four extremely depleted objects were known, has become much less evident with the many new detections. Direct evidence for binarity, from radial velocity measurements, is difficult to obtain since RV Tauri stars have large pulsational amplitudes. Moreover, they often show the presence of shocks in the line-forming region of the photosphere making the very determination of the radial velocity difficult (e.g. Gillet et al. 1990). Nonetheless orbital elements have been determined for quite a few classical RV Tauri stars: U Mon (Pollard & Cottrell 1995), AC Her (Van Winckel et al. 1998), EN TrA (Van Winckel et al. 1999), SX Cen (Maas et al. 2002) and orbital motion is also found for IW Car (Pollard et al. 1997), EP Lyr (Gonzalez et al. 1997b) and RU Cen (Maas et al. 2002).
In this contribution we analyse the broad-band SEDs of the RV Tauri stars of the GCVS with a reliable IRAS measurement at m (e.g. Jura 1986) and compare them with the SEDs of similar objects, which are not in the Pop II Cepheid instability strip.
2.3 New Sample of candidate RV Tauri stars
Lloyd Evans (1985) and Raveendran (1989) showed that the RV Tauri stars are located in a well-defined and relatively thinly-populated part of the IRAS colour-colour diagram. The defining rectangle is:
| (1) |
Lloyd Evans (1997) searched for new examples of RV Tauri stars, as stars with dusty discs, in the IRAS Catalogue, and found the stars of the ‘new sample’ discussed in this paper. The presence in this sample of stars with the infrared properties of the GCVS sample of RV Tauri stars, but which fell outside the instability strip as judged from their spectral types and which lacked the large-amplitude RV Tauri variability, suggested that RV Tauri stars are those stars with dusty discs which are currently located within the instability strip (Lloyd Evans 1999).
Maas et al. (2005) presented a chemical abundance analysis on the basis of high signal-to-noise and high resolution spectra for 12 stars of the newly defined sample. They found that 9 stars are affected by the depletion process. In a detailed study of one object, IRAS 08544 (Maas et al. 2003); orbital elements were found which show that this star must have undergone severe binary interaction when it was an (asymptotic) giant.
In this contribution we analyse the broad-band SEDs of all 20 newly characterized stars of this sample.
2.4 Total Sample
The 51 objects of our sample are presented in Table 1. In Col. 11 we differentiate between the several subtypes. Statistical studies on the occurrence and characteristics of post-AGB stars with respect to AGB stars and/or Planetary Nebulae (PNe) do not exist yet. In the most extensive catalogue description found in the literature, Szczerba et al. (2001) consider a Galactic sample of about 220 post-AGB stars known at that time. Although the overlap between the specific sample discussed here, and the total sample of Szczerba et al. (2001) is far from complete, the sample of 51 objects discussed here, forms a significant population of post-AGB stars known to date. Note that our sample was defined on the basis of a specific set of criteria explained above and our sample is not meant to cover all known evolved stars with similar SED characteristics.
3 Broad-band photometric data
In order to reconstruct the complete SEDs of our programme stars, we combined different sets of broad-band photometric data: our own Geneva optical photometry, supplemented with UV, optical, near-IR, far-IR and submillimetre photometry found in the literature.
The main difficulty in constructing the SEDs of pulsating stars with large amplitudes, like the RV Tauri objects, is the acquisition of equally phased data over a wide spectral domain. Since these data are not available, we limited our study of the broad-band energetics to the phases of minimal and maximal covered brightness.
Geneva optical photometry
We acquired Geneva optical photometry at random epochs with the m Swiss Telescope at La Silla and with the Flemish Mercator Telescope at La Palma, using the refurbished Geneva photometer P7 (Raskin et al. 2004). Our total data set was scanned for the maximum and minimum magnitudes (see Table 6). Observation dates, the number of measurements and the total timebases of these maxima and minima are given as well. Additional Geneva optical photometry was found in the Geneva database: the General Catalogue of Photometric Data (GCPD,http://obswww.unige.ch/gcpd/gcpd.html). Note these data are only given for completeness, but were not used in our analysis; except for IRAS 10456 for which the GCPD data are our only Geneva fluxes.
photometry
photometry for the newly-identified objects was obtained from the South African Astronomical Observatory (SAAO) service observing programme (Table 7). This uses the m Telescope and the m Automatic Photometric Telescope (APT) at Sutherland. If the data of the star show large variations mainly due to a large variability of the star, we plot both minima and maxima. If the number of data points available is too low or if there are no big variations, we use a mean .
We also searched for Johnson and Cousins broad-band photometry in the literature and these data are given in Table 7 as well.
Near-IR data
photometry of the newly-identified objects was obtained by T. Lloyd Evans with the m reflector of the South African Astronomical Observatory.
These data points were complemented with near-IR data from the 2 MASS and DENIS projects and with other data points from the literature (Table 8).
Far-IR data
For the characterization of the longer wavelength part of the SEDs we use far-IR data from the IRAS Point Source Catalogue (Beichman et al. 1988, Table 9); for some stars data from the MSX Infrared Point Source Catalogue (Egan et al. 2003) are also available (Table 10). The IRAS satellite had four passbands, at , , and m, respectively. The SPIRIT III instrument on board the MSX satellite had 6 passbands, at , , , , and m.
Submillimetre data
For six stars (TW Cam, RV Tau, SU Gem, UY CMa, U Mon and AC Her) submillimetre data (see Table 11) are available from De Ruyter et al. (2005), for HR 4049 and IRAS 20056 we use data from the other literature. For HR 4049, HD 52961 and 89 Her, we have some newly determined SCUBA 850 micron continuum measurements. The observations were carried out with the 15 m James Clerk Maxwell Telescope (JCMT) at Mauna Kea, Hawaii, during March-April 1999 (programme M99AN08). SCUBA (Holland et al. 1999) was operated in photometry mode to simultaneously obtain data at m and m. For the data reduction, the standard software SURF was used with Mars as a flux calibrator. Table 2 details the new m continuum measurements, while for m, no significant signal was detected. Note that the new m SCUBA data point for HR 4049 is, within the errors, the same as the one in Dominik et al. (2003).
| No | Name | (mJy) | |
|---|---|---|---|
| 11 | HD 52961 | 2.8 | 1.9 |
| 21 | HR 4049 | 8.7 | 2.8 |
| 38 | 89 Her | 40.9 | 2.4 |
For AC Her we have a flux point at mm from Shenton et al. (1995).
Other
At the short wavelength side, we use the IUE data (International Ultraviolet Explorer, m - m) from the newly extracted spectral data release (INES Archive Data Server). If there were multiple spectra available, we only considered the maximal flux.
4 Spectral Energy Distributions
We analyse the SEDs of our sample stars in a homogeneous and systematic way.
4.1 The stars photosphere: model parameters
The determination of the model atmospherical parameters and , and the overall metallicity [/] is based on the analysis of high resolution spectra used in the chemical analyses of the stars. Those spectra are preferentially taken at maximum light, because of the minimal molecular veiling during the hotter phase in the light curve (Giridhar et al. 2000).
For most stars we use model parameters deduced from our own spectra (e.g Van Winckel 1997; Maas et al. 2003, 2005), for others we use values found in the literature. For some of our sample stars (IRAS 05208, UY CMa, IRAS 10456, IRAS 18123, IRAS 18158, V Vul), however, we don’t have a spectrum nor do we find any estimates for the photospheric parameters in the literature. Here we deduce the parameters on the basis of the spectral type of the star. And for some others (IRAS 09400, IRAS 10174, GK Car, IRAS 13258, IRAS 15556) we lack optical photometry. The model parameters are given in Table 1, Cols. 7 to 9. The references where we found the parameters are shown in Col. 10.
An appropriate photospheric Kurucz model -based on , and [/]- is used for the unattenuated stellar photospheres (Kurucz 1979).
4.2 Colour excess determination
Light coming from a star is attenuated and reddened by material in the line-of-sight. Note that the total line-of-sight extinction is likely to contain both a circumstellar and an interstellar component.
We estimate the total colour excess by using the average interstellar extinction law given by Savage & Mathis (1979) to deredden the observed maximal UV-optical fluxes. is found by minimizing the difference between the dereddened observed fluxes in the UV-optical, and the appropriate Kurucz model (Kurucz 1979). We scale to the filter which is the reddest filter where no dust excess can be expected. We assume the circumstellar reddening law to be similar to the ISM law. Determining the in this way implies that we don’t correct for the contribution of the grey extinction.
Results are in Table 3. The error on is typically . But changing the stellar models by K in effective temperature causes a change in of about . Thus, together with the error of induced by the uncertainty of the temperature of the underlying photosphere, we have an uncertainty of on the total extinction during maximal light. A distribution of the total colour excesses found for our sample stars is shown in Fig. 1. Note that the total reddening is small for most of the stars. We may thus assume that a situation with only grey extinction would be rather exceptional.

4.3 A first-order approximation: an optically thin dust fit
A broad-band SED has limited diagnostic value for constraining the chemistry and spatial distribution of the circumstellar dust. We apply an optically thin dust model as a simple first-order approximation to fit the SEDs with the prime goal to quantify the differences in SED characteristics between the different objects. We use the optically thin dust model described by Sopka et al. (1985). In this model the dust is assumed to be distributed spherically symmetric around the star from inner radius to outer radius . Since we apply an optically thin model, the geometry of the dust is not constrained as we observe the whole volume and all dust particles contribute to the observed flux.
For more details of the model we refer to De Ruyter et al. (2005). The flux is determined by five parameters: the normalization temperature , the inner radius of the dust shell , the outer radius of the dust shell , the spectral index and the density parameter . Applying a least square minimization the free parameters , , and are determined. Results are given in Table 3.
4.4 SEDs
In Fig 2 the SEDs of a selection of post-AGB stars are given. The other SEDs are given in Fig. 7. The dereddened fluxes are plotted together with the scaled photospheric model representing the unattenuated stellar photosphere. We plotted both minimal (open triangles) and maximal (open rectangles) photometry.


HD 44179 and AR Pup are two rather exceptional stars, for which we adopted another strategy to determine the SEDs. The dust excess for HD 44179 and AR Pup starts even at shorter wavelengths making it impossible to scale the model photosphere to the filter. We therefore scale to the Geneva band data point in our least squares procedure.
The IR excess due to the presence of circumstellar dust, is in all cases very significant with BD39∘4926 a noticeable exception for which no IR excess was found. A general characteristic is that the dust energy distribution peaks at very high temperatures and that there is no evidence for large amounts of cool ( K) dust: the peak of the dust SEDs lies around m and in some cases even bluer. In most cases, the dust excess starts near the dust sublimation temperature.
To determine the amount of energy reprocessed by the dust grains in the circumstellar environment, we compute the energy ratio . We first calculate the stellar flux by numerically integrating the scaled Kurucz model between nm and m. This gives a good estimate of the unattenuated stellar flux. The energy radiated at even shorter and longer wavelengths is only a negligible fraction () of the total stellar flux so we evaluate our wavelength integral boundaries as adequate. Integrating over the IR excess model described in Section 4.3 yields . We note that the ratio (Table 3) is high for % of the objects (larger than %). Assuming the presence of % grey or non-selective extinction and a mean of , reduces with %, which remains, nevertheless, still large. The absorption and thermal re-radiation of the stellar radiation by the circumstellar dust is on average very efficient. In Fig. 3 the distribution of the energy conversion ratios is shown. Note that ratios larger than (for HD 44179, AR Pup, IRAS 17233, IRAS 18158 and IRAS 20056) are omitted in the figure. Like HD 44179 (Cohen et al. 2004) and IRAS 20056 (Menzies & Whitelock 1988; Rao et al. 2002) we suspect that we only see the photosphere of those sources through scattered light. This means that we see these systems nearly edge-on.

For those stars where we have a submillimetre data point (see Table 11) the SED follows a Rayleigh-Jeans slope from the -m flux point redwards. Assuming that the dust emissivity at far-IR wavelengths follows a power law (), the spectral index as determined from the slope between the -m emission and the m flux point is close to zero. The small spectral indices in the range from to for most objects are consistent with the presence of a component of large grains (radius mm) in the circumstellar environment of the stars. For those stars where we lack a submillimetre data point, the spectral index of the long wavelength slope is not well constrained.
Note that the m IRAS fluxes for some stars are affected by Galactic cirrus, so they present upper limits. In the figures an arrow is drawn. This makes it still more difficult to be sure about the slope from the -m flux point redwards.
From all SED characteristics mentioned, we infer that the dust excess in the SEDs is clearly different from what we expect to observe in a post-AGB star where the excess represents the expanding and cooling relic of the strong AGB mass-loss episode(s).
5 Distance estimates
The typical luminosity of a lower mass post-AGB star is expected to be between and . Accurate luminosities of individual post-AGB objects are still largely unavailable since they are generally too far to obtain reliable parallaxes.
In the few cases where reliable Hipparcos parallaxes are available we have a direct probe of the distance and hence luminosity. Results are given in Table 4. Note the large errors on the parallaxes translate in a large error box for the distance and the luminosity determinations. The parallax of HD 44179 can not be used to infer a luminosity because we know that we see only scattered light (Cohen et al. 2004). The same is probably true for AR Pup (see Sect. 4.4).
Alcock et al. (1998) reported the discovery of RV Tauri stars in the Large Magellanic Cloud (LMC). In light- and colour-curve behaviour, the classical RV Tauri stars appeared to be a direct extension of the type II Cepheids to longer periods. We use the P-L relation of Alcock et al. (1998) -derived for the LMC RV Tauri stars- to derive the luminosity for the pulsating objects in our sample. For variables with days we use
| (2) |
Note that the intrinsic scatter is large, implying very significant uncertainties in the estimated absolute magnitudes of the objects. In Eq. 2 we use the fundamental period , defined as the time between a deep and a shallow minimum. The formal period is shown in Table 4. We apply this extension of the period-luminosity relation known for type II Cepheids, for the RV Tauri stars from the GCVS to derive an estimate for their luminosities. Results, together with the bolometric corrections BCV (Bessell et al. 1998) used, are listed in Table 4. The error propagation starting from the errors in the P-L relation are given in the table as well. The objects are indeed luminous, as can be expected from post-AGB objects, but the large scatter in the P-L relation prevents more accurate luminosity estimates.
For the other objects, where we don’t have a pulsation period determination, we take . Note that it is not known whether the P-L relation of the LMC stars is directly applicable to Galactic stars. In general, the luminosities found are smaller than, or equal to, about indicating that the population is of rather low initial mass.
By comparing the integrated fluxes of the scaled Kurucz model with the luminosity deduced from the P-L relation or the default assumed value of , we calculate the distance to the star. The determined distances are shown in Table 4. The propagated error of the poorly calibrated P-L relation, yields very uncertain luminosities and therefore also uncertain distances.
Remark that the luminosities determined by the P-L relation will not be appropriate to stars seen with the dusty disc nearly edge-on. Besides for the well-known example HD 44179, this is likely the case for AR Pup, IRAS 17233, IRAS 18158 and IRAS 20056 for which the distances listed in Table 4 are clearly upper limits.
6 Discussion
We presented the SEDs of all stars in our sample based on literature data supplemented with our own Geneva photometry and -where available- continuum measurements at m (Fig. 2 and Fig. 7). Despite the different criteria for the selection of the three subsamples, it is clear that the broad-band SEDs display a high degree of uniformity. Between extremes like HR 4049 (most compact SED with a single dust temperature) and HD 44179 (largest ), the shape of the SEDs is very similar for all stars.
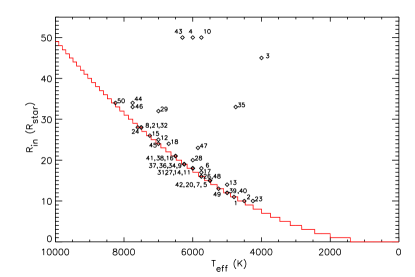
One of the most remarkable features is the start of the dust excess. In Fig. 4 we plot the inner radii of the dust components against the effective temperature for all stars and in all cases, there is dust at or very near sublimation temperature. With typical luminosity estimates, this sublimation temperature edge is at a distance smaller than about 10 AU from the central source. Moreover, the SEDs reveal that the presence of dust, very close to the object, is irrespective of the effective temperature of the central star. Note that none of the objects shows evidence for a present-day dusty mass-loss. We therefore infer that part of the dust must be gravitationally bound: any typical AGB outflow velocity would bring the dust to cooler regions within years.
Within our sample of post-AGB objects considered - confirmed binary post-AGB stars, classical RV Tauri stars and new RV Tauri-like objects - there is a wide range in the strength of the total IR excess, but the shape of the IR excess thus indicates that in all systems, the circumstellar shell is not freely expanding but stored in the system. We argue therefore that the same inner geometry as in the resolved system HD 44179 applies to the whole sample: the objects seem to be surrounded by a Keplerian disc.
From the dust modelling fit it is also clear that the outer radii are not very large either. Objects similar to the enigmatic extreme HR 4049 are UY CMa, U Mon and IRAS 17233 for which the dust temperature gradient observed is very small.
Other indirect indications for the presence of gravitionally bound dust are :
-
-
Despite the significant IR excess, the total for most stars is very small. Efficient redistribution of the stellar flux is clearly in contradiction with the lack of line-of-sight reddening. This implies a significant grey extinction and/or a non-spherically symmetric dust distribution. Since the objects all have a rather small total extinction, the latter is more plausible. A good independent estimate of the ISM contribution to the total extinction in the line-of-sight of all individual objects is still lacking. It must, however, be a rewarding experiment to measure those since it would help in quantifying the characteristics of the broad-band energetics of the individual objects.
-
-
At far-IR and millimetre wavelengths, we are sampling the Rayleigh-Jeans tail of the flux distribution. The spectral index lies, for % of the sample stars, in the range -. The IRAS-submillimetre flux distributions are thus indicative of emission by large ( mm) grains. The presence of such large grains is another indication of discs, where grain growth is facilitated. However, since we do not have submillimetre data points for all stars at our disposal, this conclusion is uncertain for those objects. Extension of the Spectral Energy Distributions (SEDs) to the submillimetre region would be helpful in constraining the disc characteristics and the grain size distribution.
Assuming the IR emission is indeed produced by an infinitely optically thick disc, we can use the ratio to estimate the opening angle of the disc as seen from the star. Suppose the thick disc is at a distance from the star and at a height above the mid-plane (total thickness of the disc is ). The total inner surface of the disc is . As of the stellar energy should be absorbed by the disc, its surface must cover a solid angle of (Dominik et al. 2003) or
| (3) |
If the disc is not optically thick, the height would have to be even larger. If grey extinction is important for the optical fluxes, we underestimate the intrinsic stellar luminosity which has an opposite effect on the scale height. For the objects with approximately equal to , this implies . Clearly, the scale height of such a disc must be significant and this disc is likely to be gas-rich. A famous example is HR 4049 for which the energy emitted in the IR is due to the presence of a circumbinary disc with a large height (, Dominik et al. 2003).
As the material around the evolved objects is not expanding, we prefer to use the word ‘disc’ or ‘gravitionally bound dust’ instead of torus. Dust tori are often resolved around Proto-Planetary Nebulae, but these have very different SED characteristics since they are much colder and are probably expanding (e.g. Sánchez Contreras & Sahai 2004). Moreover, the physical sizes of the resolved tori are much larger than we expect the circumstellar material to be in the evolved objects. Recently, the very compact nature of the band flux of the dusty environments around SX Cen and HD 52961 was directly proven by Deroo et al. (2005) thanks to the Science Demonstration Time measurements of the band interferometric instrument (MIDI) on the VLTI. Despite the baseline of m, SX Cen was not resolved which implies an upper limit of mas (or AU at the estimated distance of the object) at m. HD 52961 was resolved but also here, the dust emission at m comes from a very small angle of about mas ( AU).
As argued in Sect. 4 the shape of the SEDs clearly differs from the SEDs of post-AGB stars for which dusty outflows are detected. The large optical-to-infrared energy conversion ratios indicate that the scale heights and opening angles of the discs are large. The inner rims of the discs are probably puffed up by the pressure of the hot gas in the disc.
Comparison with young stellar objects
We note that the broad-band SED characteristics, are, at first glance, very similar to the SEDs observed in young stellar objects (YSOs) in which the circumstellar passive disc is a relic of the star formation process. Despite this resemblance, differences in formation history of the discs and in the luminosity of the central stars make it likely that the characteristics will not be identical. Here we explain the similarities and differences between the structure of the post-AGB discs and the YSO discs.
Herbig Ae/Be (HAEBE) stars are the somewhat more massive analogues of the T Tauri stars, which are low-mass young stellar objects. The Spectral Energy Distributions (SEDs) of HAEBE stars are characterized by the presence of a flux excess in the infrared due to circumstellar dust and gas (Acke et al. 2004) and the geometry of this circumstellar matter is believed to be disc-like (e.g. Mannings & Sargent 1997, 2000; Fuente et al. 2003). Meeus et al. (2001) classified a sample of isolated HAEBE sample stars into two groups, based on the shape of the SED. Group I contains sources in which a rising mid-IR (-m) flux excess is observed; these sources have an SED that can be fitted with a power law and a black-body continuum. Group II sources have more modest mid-IR excesses; their IR SEDs can be reconstructed by a power law only. Meeus et al. (2001) suggested that the difference between the two groups is related to the disc geometry. The irradiated passive disc models developed by Chiang & Goldreich (1997) and later extended by Dullemond et al. (2001) show that the difference in SEDs of both classes can be theoretically understood as indeed originating in the disc geometry: the mid-IR excess of the group I sources forms an indication of the flaring of the outer disc while in the group II sources, the inner rim is such that it shadows the whole disc and no flaring will occur.
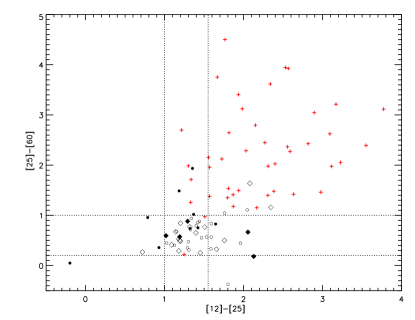
To gain more insight in the differences and similarities between the stars of our sample and the young HAEBE stars, we plot the objects in a colour-colour diagram (Fig. 5) with and as defined in Eq. 1. Nearly all the post-AGB stars fall in the IR-box defined by T. Lloyd Evans (Sect. 2.3), while the HAEBE stars are situated on very different positions. The dust excesses of the post-AGB stars are bluer with reduced mid- and far-IR colours compared to the HAEBE stars. The post-AGB discs are therefore likely to be more compact.

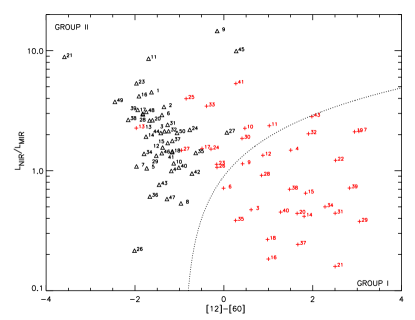
Another way of characterizing the differences between the young HAEBE stars and the old post-AGB objects can be seen in Fig. 6. The IR SED of the sample sources can be characterized by two quantities: the ratio of the near-IR luminosity (derived from the broad-band , , , and photometry) and the mid-IR luminosity (the corresponding quantity based on IRAS , and m measurements), and the non-colour corrected IRAS colour. Both parameters compare the near-IR photometric data to the mid-IR IRAS measurements (Van Boekel et al. 2003; Dullemond et al. 2003). The luminosity ratio represents the strength of the near-IR compared to the mid-IR excess, which is lower for group I than group II sources.
Following Van Boekel et al. (2003), we use these quantities to distinguish between group I and II in the classification of Meeus et al. (2001). We plotted all our sample stars together with the HAEBE sample stars of Acke et al. (2004) in Fig. 6. The dashed line in the diagram represents , which empirically provides the best separation between the two groups. The post-AGB stars are definitely similar to group II sources and the HAEBE group I objects are significantly redder than the post-AGB objects. Note that the IR excess of our stars starts later (near ) than that of the HAEBE stars. Given the fact that -in contrast with the HAEBE stars- for the post-AGB objects the photometry is thus influenced by the stellar photosphere, we dereddened the data points to make sure we don’t take into account the effects of the star. To make the comparison between the HAEBE stars and the post-AGB stars more reliable, we dereddened likewise also the data of the young objects. We conclude that the dust excess around our sample stars do indeed resemble the group II HAEBE sources and no indication of disc flaring is found.
The shape of the SEDs point for both the HAEBE and the post-AGB objects to a disc. Evolution, disc formation and the central stars’ features, however, lead to different characteristics of the discs around both types of objects. The discs around post-AGB stars are smaller (Fig. 5) and there is little evidence for flared discs (Fig. 6).
7 Conclusions
A homogeneous and systematic study of the Spectral Energy Distributions (SEDs) of a sample of 51 post-AGB objects was presented. The selection criteria to define the sample were tuned to cover the broad-band characteristics of known binary post-AGB stars. Our whole sample included 20 dusty RV Tauri stars from the General Catalogue of Variable Stars.
We conclude that the broad-band SED characteristics of the sample are best interpreted, assuming the circumstellar dust is stored in Keplerian rotating passive discs. First-order estimates indicate that the discs are small in the radial direction and, given the large distances of these stars, they are likely only resolvable with interferometric observations.
The actual structure of those discs, let alone their formation, stability and evolution are not well understood. In Table 5, we list the orbital elements of objects of our total sample for which the orbital elements are covered in the literature. These systems are now not in contact (assuming typical post-AGB luminosities), but the orbits are all too small to accomodate a full grown AGB star. It is clear that those systems did not evolve on single star evolutionary tracks. They must have suffered a phase of strong interaction while the primary was at giant dimension. It is well known that those orbital elements are not very well understood yet, since most objects display a significant eccentricity as well (Van Winckel 2003, and references therein). One of the models argues that it is the feedback of the disc on the orbital dynamics, which will induce a large eccentricity (Artymowicz et al. 1991).
We postulate that the same formation mechanism could apply to the whole sample, which means that the objects must all be binaries. Direct detection of orbital motion and, even better, determination of the orbital elements are clearly needed but poses a non-trivial observational challenge and certainly requires a long-term project.
As our sample contains a significant fraction of all known post-AGB stars, this would lead to the conclusion that binarity and binary interaction are a widespread phenomenon among (post-) AGB stars. Dusty RV Tauri stars are those evolved binaries which happen to be in the Population II Cepheid instability strip (Lloyd Evans 1999).
Since the orbital periods detected till today, span already a wide range, from to about days, we conclude that the formation of a stable orbiting disc is common and appears more and more to be a key ingredient in understanding the final evolution of a very significant fraction of binary post-AGB stars.
Acknowledgements.
The staff and the service observers of the Mercator Observatory at La Palma are acknowledged for the photometric Geneva data. This publication makes use of data products from the Two Micron All Sky Survey, which is a joint project of the University of Massachusetts and the Infrared Processing and Analysis Center/California Institute of Technology, funded by the National Aeronautics and Space Administration and the National Science Foundation. We also made use of data from the DENIS project. This is partly funded by the European Commission through SCIENCE and Human Capital and Mobility grants. It is also supported in France by INSU, the Education Ministry and CNRS, in Germany by the Land of Baden-Würtenberg, in Spain by DGICYT, in Italy by CNR, in Austria by the Fonds zur Förderung der Wissenschaftlichen Forschung and Bundesministerium für Wissenschaft und Forschung. This publication was also based on INES (IUE Newly Extracted Spectra) data from the IUE (International Ultraviolet Explorer) satellite. We also like to thank S. Hony for his contribution to this paper.References
- Acke et al. (2004) Acke, B., van den Ancker, M. E., Dullemond, C. P., van Boekel, R., & Waters, L. B. F. M. 2004, A&A, 422, 621
- Alcock et al. (1998) Alcock, C., Allsman, R. A., Alves, D. R., et al. 1998, AJ, 115, 1921
- Arellano Ferro (1984) Arellano Ferro, A. 1984, PASP, 96, 641
- Artymowicz et al. (1991) Artymowicz, P., Clarke, C. J., Lubow, S. H., & Pringle, J. E. 1991, ApJ, 370, L35
- Balick & Frank (2002) Balick, B. & Frank, A. 2002, ARA&A, 40, 439
- Beichman et al. (1988) Beichman, C. A., Neugebauer, G., Habing, H. J., Clegg, P. E., & Chester, T. J., eds. 1988, Infrared astronomical satellite (IRAS) catalogs and atlases. Volume 1: Explanatory supplement
- Bessell et al. (1998) Bessell, M. S., Castelli, F., & Plez, B. 1998, A&A, 333, 231
- Bujarrabal et al. (1988) Bujarrabal, V., Bachiller, R., Alcolea, J., & Martin-Pintado, J. 1988, A&A, 206, L17
- Bujarrabal et al. (2005) Bujarrabal, V., Castro-Carrizo, A., Alcolea, J., & Neri, R. 2005, A&A, 441, 1031
- Bujarrabal et al. (2001) Bujarrabal, V., Castro-Carrizo, A., Alcolea, J., & Sánchez Contreras, C. 2001, A&A, 377, 868
- Bujarrabal et al. (2003) Bujarrabal, V., Neri, R., Alcolea, J., & Kahane, C. 2003, A&A, 409, 573
- Chiang & Goldreich (1997) Chiang, E. I. & Goldreich, P. 1997, ApJ, 490, 368
- Cohen et al. (1975) Cohen, M., Anderson, C. M., Cowley, A., et al. 1975, ApJ, 196, 179
- Cohen et al. (2004) Cohen, M., Van Winckel, H., Bond, H. E., & Gull, T. R. 2004, AJ, 127, 2362
- Dawson (1979) Dawson, D. W. 1979, ApJS, 41, 97
- De Ruyter et al. (2005) De Ruyter, S., Van Winckel, H., Dominik, C., Waters, L. B. F. M., & Dejonghe, H. 2005, A&A, 435, 161
- Deroo et al. (2005) Deroo, P., Van Winckel, H., Min, M., et al. 2005, submitted to A&A
- Dominik et al. (2003) Dominik, C., Dullemond, C. P., Cami, J., & van Winckel, H. 2003, A&A, 397, 595
- Dullemond et al. (2001) Dullemond, C. P., Dominik, C., & Natta, A. 2001, ApJ, 560, 957
- Dullemond et al. (2003) Dullemond, C. P., van den Ancker, M. E., Acke, B., & van Boekel, R. 2003, ApJ, 594, L47
- Egan et al. (2003) Egan, M. P., Price, S. D., Kraemer, K. E., et al. 2003, VizieR Online Data Catalog, 5114, 0
- Fuente et al. (2003) Fuente, A., Rodríguez-Franco, A., Testi, L., et al. 2003, ApJ, 598, L39
- Garcia-Lario et al. (1997) Garcia-Lario, P., Manchado, A., Pych, W., & Pottasch, S. R. 1997, A&AS, 126, 479
- Gehrz (1972) Gehrz, R. D. 1972, ApJ, 178, 715
- Gehrz & Ney (1972) Gehrz, R. D. & Ney, E. P. 1972, PASP, 84, 768
- Gehrz & Woolf (1970) Gehrz, R. D. & Woolf, N. J. 1970, ApJ, 161, L213
- Gillet et al. (1990) Gillet, D., Burki, G., & Duquennoy, A. 1990, A&A, 237, 159
- Giridhar & Ferro (1995) Giridhar, S. & Ferro, A. A. 1995, Revista Mexicana de Astronomia y Astrofisica, 31, 23
- Giridhar et al. (1998) Giridhar, S., Lambert, D. L., & Gonzalez, G. 1998, ApJ, 509, 366
- Giridhar et al. (2000) Giridhar, S., Lambert, D. L., & Gonzalez, G. 2000, ApJ, 531, 521
- Giridhar et al. (2005) Giridhar, S., Lambert, D. L., Reddy, B. E., Gonzalez, G., & Yong, D. 2005, ApJ, 627, 432
- Giridhar et al. (1994) Giridhar, S., Rao, N. K., & Lambert, D. L. 1994, ApJ, 437, 476
- Gledhill (2005) Gledhill, T. M. 2005, MNRAS, 356, 883
- Gledhill et al. (2002) Gledhill, T. M., Bains, I., & Yates, J. A. 2002, MNRAS, 332, L55
- Goldsmith et al. (1987) Goldsmith, M. J., Evans, A., Albinson, J. S., & Bode, M. F. 1987, MNRAS, 227, 143
- Gonzalez et al. (1997a) Gonzalez, G., Lambert, D. L., & Giridhar, S. 1997a, ApJ, 481, 452
- Gonzalez et al. (1997b) Gonzalez, G., Lambert, D. L., & Giridhar, S. 1997b, ApJ, 479, 427
- Gonzalez & Wallerstein (1996) Gonzalez, G. & Wallerstein, G. 1996, MNRAS, 280, 515
- Holland et al. (1999) Holland, W. S., Robson, E. I., Gear, W. K., et al. 1999, MNRAS, 303, 659
- Jura (1986) Jura, M. 1986, ApJ, 309, 732
- Jura & Turner (1998) Jura, M. & Turner, J. 1998, Nature, 395, 144
- Jura et al. (1997) Jura, M., Turner, J., & Balm, S. P. 1997, ApJ, 474, 741
- Kilkenny et al. (1993) Kilkenny, D., van Wyk, F., Marang, F., et al. 1993, South African Astronomical Observatory Circular, 15, 85
- Kodaira et al. (1970) Kodaira, K., Greenstein, J. L., & Oke, J. B. 1970, ApJ, 159, 485
- Kurucz (1979) Kurucz, R. L. 1979, ApJS, 40, 1
- Lambert et al. (1988) Lambert, D. L., Hinkle, K. H., & Luck, R. E. 1988, ApJ, 333, 917
- Leinert & Haas (1989) Leinert, C. & Haas, M. 1989, A&A, 221, 110
- Lloyd Evans (1985) Lloyd Evans, T. 1985, MNRAS, 217, 493
- Lloyd Evans (1997) Lloyd Evans, T. 1997, Ap&SS, 251, 239
- Lloyd Evans (1999) Lloyd Evans, T. L. 1999, in IAU Symp. 191: Asymptotic Giant Branch Stars, 453
- Maas et al. (2005) Maas, T., Van Winckel, H., & Lloyd Evans, T. 2005, A&A, 429, 297
- Maas et al. (2003) Maas, T., Van Winckel, H., Lloyd Evans, T., et al. 2003, A&A, 405, 271
- Maas et al. (2002) Maas, T., Van Winckel, H., & Waelkens, C. 2002, A&A, 386, 504
- Mannings & Sargent (1997) Mannings, V. & Sargent, A. I. 1997, ApJ, 490, 792
- Mannings & Sargent (2000) Mannings, V. & Sargent, A. I. 2000, ApJ, 529, 391
- Markwick-Kemper et al. (2005) Markwick-Kemper, F., Green, J. D., & Peeters, E. 2005, ApJ in press
- Mathis & Lamers (1992) Mathis, J. S. & Lamers, H. J. G. L. M. 1992, A&A, 259, L39
- Meeus et al. (2001) Meeus, G., Waters, L. B. F. M., Bouwman, J., et al. 2001, A&A, 365, 476
- Meixner et al. (1999) Meixner, M., Ueta, T., Dayal, A., et al. 1999, ApJS, 122, 221
- Men’shchikov et al. (2002) Men’shchikov, A. B., Schertl, D., Tuthill, P. G., Weigelt, G., & Yungelson, L. R. 2002, A&A, 393, 867
- Menzies & Whitelock (1988) Menzies, J. W. & Whitelock, P. A. 1988, MNRAS, 233, 697
- Molster et al. (2002) Molster, F. J., Waters, L. B. F. M., Tielens, A. G. G. M., & Barlow, M. J. 2002, A&A, 382, 184
- Morris (1987) Morris, M. 1987, PASP, 99, 1115
- Pollard & Cottrell (1995) Pollard, K. H. & Cottrell, P. L. 1995, in ASP Conf. Ser. 83: IAU Colloq. 155: Astrophysical Applications of Stellar Pulsation, 409
- Pollard et al. (1996) Pollard, K. R., Cottrell, P. L., Kilmartin, P. M., & Gilmore, A. C. 1996, MNRAS, 279, 949
- Pollard et al. (1997) Pollard, K. R., Cottrell, P. L., Lawson, W. A., Albrow, M. D., & Tobin, W. 1997, MNRAS, 286, 1
- Rao et al. (2002) Rao, N. K., Goswami, A., & Lambert, D. L. 2002, MNRAS, 334, 129
- Raskin et al. (2004) Raskin, G., Burki, G., Burnet, M., et al. 2004, in UV and Gamma-Ray Space Telescope Systems. Edited by Hasinger, Günther; Turner, Martin J. L. Proceedings of the SPIE, Volume 5492, pp. 830-840 (2004)., 830–840
- Raveendran (1989) Raveendran, A. V. 1989, MNRAS, 238, 945
- Sánchez Contreras & Sahai (2004) Sánchez Contreras, C. & Sahai, R. 2004, ApJ, 602, 960
- Sahai (2004) Sahai, R. 2004, in ASP Conf. Ser. 313: Asymmetrical Planetary Nebulae III: Winds, Structure and the Thunderbird, 141
- Savage & Mathis (1979) Savage, B. D. & Mathis, J. S. 1979, ARA&A, 17, 73
- Shenton et al. (1995) Shenton, M., Evans, A., & Williams, P. M. 1995, MNRAS, 273, 906
- Sopka et al. (1985) Sopka, R. J., Hildebrand, R., Jaffe, D. T., et al. 1985, ApJ, 294, 242
- Szczerba et al. (2001) Szczerba, R., Górny, S. K., & Zalfresso–Jundziłło, M. 2001, in Post-AGB Objects as a Phase of Stellar Evolution, 13
- Ueta et al. (2000) Ueta, T., Meixner, M., & Bobrowsky, M. 2000, ApJ, 528, 861
- Van Boekel et al. (2003) Van Boekel, R., Waters, L. B. F. M., Dominik, C., et al. 2003, A&A, 400, L21
- Van Winckel (1997) Van Winckel, H. 1997, A&A, 319, 561
- Van Winckel (2003) Van Winckel, H. 2003, ARA&A, 41, 391
- Van Winckel et al. (1992) Van Winckel, H., Mathis, J. S., & Waelkens, C. 1992, Nature, 356, 500
- Van Winckel et al. (1999) Van Winckel, H., Waelkens, C., Fernie, J. D., & Waters, L. B. F. M. 1999, A&A, 343, 202
- Van Winckel et al. (1995) Van Winckel, H., Waelkens, C., & Waters, L. B. F. M. 1995, A&A, 293, L25
- Van Winckel et al. (2000) Van Winckel, H., Waelkens, C., & Waters, L. B. F. M. 2000, in IAU Symposium, 285
- Van Winckel et al. (1998) Van Winckel, H., Waelkens, C., Waters, L. B. F. M., et al. 1998, A&A, 336, L17
- Waelkens et al. (1991a) Waelkens, C., Lamers, H. J. G. L. M., Waters, L. B. F. M., et al. 1991a, A&A, 242, 433
- Waelkens et al. (1991b) Waelkens, C., Van Winckel, H., Bogaert, E., & Trams, N. R. 1991b, A&A, 251, 495
- Waelkens et al. (1992) Waelkens, C., Van Winckel, H., Trams, N. R., & Waters, L. B. F. M. 1992, A&A, 256, L15
- Waelkens et al. (1996) Waelkens, C., Van Winckel, H., Waters, L. B. F. M., & Bakker, E. J. 1996, A&A, 314, L17
- Waelkens & Waters (1993) Waelkens, C. & Waters, L. B. F. M. 1993, in ASP Conf. Ser. 45: Luminous High-Latitude Stars, 219
- Wahlgren (1992) Wahlgren, G. M. 1992, AJ, 104, 1174
- Waters et al. (1998) Waters, L. B. F. M., Cami, J., de Jong, T., et al. 1998, Nature, 391, 868
- Waters et al. (1992) Waters, L. B. F. M., Trams, N. R., & Waelkens, C. 1992, A&A, 262, L37
- Waters et al. (1993) Waters, L. B. F. M., Waelkens, C., Mayor, M., & Trams, N. R. 1993, A&A, 269, 242
Appendix A Results
| No | Name | |||||||||||||
|---|---|---|---|---|---|---|---|---|---|---|---|---|---|---|
| (K) | () | (AU) | () | (AU) | ||||||||||
| 1 | TW Cam | 0.4 | 0.3 | 3489 | 11 | 4.5 | 1.7 | 5200 | 2100 | 800 | 0.4 | 1.8 | ||
| 2 | RV Tau | 0.4 | 0.3 | 3293 | 10 | 4.7 | 1.7 | 4000 | 1900 | 700 | 0.3 | 1.8 | ||
| 3 | IRAS 05208 | 0.0 | 0.3 | 2952 | 45 | 30.9 | 7.3 | 1200 | 800 | 200 | 0.6 | 1.4 | ||
| 4 | DY Ori | 1.1 | 0.3 | 4437 | 50 | 8.5 | 2.9 | 1800 | 300 | 100 | 0.4 | 1.2 | ||
| 5 | CT Ori | 0.2 | 0.3 | 4161 | 15 | 5.9 | 2.3 | 3600 | 1400 | 600 | 0.9 | 0.8 | ||
| 6 | SU Gem | 0.8 | 0.3 | 4256 | 18 | 2.9 | 1.0 | 10000 | 1600 | 500 | 0.5 | 1.8 | ||
| 7 | UY CMa | 0.0 | 0.3 | 4008 | 15 | 5.2 | 2.0 | 400 | 100 | 100 | 0.2 | 1.0 | ||
| 8 | HD 44179 | 0.0 | 0.3 | 5644 | 28 | 5.5 | 1.2 | 9100 | 1800 | 400 | 0.8 | 1.0 | ||
| 9 | HD 46703 | 0.1 | 0.3 | 4569 | 19 | 5.3 | 1.1 | 10000 | 2800 | 600 | 0.2 | 1.4 | ||
| 10 | ST Pup | 0.0 | 0.3 | 4307 | 50 | 3.8 | 1.1 | 3300 | 200 | 100 | 0.7 | 1.2 | ||
| 11 | HD 52961 | 0.0 | 0.3 | 4459 | 18 | 5.5 | 1.2 | 9600 | 2900 | 600 | 0.5 | 1.8 | ||
| 12 | SAO 173329 | 0.4 | 0.3 | 5215 | 25 | 5.6 | 1.2 | 4400 | 1000 | 200 | 0.6 | 1.2 | ||
| 13 | U Mon | 0.0 | 0.3 | 3625 | 14 | 5.3 | 2.0 | 400 | 200 | 100 | 0.1 | 1.2 | ||
| 14 | AR Pup | 0.6 | 0.3 | 4534 | 18 | 3.6 | 1.3 | 6300 | 1300 | 400 | 0.9 | 1.4 | ||
| 15 | IRAS 08544 | 1.5 | 0.3 | 5434 | 26 | 5.4 | 1.1 | 8300 | 1700 | 400 | 0.8 | 1.2 | ||
| 16 | IRAS 09060 | 0.8 | 0.3 | 4878 | 21 | 5.5 | 1.2 | 8900 | 2300 | 500 | 0.8 | 1.6 | ||
| 17 | IRAS 09144 | 2.2 | 0.3 | 4307 | 17 | 5.6 | 1.2 | 4600 | 1500 | 300 | 0.8 | 1.4 | ||
| 18 | IW Car | 0.7 | 0.3 | 4986 | 24 | 3.5 | 1.2 | 3200 | 500 | 200 | 0.4 | 1.4 | ||
| 19 | IRAS 09400 | |||||||||||||
| 20 | IRAS 09538 | 0.4 | 0.3 | 4032 | 15 | 5.4 | 1.2 | 2700 | 1000 | 200 | 0.3 | 1.8 | ||
| 21 | HR 4049 | 0.2 | 0.3 | 5541 | 28 | 5.5 | 1.2 | 100 | 20 | 4 | 0.4 | 1.8 | ||
| 22 | IRAS 10174 | |||||||||||||
| 23 | IRAS 10456 | 0.3 | 0.3 | 3149 | 10 | 6.1 | 1.4 | 1800 | 1100 | 300 | 0.7 | 1.6 | ||
| 24 | HD 95767 | 0.7 | 0.3 | 5519 | 28 | 5.3 | 1.1 | 10000 | 1900 | 400 | 0.4 | 1.6 | ||
| 25 | GK Car | |||||||||||||
| 26 | IRAS 11472 | 0.4 | 0.3 | 4357 | 16 | 5.3 | 1.2 | 1800 | 600 | 100 | 0.9 | 0.0 | ||
| 27 | RU Cen | 0.3 | 0.3 | 4529 | 18 | 3.2 | 1.1 | 7900 | 1400 | 500 | 0.8 | 0.6 | ||
| 28 | SX Cen | 0.3 | 0.3 | 4452 | 20 | 2.1 | 0.7 | 3000 | 300 | 100 | 0.5 | 1.6 | ||
| 29 | HD 108015 | 0.2 | 0.3 | 5248 | 32 | 7.2 | 1.5 | 7500 | 1700 | 400 | 0.9 | 1.2 | ||
| 30 | IRAS 13258 | |||||||||||||
| 31 | EN TrA | 0.3 | 0.3 | 4424 | 18 | 2.1 | 0.7 | 4000 | 500 | 100 | 0.4 | 1.6 | ||
| 32 | IRAS 15469 | 1.5 | 0.3 | 5499 | 28 | 5.5 | 1.2 | 8500 | 1700 | 300 | 0.3 | 1.8 | ||
| 33 | IRAS 15556 | |||||||||||||
| 34 | IRAS 16230 | 0.7 | 0.3 | 4651 | 19 | 5.3 | 1.1 | 1800 | 500 | 100 | 0.6 | 1.0 | ||
| 35 | IRAS 17038 | 0.2 | 0.3 | 3492 | 33 | 16.0 | 3.6 | 10000 | 4900 | 1100 | 0.4 | 1.8 | ||
| 36 | IRAS 17233 | 0.4 | 0.3 | 4513 | 19 | 5.3 | 1.1 | 400 | 100 | 0 | 0.0 | 1.4 | ||
| 37 | IRAS 17243 | 0.7 | 0.3 | 4581 | 19 | 5.3 | 1.1 | 3800 | 1100 | 200 | 0.3 | 1.6 | ||
| 38 | 89 Her | 0.0 | 0.3 | 4785 | 21 | 3.3 | 1.1 | 2400 | 400 | 100 | 0.4 | 1.8 | ||
| 39 | AI Sco | 0.3 | 0.3 | 3657 | 12 | 3.7 | 1.3 | 1000 | 300 | 100 | 0.3 | 1.8 | ||
| 40 | IRAS 18123 | 0.3 | 0.3 | 3686 | 12 | 5.3 | 1.2 | 1500 | 700 | 100 | 0.5 | 1.0 | ||
| 41 | IRAS 18158 | 0.9 | 0.3 | 4824 | 21 | 5.5 | 1.2 | 7000 | 1800 | 400 | 0.6 | 1.4 | ||
| 42 | AC Her | 0.1 | 0.3 | 4036 | 15 | 3.7 | 1.3 | 900 | 200 | 100 | 0.3 | 0.2 | ||
| 43 | AD Aql | 0.6 | 0.3 | 4691 | 50 | 8.0 | 2.8 | 2000 | 300 | 100 | 0.7 | 0.0 | ||
| 44 | IRAS 19125 | 1.2 | 0.3 | 5748 | 34 | 6.2 | 1.3 | 7700 | 1400 | 300 | 0.5 | 1.6 | ||
| 45 | EP Lyr | 0.5 | 0.3 | 5143 | 24 | 3.7 | 1.3 | 10000 | 1500 | 500 | 0.3 | 1.2 | ||
| 46 | IRAS 19157 | 0.8 | 0.3 | 5740 | 33 | 6.0 | 1.3 | 5600 | 1000 | 200 | 0.5 | 1.4 | ||
| 47 | IRAS 20056 | 0.7 | 0.3 | 4216 | 23 | 7.4 | 1.6 | 1400 | 400 | 100 | 0.3 | 1.4 | ||
| 48 | R Sge | 0.4 | 0.3 | 4236 | 16 | 3.4 | 1.2 | 1800 | 400 | 100 | 0.4 | 1.6 | ||
| 49 | V Vul | 0.1 | 0.3 | 3902 | 13 | 3.7 | 1.3 | 1400 | 400 | 100 | 0.7 | 1.4 | ||
| 50 | HD 213985 | 0.2 | 0.3 | 6167 | 34 | 5.5 | 1.1 | 10000 | 1600 | 300 | 0.6 | 1.4 | ||
| 51 | BD39∘4926 | 0.2 | 0.3 | |||||||||||
| No | Name | Parallax | Distance | Period | BCV | Distance | |||||
|---|---|---|---|---|---|---|---|---|---|---|---|
| (mas) | (pc) | (L☉) | (days) | (L☉) | (kpc) | ||||||
| 1 | TW Cam | ||||||||||
| 2 | RV Tau | ||||||||||
| 3 | IRAS 05208 | ||||||||||
| 4 | DY Ori | ||||||||||
| 5 | CT Ori | ||||||||||
| 6 | SU Gem | ||||||||||
| 7 | UY CMa | ||||||||||
| 8 | HD 44179 | -- | -- | ||||||||
| 9 | HD 46703 | ||||||||||
| 10 | ST Pup | ||||||||||
| 11 | HD 52961 | ||||||||||
| 12 | SAO 173329 | ||||||||||
| 13 | U Mon | -- | -- | ||||||||
| 14 | AR Pup | -- | -- | ||||||||
| 15 | IRAS 08544 | ||||||||||
| 16 | IRAS 09060 | ||||||||||
| 17 | IRAS 09144 | ||||||||||
| 18 | IW Car | ||||||||||
| 19 | IRAS 09400 | ||||||||||
| 20 | IRAS 09538 | ||||||||||
| 21 | HR 4049 | -- | -- | ||||||||
| 22 | IRAS 10174 | ||||||||||
| 23 | IRAS 10456 | -- | -- | ||||||||
| 24 | HD 95767 | ||||||||||
| 25 | GK Car | ||||||||||
| 26 | IRAS 11472 | ||||||||||
| 27 | RU Cen | ||||||||||
| 28 | SX Cen | ||||||||||
| 29 | HD 108015 | ||||||||||
| 30 | IRAS 13258 | ||||||||||
| 31 | EN TrA | ||||||||||
| 32 | IRAS 15469 | ||||||||||
| 33 | IRAS 15556 | ||||||||||
| 34 | IRAS 16230 | ||||||||||
| 35 | IRAS 17038 | ||||||||||
| 36 | IRAS 17233 | ||||||||||
| 37 | IRAS 17243 | ||||||||||
| 38 | 89 Her | -- | -- | ||||||||
| 39 | AI Sco | ||||||||||
| 40 | IRAS 18123 | ||||||||||
| 41 | IRAS 18158 | ||||||||||
| 42 | AC Her | ||||||||||
| 43 | AD Aql | ||||||||||
| 44 | IRAS 19125 | ||||||||||
| 45 | EP Lyr | ||||||||||
| 46 | IRAS 19157 | ||||||||||
| 47 | IRAS 20056 | ||||||||||
| 48 | R Sge | ||||||||||
| 49 | V Vul | ||||||||||
| 50 | HD 213985 | ||||||||||
| 51 | BD39∘4926 | ||||||||||


Appendix B Orbital Periods
| No | Name | Reference | |||
|---|---|---|---|---|---|
| (days) | AU | ||||
| 8 | HD 44179 | Van Winckel et al. (1995) | |||
| 9 | HD 46703 | Waelkens & Waters (1993) | |||
| 10 | ST Pup | Gonzalez & Wallerstein (1996) | |||
| 11 | HD 52961 | Van Winckel et al. (1999) | |||
| 12 | SAO 173329 | Van Winckel et al. (2000) | |||
| 13 | U Mon | Pollard & Cottrell (1995) | |||
| 15 | IRAS 08544 | Maas et al. (2003) | |||
| 21 | HR 4049 | Waelkens et al. (1991b) | |||
| 24 | HD 95767 | Van Winckel et al. (2000) | |||
| 28 | SX Cen | Maas et al. (2002) | |||
| 31 | EN TrA | Van Winckel et al. (1999) | |||
| 38 | 89 Her | Arellano Ferro (1984) | |||
| 42 | AC Her | Van Winckel et al. (1998) | |||
| 50 | HD 213985 | Van Winckel et al. (2000) | |||
| 51 | BD39∘4926 | Kodaira et al. (1970) | |||
Appendix C Data
| No | Name | JD | Number | Timebase | Reference | |||||||
|---|---|---|---|---|---|---|---|---|---|---|---|---|
| 2400000 | (days) | |||||||||||
| 1 | TW Cam | 52580.598 | 11 | 375 | 12.907 | 10.288 | 9.490 | 11.637 | 11.424 | 10.305 | 10.360 | Mercator |
| 52295.400 | 13.000 | 10.499 | 9.716 | 11.807 | 11.642 | 10.533 | 10.579 | Mercator | ||||
| 2 | RV Tau | 52305.412 | 37 | 827 | 12.511 | 9.957 | 9.036 | 11.323 | 11.077 | 9.859 | 9.886 | Mercator |
| 52609.487 | 14.867 | 12.091 | 10.822 | 13.507 | 13.130 | 11.650 | 11.655 | Mercator | ||||
| 4 | DY Ori | 52229.717 | 27 | 880 | 14.242 | 11.709 | 11.229 | 12.781 | 13.019 | 12.035 | 12.119 | Mercator |
| 52986.649 | 15.447 | 12.933 | 12.078 | 14.177 | 14.167 | 12.908 | 12.921 | Mercator | ||||
| 5 | CT Ori | 53021.482 | 31 | 884 | 12.119 | 10.020 | 10.174 | 10.993 | 11.397 | 10.924 | 11.175 | Mercator |
| 52247.539 | 13.454 | 11.368 | 10.983 | 12.548 | 12.637 | 11.776 | 11.914 | Mercator | ||||
| 6 | SU Gem | 52543.715 | 18 | 781 | 14.301 | 11.616 | 10.697 | 12.902 | 12.808 | 11.539 | 11.540 | Mercator |
| 52307.508 | 16.610 | 14.028 | 13.248 | 15.160 | 15.386 | 14.042 | 14.057 | Mercator | ||||
| 8 | HD 44179 | 10.465 | 8.362 | 8.832 | 9.285 | 9.806 | 9.578 | 9.861 | GCPD | |||
| 50403.809 | 96 | 2230 | 10.398 | 8.307 | 8.777 | 9.234 | 9.751 | 9.518 | 9.815 | cm Swiss | ||
| 48705.546 | 10.565 | 8.470 | 8.938 | 9.390 | 9.921 | 9.684 | 9.972 | cm Swiss | ||||
| 9 | HD 46703 | 10.588 | 8.668 | 9.022 | 9.633 | 10.064 | 9.742 | 10.083 | GCPD | |||
| 50100.497 | 104 | 6347 | 10.402 | 8.398 | 8.855 | 9.340 | 9.812 | 9.574 | 9.927 | cm Swiss | ||
| 49300.642 | 10.889 | 8.998 | 9.251 | 9.995 | 10.361 | 9.989 | 10.309 | cm Swiss | ||||
| 11 | HD 52961 | 8.818 | 6.914 | 7.376 | 7.845 | 8.348 | 8.105 | 8.453 | GCPD | |||
| 48575.657 | 177 | 5631 | 8.667 | 6.717 | 7.237 | 7.637 | 8.161 | 7.959 | 8.326 | cm Swiss | ||
| 52612.675 | 8.955 | 7.080 | 7.522 | 8.013 | 8.504 | 8.253 | 8.592 | Mercator | ||||
| 12 | SAO 173329 | 12.420 | 10.320 | 10.642 | 11.297 | 11.721 | 11.382 | 11.687 | GCPD | |||
| 47894.684 | 75 | 2917 | 12.392 | 10.290 | 10.609 | 11.256 | 11.674 | 11.352 | 11.653 | cm Swiss | ||
| 49846.473 | 12.425 | 10.377 | 10.690 | 11.339 | 11.759 | 11.427 | 11.716 | cm Swiss | ||||
| 13 | U Mon | 8.428 | 6.330 | 5.980 | 7.596 | 7.508 | 6.752 | 6.948 | GCPD | |||
| 47545.766 | 110 | 1217 | 7.759 | 5.792 | 5.575 | 7.013 | 6.990 | 6.334 | 6.570 | cm Swiss | ||
| 47853.822 | 9.507 | 7.484 | 7.194 | 8.697 | 8.698 | 7.941 | 8.245 | cm Swiss | ||||
| 14 | AR Pup | 11.415 | 9.274 | 9.226 | 10.360 | 10.568 | 9.988 | 10.207 | GCPD | |||
| 43605.517 | 2 | 416 | 11.313 | 9.229 | 9.179 | 10.318 | 10.511 | 9.935 | 10.165 | cm Swiss | ||
| 43189.707 | 11.889 | 9.603 | 9.353 | 10.772 | 10.822 | 10.125 | 10.300 | cm Swiss | ||||
| 21 | HR 4049 | 7.010 | 4.896 | 5.504 | 5.808 | 6.349 | 6.221 | 6.617 | GCPD | |||
| 45271.870 | 371 | 6943 | 6.570 | 4.584 | 5.284 | 5.471 | 6.056 | 5.997 | 6.421 | cm Swiss | ||
| 47233.683 | 7.605 | 5.373 | 5.827 | 6.317 | 6.791 | 6.550 | 6.918 | cm Swiss | ||||
| 23 | IRAS 10456 | 10.460 | 7.480 | 6.292 | 9.144 | 8.455 | 7.130 | 7.117 | GCPD | |||
| 24 | HD 95767 | 10.865 | 8.722 | 8.782 | 9.779 | 10.048 | 9.542 | 9.767 | GCPD | |||
| 49086.620 | 102 | 6148 | 10.707 | 8.576 | 8.706 | 9.601 | 9.921 | 9.461 | 9.708 | cm Swiss | ||
| 47636.567 | 10.941 | 8.816 | 8.840 | 9.887 | 10.125 | 9.596 | 9.808 | cm Swiss | ||||
| 26 | IRAS 11472 | 53548.427 | 1 | 13.645 | 11.619 | 11.790 | 12.622 | 12.949 | 12.533 | 12.824 | Mercator | |
| 27 | RU Cen | 10.766 | 8.950 | 9.007 | 10.000 | 10.276 | 9.761 | 10.017 | GCPD | |||
| 44778.506 | 23 | 751 | 10.219 | 8.429 | 8.574 | 9.441 | 9.773 | 9.320 | 9.591 | cm Swiss | ||
| 44304.731 | 12.135 | 9.953 | 9.567 | 11.184 | 11.150 | 10.353 | 10.538 | cm Swiss | ||||
| 28 | SX Cen | 11.732 | 9.735 | 9.636 | 10.858 | 11.005 | 10.400 | 10.616 | GCPD | |||
| 44778.526 | 15 | 751 | 11.099 | 9.101 | 9.190 | 10.183 | 10.406 | 9.943 | 10.203 | cm Swiss | ||
| 44669.855 | 12.912 | 10.907 | 10.545 | 12.109 | 12.132 | 11.329 | 11.472 | cm Swiss | ||||
| 29 | HD 108015 | 9.433 | 7.479 | 7.934 | 8.471 | 8.864 | 8.667 | 9.006 | GCPD | |||
| 49386.836 | 111 | 2867 | 9.337 | 7.378 | 7.865 | 8.356 | 8.772 | 8.592 | 8.937 | cm Swiss | ||
| 50115.801 | 9.541 | 7.606 | 8.020 | 8.613 | 8.975 | 8.749 | 9.082 | cm Swiss | ||||
| 31 | EN TrA | 10.687 | 8.648 | 8.677 | 9.754 | 9.932 | 9.435 | 9.671 | GCPD | |||
| 47636.730 | 61 | 2245 | 10.478 | 8.449 | 8.477 | 9.565 | 9.728 | 9.229 | 9.470 | cm Swiss | ||
| 48133.582 | 11.293 | 9.181 | 9.088 | 10.350 | 10.439 | 9.852 | 10.056 | cm Swiss | ||||
| 38 | 89 Her | 6.860 | 4.869 | 5.425 | 5.815 | 6.296 | 6.148 | 6.526 | GCPD | |||
| 41401.613 | 14 | 3507 | 6.769 | 4.779 | 5.364 | 5.714 | 6.212 | 6.080 | 6.471 | cm Swiss | ||
| 41434.593 | 6.987 | 5.006 | 5.513 | 5.965 | 6.419 | 6.241 | 6.609 | cm Swiss | ||||
| 40 | IRAS 18123 | 52415.660 | 31 | 441 | 14.010 | 10.882 | 9.945 | 12.385 | 11.927 | 10.764 | 10.805 | Mercator |
| 52508.430 | 14.719 | 11.420 | 10.267 | 13.023 | 12.428 | 11.090 | 11.119 | Mercator | ||||
| 42 | AC Her | 9.419 | 7.450 | 7.456 | 8.536 | 8.755 | 8.221 | 8.460 | GCPD | |||
| 52367.729 | 46 | 5038 | 8.726 | 6.900 | 7.261 | 7.854 | 8.311 | 8.002 | 8.310 | Mercator | ||
| 52097.548 | 10.770 | 8.729 | 8.408 | 9.927 | 9.941 | 9.187 | 9.354 | Mercator | ||||
| 43 | AD Aql | 52112.508 | 1 | 13.780 | 11.789 | 11.697 | 12.853 | 13.092 | 12.460 | 12.672 | Mercator | |
| 44 | IRAS 19125 | 52476.526 | 33 | 441 | 12.822 | 10.395 | 10.214 | 11.425 | 11.707 | 11.003 | 11.181 | Mercator |
| 52428.678 | 12.875 | 10.466 | 10.289 | 11.516 | 11.784 | 11.064 | 11.237 | Mercator | ||||
| 45 | EP Lyr | 52491.424 | 35 | 481 | 11.808 | 9.818 | 9.954 | 10.806 | 11.181 | 10.707 | 10.974 | Mercator |
| 52136.422 | 13.144 | 11.134 | 10.880 | 12.267 | 12.371 | 11.648 | 11.841 | Mercator | ||||
| 46 | IRAS 19157 | 52561.390 | 4 | 60 | 12.968 | 10.690 | 10.688 | 11.694 | 12.058 | 11.468 | 11.659 | Mercator |
| 52505.446 | 13.163 | 10.831 | 10.775 | 11.857 | 12.177 | 11.547 | 11.752 | Mercator | ||||
| 47 | IRAS 20056 | 52580.350 | 33 | 444 | 14.999 | 12.594 | 12.196 | 13.828 | 13.764 | 12.985 | 13.111 | Mercator |
| 52854.611 | 15.429 | 12.943 | 12.505 | 14.213 | 14.122 | 13.274 | 13.392 | Mercator | ||||
| 48 | R Sge | 52089.601 | 41 | 1164 | 11.471 | 9.183 | 8.925 | 10.413 | 10.376 | 9.700 | 9.869 | Mercator |
| 52428.658 | 13.199 | 10.603 | 9.994 | 11.965 | 11.685 | 10.777 | 10.903 | Mercator | ||||
| 49 | V Vul | 52131.599 | 39 | 1167 | 10.603 | 8.449 | 8.128 | 9.702 | 9.632 | 8.909 | 9.076 | Mercator |
| 52419.684 | 12.555 | 10.187 | 9.728 | 11.454 | 11.350 | 10.494 | 10.740 | Mercator | ||||
| 50 | HD 213985 | 9.975 | 8.053 | 8.827 | 8.940 | 9.536 | 9.536 | 9.968 | GCPD | |||
| 47397.749 | 156 | 5871 | 9.789 | 7.904 | 8.706 | 8.781 | 9.395 | 9.420 | 9.853 | cm Swiss | ||
| 50051.540 | 10.618 | 8.556 | 9.209 | 9.478 | 10.008 | 9.922 | 10.327 | cm Swiss | ||||
| 51 | BD39∘4926 | 10.536 | 8.512 | 9.263 | 9.386 | 10.009 | 9.975 | 10.399 | GCPD | |||
| 53250.653 | 70 | 14211 | 10.481 | 8.507 | 9.241 | 9.380 | 9.996 | 9.952 | 10.364 | Mercator | ||
| 52561.442 | 10.502 | 8.528 | 9.278 | 9.408 | 10.026 | 9.979 | 10.407 | Mercator |
| No | Name | JD | System | Reference | |||||
|---|---|---|---|---|---|---|---|---|---|
| 2400000 | |||||||||
| 1 | TW Cam | 12.12 | 10.94 | 9.51 | Johnson | Dawson (1979) | |||
| 2 | RV Tau | 12.52 | 10.93 | 9.19 | Johnson | Dawson (1979) | |||
| 3 | IRAS 05208 | 52294.367 | 11.132 | 10.498 | 9.352 | 8.643 | 7.947 | Cousins | SAAO |
| 52253.552 | 11.185 | 10.665 | 9.608 | 8.915 | 8.139 | Cousins | SAAO | ||
| 4 | DY Ori | 13.45 | 12.75 | 11.48 | Johnson | Dawson (1979) | |||
| 5 | CT Ori | 11.69 | 11.24 | 10.31 | Johnson | Dawson (1979) | |||
| 6 | SU Gem | 12.88 | 11.70 | 10.19 | Johnson | Dawson (1979) | |||
| 7 | UY CMa | 11.36 | 11.03 | 10.40 | Johnson | Dawson (1979) | |||
| 12.28 | 11.81 | 11.00 | Johnson | Dawson (1979) | |||||
| 10 | ST Pup | 48363.260 | 9.890 | 9.686 | 9.362 | 9.126 | 8.835 | Cousins | Kilkenny et al. (1993) |
| 48672.365 | 12.058 | 11.568 | 10.661 | 10.151 | 9.642 | Cousins | Kilkenny et al. (1993) | ||
| 13 | U Mon | 7.15 | 6.59 | 5.66 | Johnson | Dawson (1979) | |||
| 49258.126 | 6.497 | 5.436 | 4.946 | 4.511 | Cousins | Pollard et al. (1996) | |||
| 48499.199 | 8.614 | 7.632 | 7.088 | 6.387 | Cousins | Pollard et al. (1996) | |||
| 14 | AR Pup | 48622.972 | 9.782 | 9.093 | 8.672 | 8.216 | Cousins | Pollard et al. (1996) | |
| 48854.238 | 10.823 | 10.092 | 9.638 | 9.186 | Cousins | Pollard et al. (1996) | |||
| 15 | IRAS 08544 | 51609.372 | 11.660 | 10.533 | 9.017 | 8.052 | 7.024 | Cousins | SAAO |
| 51300.233 | 11.982 | 10.756 | 9.192 | 8.186 | 7.139 | Cousins | SAAO | ||
| 16 | IRAS 09060 | 50957.232 | 12.390 | 11.817 | 10.959 | 10.383 | 9.749 | Cousins | SAAO |
| 49399.455 | 12.893 | 12.305 | 11.417 | 10.839 | 10.227 | Cousins | SAAO | ||
| 17 | IRAS 09144 | 51625.329 | 13.857 | 12.267 | 10.777 | Cousins | SAAO | ||
| 51626.333 | 15.886 | 13.890 | 12.293 | 10.797 | Cousins | SAAO | |||
| 18 | IW Car | 48650.035 | 8.657 | 7.852 | 7.379 | 6.772 | Cousins | Pollard et al. (1996) | |
| 48911.056 | 9.755 | 8.758 | 8.148 | 7.454 | Cousins | Pollard et al. (1996) | |||
| 20 | IRAS 09538 | 52030.329 | 12.772 | 12.083 | 11.161 | 10.623 | 10.056 | Cousins | SAAO |
| 51576.506 | 14.638 | 13.733 | 12.485 | 11.691 | 10.901 | Cousins | SAAO | ||
| 23 | IRAS 10456 | 49053.470 | 9.829 | 7.942 | 6.246 | Cousins | SAAO | ||
| 49078.387 | 9.869 | 7.963 | 6.267 | Cousins | SAAO | ||||
| 27 | RU Cen | 46244.28 | 11.31 | 10.46 | 9.43 | 8.89 | 8.38 | Cousins | Goldsmith et al. (1987) |
| 46245.34 | 11.44 | 10.59 | 9.53 | 8.98 | 8.47 | Cousins | Goldsmith et al. (1987) | ||
| 48269.101 | 9.158 | 8.529 | 8.178 | 7.606 | Cousins | Pollard et al. (1996) | |||
| 48319.041 | 10.798 | 9.811 | 9.294 | 8.688 | Cousins | Pollard et al. (1996) | |||
| 28 | SX Cen | 46243.26 | 10.85 | 10.26 | 9.43 | 8.97 | 8.53 | Cousins | Goldsmith et al. (1987) |
| 46248.30 | 11.36 | 10.70 | 9.77 | 9.27 | 8.81 | Cousins | Goldsmith et al. (1987) | ||
| 29 | HD 108015 | 52734.477 | 8.524 | 8.225 | 7.834 | 7.598 | 7.343 | Cousins | SAAO |
| 53139.350 | 8.873 | 8.506 | 8.048 | 7.771 | 7.498 | Cousins | SAAO | ||
| 32 | IRAS 15469 | 49489.459 | 12.985 | 11.921 | 10.493 | 9.609 | 8.676 | Cousins | SAAO |
| 49442.626 | 13.063 | 12.090 | 10.622 | 9.718 | 8.769 | Cousins | SAAO | ||
| 34 | IRAS 16230 | 49585.254 | 12.800 | 12.102 | 11.157 | 10.585 | 9.985 | Cousins | SAAO |
| 53129.518 | 13.324 | 12.760 | 11.628 | 10.915 | 10.272 | Cousins | SAAO | ||
| 35 | IRAS 17038 | 52411.554 | 12.229 | 11.241 | 9.922 | 9.158 | 8.420 | Cousins | SAAO |
| 51786.255 | 14.756 | 13.453 | 11.916 | 10.982 | 9.895 | Cousins | SAAO | ||
| 36 | IRAS 17233 | 51663.588 | 12.719 | 12.312 | 11.705 | 11.287 | 10.830 | Cousins | SAAO |
| 49590.265 | 14.219 | 13.564 | 12.663 | 12.172 | 11.722 | Cousins | SAAO | ||
| 37 | IRAS 17243 | 52837.410 | 12.378 | 11.316 | 10.200 | 9.544 | 8.919 | Cousins | SAAO |
| 52507.388 | 13.479 | 12.216 | 10.915 | 10.186 | 9.507 | Cousins | SAAO | ||
| 39 | AI Sco | 46245.48 | 13.21 | 11.16 | 9.55 | 8.73 | 7.92 | Cousins | Goldsmith et al. (1987) |
| 49238.995 | 10.088 | 8.868 | 8.215 | 7.656 | Cousins | Pollard et al. (1996) | |||
| 4823.095 | 12.884 | 11.422 | 10.623 | 9.954 | Cousins | Pollard et al. (1996) | |||
| 40 | IRAS 18123 | 49537.405 | 13.033 | 11.335 | 9.876 | 9.146 | 8.524 | Cousins | SAAO |
| 49970.295 | 13.907 | 12.062 | 10.537 | 9.781 | 9.030 | Cousins | SAAO | ||
| 41 | IRAS 18158 | 48799.539 | 14.720 | 13.970 | 13.070 | 12.380 | 11.670 | Cousins | SAAO |
| 49172.542 | 14.857 | 14.349 | 13.699 | 12.742 | 12.312 | Cousins | SAAO | ||
| 42 | AC Her | 8.00 | 7.66 | 7.03 | Johnson | Dawson (1979) | |||
| 46248.47 | 9.11 | 8.68 | 7.87 | 7.40 | 6.91 | Cousins | Goldsmith et al. (1987) | ||
| 43 | AD Aql | 46253.53 | 14.30 | 12.61 | 11.07 | 10.26 | Cousins | Goldsmith et al. (1987) | |
| 48524.899 | 11.811 | 11.285 | 10.917 | 10.534 | Cousins | Pollard et al. (1996) | |||
| 48152.985 | 13.039 | 12.097 | 11.558 | 11.069 | Cousins | Pollard et al. (1996) | |||
| 44 | IRAS 19125 | 49563.415 | 11.724 | 11.097 | 10.100 | 9.438 | 8.661 | Cousins | SAAO |
| 49510.555 | 11.921 | 11.237 | 10.215 | 9.532 | 8.731 | Cousins | SAAO | ||
| 45 | EP Lyr | 10.92 | 10.69 | 10.12 | Johnson | Dawson (1979) | |||
| 46 | IRAS 19157 | 49207.444 | 11.862 | 11.398 | 10.624 | 10.126 | 9.588 | Cousins | SAAO |
| 51761.419 | 12.160 | 11.605 | 10.753 | 10.213 | 9.632 | Cousins | SAAO | ||
| 47 | IRAS 20056 | 46654.41 | 14.25 | 13.44 | 12.37 | 11.79 | 11.29 | Cousins | Menzies & Whitelock (1988) |
| 46627.46 | 14.31 | 13.61 | 12.55 | 11.94 | 11.39 | Cousins | Menzies & Whitelock (1988) | ||
| 48 | R Sge | 11.04 | 9.93 | 8.84 | Johnson | Dawson (1979) | |||
| 46242.57 | 10.43 | 9.71 | 8.79 | 8.31 | 7.84 | Cousins | Goldsmith et al. (1987) | ||
| 46243.58 | 10.57 | 9.79 | 8.83 | 8.32 | 7.84 | Cousins | Goldsmith et al. (1987) | ||
| 49 | V Vul | 9.70 | 9.09 | 8.27 | Johnson | Dawson (1979) |
| No | Name | JD | System | Reference | ||||||
|---|---|---|---|---|---|---|---|---|---|---|
| 2400000 | ||||||||||
| 1 | TW Cam | 4.2 | 3.5 | Mt Lemmon | Gehrz (1972) | |||||
| Arizona system | ||||||||||
| 42445.45 | 7.04 | 6.36 | 5.70 | 4.40 | Tenerife | Lloyd Evans (1985) | ||||
| 7.035 | 6.364 | 5.750 | 2 MASS | VIZIER | ||||||
| 2 | RV Tau | 5.1 | 3.3 | 2.3 | Mt Lemmon | Gehrz (1972) | ||||
| Arizona system | ||||||||||
| 42445.48 | 6.39 | 5.67 | 5.03 | 3.64 | Tenerife | Lloyd Evans (1985) | ||||
| 6.183 | 5.488 | 4.777 | 2 MASS | VIZIER | ||||||
| 3 | IRAS 05208 | 48637.35 | 7.05 | 6.24 | 6.05 | 5.64 | SAAO | T. Lloyd Evans | ||
| 49313.47 | 7.20 | 6.38 | 6.13 | 5.64 | SAAO | T. Lloyd Evans | ||||
| 8.705 | 6.408 | 5.953 | DENIS | VIZIER | ||||||
| 7.044 | 6.314 | 6.063 | 2 MASS | VIZIER | ||||||
| 4 | DY Ori | 43189.30 | 8.10 | 7.47 | 7.02 | 5.73 | SAAO | Lloyd Evans (1985) | ||
| 43158.44 | 8.30 | 7.40 | 6.90 | 5.80 | SAAO | Lloyd Evans (1985) | ||||
| 8.073 | 7.381 | 6.983 | 2 MASS | VIZIER | ||||||
| 5 | CT Ori | 43184.37 | 8.57 | 7.82 | 8.00 | 6.48 | SAAO | Lloyd Evans (1985) | ||
| 43158.38 | 8.66 | 7.92 | 7.50 | 6.09 | SAAO | Lloyd Evans (1985) | ||||
| 8.404 | 7.931 | 7.607 | 2 MASS | VIZIER | ||||||
| 6 | SU Gem | 4.1 | 3.2 | Mt Lemmon | Gehrz (1972) | |||||
| Arizona system | ||||||||||
| 43160.37 | 8.36 | 7.38 | 6.47 | 4.94 | SAAO | Lloyd Evans (1985) | ||||
| 43188.32 | 8.97 | 8.38 | 6.95 | 4.96 | SAAO | Lloyd Evans (1985) | ||||
| 10.167 | 9.033 | 7.584 | 2 MASS | VIZIER | ||||||
| 7 | UY CMa | 46107.32 | 9.35 | 8.82 | 8.22 | 6.62 | SAAO | Lloyd Evans (1985) | ||
| 43159.36 | 9.42 | 8.46 | 8.41 | 6.87 | SAAO | Lloyd Evans (1985) | ||||
| 9.845 | 9.093 | 8.038 | DENIS | VIZIER | ||||||
| 9.042 | 8.597 | 7.986 | 2 MASS | VIZIER | ||||||
| 8 | HD 44179 | 6.59 | 4.95 | 3.19 | 1.22 | ESO | C. Waelkens | |||
| 8.981 | 6.280 | 3.807 | DENIS | VIZIER | ||||||
| 6.577 | 5.145 | 3.655 | 2 MASS | VIZIER | ||||||
| 9 | HD 46703 | 7.805 | 7.513 | 7.435 | 2MASS | VIZIER | ||||
| 10 | ST Pup | 43159.44 | 8.38 | 8.03 | 7.67 | 6.42 | SAAO | Lloyd Evans (1985) | ||
| 9.292 | 8.437 | 7.839 | DENIS | VIZIER | ||||||
| 8.506 | 8.250 | 8.082 | 2 MASS | VIZIER | ||||||
| 11 | HD 52961 | 6.36 | 5.98 | 5.54 | 4.25 | 3.97 | ESO | C. Waelkens | ||
| 6.323 | 5.978 | 5.526 | 2 MASS | VIZIER | ||||||
| 12 | SAO 173329 | 9.42 | 8.96 | 8.27 | 6.49 | 5.67 | ESO | C. Waelkens | ||
| 9.375 | 8.917 | 8.308 | 2 MASS | VIZIER | ||||||
| 13 | U Mon | 2.4 | 1.5 | Kitt Peak NO | Gehrz & Woolf (1970) | |||||
| Arizona system | ||||||||||
| 3.7 | 2.7 | 1.7 | Mt Lemmon | Gehrz (1972) | ||||||
| Arizona system | ||||||||||
| 42684.65 | 4.01 | 3.65 | 3.25 | 2.40 | SAAO | Lloyd Evans (1985) | ||||
| 43160.45 | 4.88 | 4.43 | 4.08 | 3.08 | SAAO | Lloyd Evans (1985) | ||||
| 4.35 | 3.93 | 3.60 | 2.30 | 1.61 | ESO | C. Waelkens | ||||
| 4.925 | 4.269 | 4.042 | 2 MASS | VIZIER | ||||||
| 14 | AR Pup | 43184.46 | 6.12 | 4.95 | 3.67 | 1.68 | SAAO | Lloyd Evans (1985) | ||
| 42737.58 | 7.20 | 5.98 | 4.40 | 2.08 | SAAO | Lloyd Evans (1985) | ||||
| 8.937 | 6.931 | 3.682 | DENIS | VIZIER | ||||||
| 7.891 | 6.824 | 5.285 | 2 MASS | VIZIER | ||||||
| 15 | IRAS 08544 | 5.65 | 4.67 | 3.51 | 1.59 | SAAO | T. Lloyd Evans (mean) | |||
| 9.043 | 5.741 | 3.813 | DENIS | VIZIER | ||||||
| 5.575 | 4.743 | 3.523 | 2 MASS | VIZIER | ||||||
| 16 | IRAS 09060 | 50263.20 | 8.60 | 7.63 | 6.68 | 5.16 | SAAO | T. Lloyd Evans | ||
| 50511.38 | 9.27 | 8.13 | 6.99 | 5.35 | SAAO | T. Lloyd Evans | ||||
| 9.130 | 8.060 | 6.949 | 2 MASS | VIZIER | ||||||
| 17 | IRAS 09144 | 49125.31 | 8.33 | 7.12 | 6.00 | 4.23 | SAAO | T. Lloyd Evans | ||
| 49475.28 | 8.55 | 7.35 | 6.21 | 4.31 | SAAO | T. Lloyd Evans | ||||
| 10.801 | 8.305 | 6.235 | DENIS | VIZIER | ||||||
| 8.372 | 7.391 | 6.369 | 2 MASS | VIZIER | ||||||
| 18 | IW Car | 43184.48 | 5.86 | 5.18 | 4.24 | 2.41 | SAAO | Lloyd Evans (1985) | ||
| 43155.56 | 5.94 | 5.20 | 4.31 | 2.44 | SAAO | Lloyd Evans (1985) | ||||
| 5.875 | 5.151 | 4.367 | 2 MASS | VIZIER | ||||||
| 19 | IRAS 09400 | 49122.29 | 6.57 | 5.58 | 5.16 | 4.33 | SAAO | T. Lloyd Evans | ||
| 50511.40 | 6.61 | 5.59 | 5.20 | 4.35 | SAAO | T. Lloyd Evans | ||||
| 6.547 | 5.626 | 5.159 | 2 MASS | VIZIER | ||||||
| 20 | IRAS 09538 | 49741.57 | 9.18 | 8.49 | 7.61 | 6.09 | SAAO | T. Lloyd Evans | ||
| 49031.52 | 9.62 | 8.82 | 8.02 | 6.36 | SAAO | T. Lloyd Evans | ||||
| 10.530 | 9.278 | 7.703 | DENIS | VIZIER | ||||||
| 9.402 | 8.574 | 7.721 | 2 MASS | VIZIER | ||||||
| 21 | HR 4049 | 4.73 | 4.16 | 3.13 | 1.39 | 0.91 | ESO | C. Waelkens | ||
| 3.677 | DENIS | VIZIER | ||||||||
| 4.921 | 4.225 | 3.208 | 2 MASS | VIZIER | ||||||
| 22 | IRAS 10174 | 49474.35 | 5.20 | 4.07 | 3.54 | 2.87 | SAAO | T. Lloyd Evans | ||
| 50262.22 | 5.43 | 4.29 | 3.74 | 3.04 | SAAO | T. Lloyd Evans | ||||
| 8.644 | 5.583 | 3.481 | DENIS | VIZIER | ||||||
| 5.313 | 4.490 | 3.931 | 2 MASS | VIZIER | ||||||
| 23 | IRAS 10456 | 3.45 | 2.55 | 2.15 | 1.11 | SAAO | T. Lloyd Evans (mean) | |||
| 3.354 | 2.469 | 2.045 | 2 MASS | VIZIER | ||||||
| 24 | HD 95767 | 7.05 | 6.48 | 5.59 | 3.50 | 2.80 | ESO | C. Waelkens | ||
| 8.786 | 7.313 | 4.964 | DENIS | VIZIER | ||||||
| 7.098 | 6.532 | 5.636 | 2 MASS | VIZIER | ||||||
| 25 | GK Car | 43184.56 | 9.05 | 8.26 | 8.14 | 6.42 | SAAO | Lloyd Evans (1985) | ||
| 43159.52 | 9.27 | 8.46 | 7.87 | 6.64 | SAAO | Lloyd Evans (1985) | ||||
| 10.150 | 9.123 | 7.970 | DENIS | VIZIER | ||||||
| 9.328 | 8.716 | 8.171 | 2 MASS | VIZIER | ||||||
| 26 | IRAS 11472 | 9.657 | 9.047 | 8.630 | 2 MASS | VIZIER | ||||
| 27 | RU Cen | 43188.51 | 7.08 | 6.65 | 6.47 | 6.53 | SAAO | Lloyd Evans (1985) | ||
| 43158.58 | 7.14 | 6.68 | 6.39 | 5.63 | SAAO | Lloyd Evans (1985) | ||||
| 46243.25 | 7.56 | 7.04 | 6.83 | 6.33 | 5.60 | SAAO | Goldsmith et al. (1987) | |||
| 46248.28 | 8.00 | 7.44 | 7.20 | SAAO | Goldsmith et al. (1987) | |||||
| 7.45 | 7.02 | 6.73 | 6.08 | 5.47 | ESO | C. Waelkens | ||||
| 7.68 | 7.15 | 6.86 | 6.34 | 5.80 | ESO | Garcia-Lario et al. (1997) | ||||
| 8.600 | 7.151 | 6.654 | DENIS | VIZIER | ||||||
| 7.616 | 7.186 | 6.918 | 2 MASS | VIZIER | ||||||
| 28 | SX Cen | 43159.57 | 7.94 | 7.63 | 6.88 | 5.74 | SAAO | Lloyd Evans (1985) | ||
| 46243.26 | 7.86 | 7.25 | 6.62 | 5.20 | 4.30 | SAAO | Goldsmith et al. (1987) | |||
| 46248.30 | 8.12 | 7.51 | 7.00 | 5.65 | 4.73 | SAAO | Goldsmith et al. (1987) | |||
| 8.962 | 7.660 | 6.448 | DENIS | VIZIER | ||||||
| 7.875 | 7.443 | 6.759 | 2 MASS | VIZIER | ||||||
| 29 | HD 108015 | 7.03 | 6.39 | 5.32 | 3.50 | SAAO | T. Lloyd Evans (mean) | |||
| 7.03 | 6.40 | 5.28 | 3.14 | 2.49 | ESO | C. Waelkens | ||||
| 6.941 | 6.380 | 5.338 | 2 MASS | VIZIER | ||||||
| 30 | IRAS 13258 | 50508.64 | 11.65 | 9.87 | 8.29 | 6.52 | SAAO | T. Lloyd Evans | ||
| 50204.46 | 12.11 | 10.05 | 8.48 | 6.56 | SAAO | T. Lloyd Evans | ||||
| 14.474 | 12.569 | DENIS | VIZIER | |||||||
| 12.160 | 10.630 | 9.303 | 2 MASS | VIZIER | ||||||
| 31 | EN TrA | 42945.38 | 7.19 | 6.67 | 6.03 | 4.69 | SAAO | Lloyd Evans (1985) | ||
| 7.10 | 6.53 | 5.73 | 3.92 | 3.38 | ESO | C. Waelkens | ||||
| 7.092 | 6.578 | 5.931 | 2 MASS | VIZIER | ||||||
| 32 | IRAS 15469 | 7.24 | 6.21 | 4.89 | 2.89 | SAAO | T. Lloyd Evans (mean) | |||
| 7.190 | 6.235 | 4.967 | 2 MASS | VIZIER | ||||||
| 33 | IRAS 15556 | 48778.44 | 9.42 | 8.34 | 6.89 | 4.55 | SAAO | T. Lloyd Evans | ||
| 50642.32 | 9.51 | 8.38 | 6.88 | 4.49 | SAAO | T. Lloyd Evans | ||||
| 10.877 | 9.440 | 6.887 | DENIS | VIZIER | ||||||
| 9.423 | 8.350 | 6.940 | 2 MASS | VIZIER | ||||||
| 34 | IRAS 16230 | 49124.51 | 9.10 | 8.48 | 7.79 | 6.29 | SAAO | T. Lloyd Evans | ||
| 48819.36 | 9.37 | 8.77 | 8.12 | 6.26 | SAAO | T. Lloyd Evans | ||||
| 9.002 | 8.510 | 7.812 | 2 MASS | VIZIER | ||||||
| 35 | IRAS 17038 | 50641.37 | 7.74 | 7.00 | 6.58 | 5.54 | SAAO | T. Lloyd Evans | ||
| 49473.66 | 8.36 | 7.64 | 7.16 | 6.11 | SAAO | T. Lloyd Evans | ||||
| 9.434 | 7.791 | 6.369 | DENIS | VIZIER | ||||||
| 7.622 | 7.050 | 6.523 | 2 MASS | VIZIER | ||||||
| 36 | IRAS 17233 | 50204.56 | 10.03 | 8.89 | 7.28 | 4.86 | SAAO | T. Lloyd Evans | ||
| 49474.60 | 10.89 | 9.68 | 7.72 | 5.09 | SAAO | T. Lloyd Evans | ||||
| 10.423 | 9.592 | 8.371 | 2 MASS | VIZIER | ||||||
| 37 | IRAS 17243 | 8.17 | 7.46 | 6.52 | 4.75 | SAAO | T. Lloyd Evans (mean) | |||
| 9.314 | 8.177 | 6.592 | DENIS | VIZIER | ||||||
| 8.035 | 7.358 | 6.462 | 2 MASS | VIZIER | ||||||
| 38 | 89 Her | 4.998 | 4.239 | 3.632 | 2 MASS | VIZIER | ||||
| 39 | AI Sco | 42997.35 | 6.74 | 5.94 | 5.14 | 3.79 | SAAO | Lloyd Evans (1985) | ||
| 46245.48 | 6.62 | 5.98 | 5.33 | 3.81 | SAAO | Goldsmith et al. (1987) | ||||
| 6.864 | 6.179 | 5.485 | 2 MASS | VIZIER | ||||||
| 40 | IRAS 18123 | 8.04 | 7.44 | 6.86 | 5.39 | SAAO | T. Lloyd Evans (mean) | |||
| 7.974 | 7.399 | 6.729 | 2 MASS | VIZIER | ||||||
| 41 | IRAS 18158 | 48778.52 | 10.52 | 9.31 | 8.01 | 6.40 | SAAO | T. Lloyd Evans | ||
| 50204.60 | 11.15 | 9.80 | 8.27 | 6.17 | SAAO | T. Lloyd Evans | ||||
| 12.341 | 10.958 | 8.291 | DENIS | VIZIER | ||||||
| 10.788 | 9.489 | 8.120 | 2 MASS | VIZIER | ||||||
| 42 | AC Her | 4.4 | 4.0 | Kitt Peak NO | Gehrz & Woolf (1970) | |||||
| Arizona system | ||||||||||
| 5.2 | 4.7 | 3.6 | Mt Lemmon | Gehrz (1972) | ||||||
| Arizona system | ||||||||||
| 42456.87 | 5.97 | 5.52 | 5.28 | 4.73 | Tenerife | Lloyd Evans (1985) | ||||
| 46243.52 | 5.89 | 5.39 | 5.16 | 4.66 | 3.90 | SAAO | Goldsmith et al. (1987) | |||
| 46248.47 | 6.21 | 5.66 | 5.40 | 4.87 | 4.55 | SAAO | Goldsmith et al. (1987) | |||
| 5.700 | 5.338 | 5.075 | 2 MASS | VIZIER | ||||||
| 43 | AD Aql | 46253.53 | 9.62 | 9.14 | 8.95 | SAAO | Goldsmith et al. (1987) | |||
| 9.543 | 9.134 | 9.002 | 2 MASS | VIZIER | ||||||
| 44 | IRAS 19125 | 7.48 | 6.47 | 5.38 | 3.52 | SAAO | T. Lloyd Evans (mean) | |||
| 8.356 | 7.442 | 7.067 | 2 MASS | VIZIER | ||||||
| 45 | EP Lyr | 6.6 | Mt Lemmon | Gehrz (1972) | ||||||
| Arizona system | ||||||||||
| 8.534 | 8.153 | 8.030 | 2 MASS | VIZIER | ||||||
| 46 | IRAS 19157 | 48779.58 | 8.89 | 8.12 | 6.95 | 5.13 | SAAO | T. Lloyd Evans | ||
| 48820.44 | 8.94 | 8.16 | 6.92 | 5.32 | SAAO | T. Lloyd Evans | ||||
| 9.713 | 8.966 | 7.109 | DENIS | VIZIER | ||||||
| 8.872 | 8.205 | 7.020 | 2 MASS | VIZIER | ||||||
| 47 | IRAS 20056 | 45897.49 | 9.99 | 8.89 | 7.31 | 4.77 | SAAO | Menzies & Whitelock (1988) | ||
| 46693.29 | 10.55 | 9.20 | 7.43 | 4.78 | SAAO | Menzies & Whitelock (1988) | ||||
| 10.097 | 8.964 | 7.471 | 2 MASS | VIZIER | ||||||
| 48 | R Sge | 4.5 | 3.3 | Kitt Peak NO | Gehrz & Woolf (1970) | |||||
| Arizona system | ||||||||||
| 4.6 | 3.6 | Mt Lemmon | Gehrz (1972) | |||||||
| Arizona system | ||||||||||
| 46248.54 | 7.10 | 6.50 | 5.80 | 4.50 | SAAO | Goldsmith et al. (1987) | ||||
| 7.818 | 7.234 | 6.539 | 2 MASS | VIZIER | ||||||
| 49 | V Vul | 4.2 | 3.4 | Mt Lemmon | Gehrz (1972) | |||||
| Arizona system | ||||||||||
| 6.557 | 6.019 | 5.396 | 2 MASS | VIZIER | ||||||
| 50 | HD 213985 | 8.18 | 7.60 | 6.68 | 5.00 | 4.45 | ESO | C. Waelkens | ||
| 8.276 | 7.609 | 6.705 | 2 MASS | VIZIER | ||||||
| 51 | BD39∘4926 | 8.539 | 8.394 | 8.338 | 2 MASS | VIZIER |
| No | Name | (Jy) | (Jy) | (Jy) | (Jy) |
|---|---|---|---|---|---|
| m | m | m | m | ||
| 1 | TW Cam | 8.25 | 5.60 | 1.84 | 1.79L |
| 2 | RV Tau | 22.52 | 18.05 | 6.50 | 2.44: |
| 3 | IRAS 05208 | 9.53 | 9.30 | 2.78 | 1.40 |
| 4 | DY Ori | 12.43 | 14.89 | 4.18 | 11.46L |
| 5 | CT Ori | 6.14 | 5.55 | 1.24 | 1.59L |
| 6 | SU Gem | 7.91 | 5.68 | 2.19 | 11.99L |
| 7 | UY CMa | 3.49 | 2.46 | 0.57 | 1.00L |
| 8 | HD 44179 | 421.60 | 456.10 | 173.10 | 66.19 |
| 9 | HD 46703 | 0.46 | 0.38: | 0.40L | 1.15L |
| 10 | ST Pup | 3.51 | 5.92 | 1.24 | 1.13L |
| 11 | HD 52961 | 4.53 | 2.22 | 0.95 | 0.87: |
| 12 | SAO 173329 | 2.28 | 1.83 | 0.64 | 10.45L |
| 13 | U Mon | 124.30 | 88.43 | 26.59 | 9.54 |
| 14 | AR Pup | 131.30 | 94.32 | 26.12 | 11.96: |
| 15 | IRAS 08544 | 180.30 | 158.80 | 56.25: | 28.43L |
| 16 | IRAS 09060 | 3.78 | 2.53 | 0.65 | 1.00L |
| 17 | IRAS 09144 | 15.31 | 12.14 | 2.86 | 24.68L |
| 18 | IW Car | 101.00 | 96.24 | 34.52 | 13.46 |
| 19 | IRAS 09400 | 7.85 | 5.48 | 1.58 | 8.34L |
| 20 | IRAS 09538 | 2.33 | 1.60 | 0.53 | 1.34L |
| 21 | HR 4049 | 48.25 | 9.55 | 1.77 | 1.69L |
| 22 | IRAS 10174 | 41.80 | 60.39 | 16.13: | 174.30L |
| 23 | IRAS 10456 | 189.10 | 115.50 | 30.86 | 10.89 |
| 24 | HD 95767 | 22.13 | 15.65 | 10.90 | 58.88 |
| 25 | GK Car | 2.85 | 2.45 | 0.79 | 12.41L |
| 26 | IRAS 11472 | 11.35 | 14.18 | 1.78 | 1.00L |
| 27 | RU Cen | 5.32 | 10.96 | 5.65 | 2.09 |
| 28 | SX Cen | 5.92 | 3.59 | 1.10 | 1.55L |
| 29 | HD 108015 | 32.46 | 33.23 | 7.99 | 2.41 |
| 30 | IRAS 13258 | 1.90 | 2.97 | 1.46 | 3.82: |
| 31 | EN TrA | 13.20 | 10.30 | 4.11 | 2.12 |
| 32 | IRAS 15469 | 48.81 | 42.12 | 15.50 | 278.10L |
| 33 | IRAS 15556 | 19.86 | 17.80 | 7.10 | 189.80L |
| 34 | IRAS 16230 | 4.29 | 3.34 | 0.82 | 14.55L |
| 35 | IRAS 17038 | 8.05 | 9.67 | 4.49 | 43.34L |
| 36 | IRAS 17233 | 17.02 | 13.40 | 3.67 | 32.08L |
| 37 | IRAS 17243 | 10.76 | 8.77 | 3.69 | 5.41: |
| 38 | 89 Her | 97.52 | 54.49 | 13.42 | 6.04 |
| 39 | AI Sco | 17.59 | 11.38 | 2.95 | 46.76L |
| 40 | IRAS 18123 | 10.72 | 11.02 | 4.21 | 1.85L |
| 41 | IRAS 18158 | 3.00 | 2.64 | 1.03 | 1.56L |
| 42 | AC Her | 41.43 | 65.33 | 21.37 | 8.04 |
| 43 | AD Aql | 2.49 | 2.72 | 0.65L | 24.46L |
| 44 | IRAS 19125 | 28.89 | 26.51 | 7.81 | 28.05L |
| 45 | EP Lyr | 0.31L | 0.50 | 0.40L | 2.10L |
| 46 | IRAS 19157 | 8.88 | 7.16 | 2.45 | 11.05L |
| 47 | IRAS 20056 | 17.52 | 18.01 | 5.38 | 2.84L |
| 48 | R Sge | 10.60 | 7.54 | 2.12 | 1.72L |
| 49 | V Vul | 12.35 | 5.69 | 1.29 | 7.25L |
| 50 | HD 213985 | 5.57 | 4.66 | 2.11 | 1.01L |
| No | Name | B1 (Jy) | B2 (Jy) | A (Jy) | C (Jy) | D (Jy) | E (Jy) |
|---|---|---|---|---|---|---|---|
| m | m | m | m | m | m | ||
| 4 | DY Ori | 9.073 | 11.58 | 11.89 | 13.97 | ||
| 5 | CT Ori | 2.618 | 3.928 | 1.421 | 6.761 | ||
| 6 | SU Gem | 8.283 | 7.666 | 7.178 | 7.505 | ||
| 10 | ST Pup | 4.419 | 5.743 | 5.464 | 7.199 | ||
| 13 | U Mon | 42.93 | 56.45 | 88.71 | 72.38 | 73.29 | |
| 14 | AR Pup | 72.73 | 81.04 | 114.3 | 118.0 | 100.2 | 91.48 |
| 15 | IRAS 08544 | 76.62 | 51.92 | 139.0 | 150.7 | 143.6 | 134.2 |
| 17 | IRAS 09144 | 7.285 | 10.69 | 11.61 | 10.31 | 9.341 | |
| 19 | IRAS 09400 | 4.814 | 3.847 | 3.072 | 3.034 | ||
| 22 | IRAS 10174 | 16.89 | 19.14 | 25.84 | 33.91 | 28.70 | 45.77 |
| 23 | IRAS 10456 | 139.5 | 147.8 | 165.4 | 148.1 | 126.7 | 106.3 |
| 24 | HD 95767 | 12.33 | 18.96 | 18.70 | 16.33 | 13.09 | |
| 25 | GK Car | 2.774 | 2.630 | 2.172 | 2.086 | ||
| 32 | IRAS 15469 | 34.65 | 35.82 | 42.91 | 45.97 | 40.16 | 37.48 |
| 33 | IRAS 15556 | 16.63 | 17.50 | 17.20 | 14.98 | ||
| 35 | IRAS 17038 | 10.45 | 12.66 | 10.93 | 11.09 | ||
| 36 | IRAS 17233 | 13.94 | 15.28 | 12.87 | 10.74 | ||
| 37 | IRAS 17243 | 9.254 | 9.280 | 8.408 | 7.775 | ||
| 39 | AI Sco | 15.26 | 14.89 | 12.72 | 8.562 | ||
| 44 | IRAS 19125 | 23.43 | 24.55 | 26.48 | 23.90 | 22.54 |
| No | Name | (mJy) | Reference | |
|---|---|---|---|---|
| 1 | TW Cam | 11.0 | 2.3 | De Ruyter et al. (2005) |
| 2 | RV Tau | 50.3 | 3.6 | De Ruyter et al. (2005) |
| 6 | SU Gem | 7.5 | 2.5 | De Ruyter et al. (2005) |
| 7 | UY CMa | 2.4 | 2.1 | De Ruyter et al. (2005) |
| 11 | HD 52961 | 2.8 | 1.9 | new data |
| 13 | U Mon | 181.6 | 2.6 | De Ruyter et al. (2005) |
| 21 | HR 4049 | 8.7 | 2.8 | new data |
| 10.4 | 2.2 | Dominik et al. (2003) | ||
| 38 | 89 Her | 40.9 | 2.4 | new data |
| 42 | AC Her | 99.4 | 3.8 | De Ruyter et al. (2005) |
| 47 | IRAS 20056 | 21.8 | 1.8 | Gledhill et al. (2002) |