An efficient technique for pre-selecting low redshift damped Lyman alpha systems.
Abstract
The number of damped Lyman alpha systems (DLAs, log (H I) 20.3) per unit redshift is approximately 0.1, making them relatively rare objects. Large, blind QSO surveys for low redshift DLAs are therefore an expensive prospect for space-borne UV telescopes. Increasing the efficiency of these surveys by pre-selecting DLA candidates based on the equivalent widths of metal absorption lines has previously been a successful strategy. However, the success rate of DLA identification is still only 35% when simple equivalent width cut-offs are applied, the majority of systems having log (H I) . Here we propose a new way to pre-select DLA candidates. Our technique requires high-to-moderate resolution spectroscopy of the Mg II 2796 transition, which is easily accessible from the ground for . We define the -index, the ratio of the line’s equivalent width to velocity spread and measure this quantity for 19 DLAs and 8 sub-DLAs in archival spectra obtained with echelle spectrographs. For the majority of absorbers, there is a clear distinction between the -index of DLAs compared with sub-DLAs (Kolmogorov-Smirnov probability = 0.8 %). Based on this pilot data sample, we find that the -index can select DLAs with a success rate of up to 90%, an increase in selection efficiency by a factor of 2.5 compared with a simple equivalent width cut. We test the applicability of the -index at lower resolution and find that it remains a good discriminant of DLAs for FWHM 1.5 Å. However, the recommended -index cut-off between DLAs and sub-DLAs decreases with poorer resolution and we tabulate the appropriate -index values that should be used with spectra of different resolutions.
keywords:
quasars: absorption lines – techniques: spectroscopic1 Introduction
The compilation of large spectroscopic datasets, such as the Sloan Digital Sky Survey (SDSS), has proven a major boon for the study of QSO absorption lines. These surveys have yielded many hundreds of damped Lyman alpha systems (DLAs, absorption systems with (H I) cm-2) which can be used to study the evolution of the galactic neutral gas content at (e.g. Prochaska, Herbert-Fort & Wolfe 2005). In the local universe, several wide field 21cm surveys have characterised the distribution of neutral hydrogen gas (e.g. Zwaan et al. 2005; Rosenberg & Schneider 2003; Ryan-Weber, Webster & Staveley-Smith 2003). Bridging these extremes, over a redshift range that is emerging as a crucial time in galaxy formation, is a high priority for absorption line studies. In practice, however, the low redshift universe has been challenging to survey. The Ly line is shifted into the UV at where space telescopes are required. Given the limited resources, large-scale, blind surveys for low redshift DLAs are expensive and largely unpalatable to time assignment committees. For this reason, pre-selection of low DLA candidates based on low resolution, ground-based spectra has become an important first step in UV surveys (Rao & Turnshek 2000; Rao, Turnshek & Nestor 2006). The equivalent widths (EWs) of resonance lines with red rest wavelengths, such as Mg II 2796, 2803 and Fe II 2600, are easily measured from the ground in systems with (H I) cm-2 and . Rao et al. (2006) showed that 35% of absorbers with rest frame EW(Mg II 2796, Fe II 2600) 0.5 Å have column densities above the canonical DLA limit, (H I) cm-2. Although absorbers below this limit (sub-DLAs) make a non-negligible contribution to the total neutral gas content of the universe at high redshifts (Péroux et al. 2005; Prochaska et al. 2005), they are usually excluded from statistical samples. Therefore, although EW pre-selection has been a pivotal strategem of recent Hubble Space Telescope (HST) surveys, the 35% ‘success rate’ of metal line pre-selection could be considered low. Moreover, whilst a confirmation probability can be applied in a statistical sense, there is no way of knowing which individual Mg II absorber is most likely to be a DLA, since there is no correlation between Mg II EW and (H I). For example, a DLA confirmation rate of 35% applied to the Mg II system survey of Ellison et al. (2004a) yields a DLA number density of (Ellison 2005). However, UV follow-up of the 14 high EW Mg II systems in the Ellison et al. sample is still required in order to confirm the identity of the expected 5 DLAs.
In this paper, we investigate whether ground-based spectra of metal lines at high resolution can provide additional information to help discriminate between DLAs and sub-DLAs. Our objective is to identify a quantitative measure that will efficiently separate DLAs and sub-DLAs with a success rate 35%. If the inclusion of sub-DLAs (i.e. false positives) can be minimised, the obvious benefit will be that UV follow-up for DLA confirmation and (H I) determination will be far more efficient. Moreover, if the pre-selection is complete for high (H I) DLAs, any quantity weighted by (H I), such as the total neutral gas content, will be robust, even if a few lower (H I) systems are missed in the pre-selection process. Finally, a high success rate DLA discriminant could be applied to surveys of Mg II absorption systems to directly infer the DLA number density to a relatively high degree of accuracy, with no need for UV observations.
2 Data
In order to investigate the properties of DLAs and sub-DLAs, we compile a sample of absorbers with known (H I) column densities and echelle spectroscopy which covers the Mg II transition. In practice, the high resolution spectroscopy was obtained with either HIRES on Keck or UVES on the Very Large Telescope (VLT), see Table 1 for references. In the final column of Table 1 we give the FWHM resolution of the spectrum at the wavelength of the redshifted Mg II transition. These spectra were generously provided by a number of individuals (see Acknowledgements) with the continua already normalized. We return to the impact of continuum fitting in the next section.
The first DLA surveys relied on an equivalent width selection based on relatively low ( 10 Å FWHM) spectra. This selection was therefore susceptible to blending of absorbers below the DLA (H I) limit. As shown by Ellison (2000), for EW 10 Å, the fraction of true DLAs is 50%. We therefore only select absorbers from the literature whose (H I) is based on spectra with a FWHM resolution of at least 5 Å. In most cases, this is sufficient to adequately fit damping wings with errors typically 0.1 dex (e.g. Ellison et al 2001; Rao, Turnshek & Nestor 2006). In Table 1 we present the QSOs used in this study, as well as references to the (H I) column densities and metal abundances which have been normalised to the solar (meteoritic) scale of Lodders (2003). We have assumed that ionization corrections to Zn II and Fe II are negligible, which has largely been found to be the case even in lower column density systems (Péroux et al. 2003).
| QSO | (H I) | [Zn/H] | [Fe/H] | S/N | Refs ((H I),[X/H]) | Resolution (Å) | ||
|---|---|---|---|---|---|---|---|---|
| Q0058+019 | 0.613 | 20.080.20 | 65 | 8.5 | 1,1 | 0.10 | ||
| Q0100+130 | 2.309 | 21.370.08 | 35 | 7.4 | 2,2 | 0.20 | ||
| Q0512333A | 0.931 | 20.490.08 | … | 60 | 6.2 | 3,3 | 0.17 | |
| Q0512333B | 0.931 | 20.470.08 | … | 45 | 6.5 | 3,3 | 0.17 | |
| Q0827+24 | 0.525 | 20.30.05 | 20 | 8.5 | 4,5 | 0.08 | ||
| Q0841+129 | 2.375 | 20.990.08 | 17 | 8.7 | 6,6 | 0.21 | ||
| Q0957+561A | 1.391 | 20.30.1 | 30 | 7.6 | 7,7 | 0.12 | ||
| Q0957+561B | 1.391 | 19.900.10 | 25 | 8.2 | 7,7 | 0.12 | ||
| Q1101264 | 1.838 | 19.500.05 | 40 | 5.8 | 8,8 | 0.17 | ||
| Q1104180 | 1.662 | 20.850.01 | 40 | 9.0 | 9,9 | 0.15 | ||
| Q1122168 | 0.682 | 20.450.05 | 45 | 8.2 | 10,10 | 0.11 | ||
| Q1151+068 | 1.774 | 21.300.08 | … | … | 15 | 8.6 | 11 | 0.18 |
| Q1157+014 | 1.944 | 21.600.10 | 30 | 8.2 | 6,6 | 0.23 | ||
| Q1210+173 | 1.892 | 20.630.08 | 20 | 6.9 | 6,6 | 0.17 | ||
| Q1223+175 | 2.466 | 21.440.08 | 15 | 8.4 | 11,11 | 0.23 | ||
| Q1247+267 | 1.223 | 19.880.10 | 75 | 5.0 | 12,12 | 0.12 | ||
| Q1331+170 | 1.776 | 21.140.08 | 45 | 6.5 | 2,2 | 0.18 | ||
| Q1351+318 | 1.149 | 20.230.10 | 30 | 6.3 | 12,12 | 0.12 | ||
| Q1451+123 | 2.255 | 20.300.15 | 6 | 8.3 | 8,8 | 0.16 | ||
| Q1622+238 | 0.656 | 20.40.1 | … | … | 27 | 8.5 | 4 | 0.12 |
| Q1629+120 | 0.900 | 19.700.04 | 33 | 5.7 | 13,14 | 0.12 | ||
| Q2128123 | 0.430 | 19.370.08 | … | 28 | 5.8 | 10,10 | 0.09 | |
| Q2206199 | 1.920 | 20.440.08 | … | 15 | 8.1 | 15,15 | … | |
| Q2230+023 | 1.859 | 20.000.10 | … | … | 20 | 5.4 | 6 | 0.17 |
| Q2231001 | 2.066 | 20.530.08 | 40 | 7.8 | 2,2 | 0.20 | ||
| Q2343+125 | 2.431 | 20.350.05 | 15 | 8.2 | 2,2 | 0.21 | ||
| Q2348144 | 2.279 | 20.590.08 | 35 | 9.2 | 6,6 | 0.20 |
Upper limits are 3. 1 - Pettini et al. (2000); 2 - Dessauges-Zavadsky et al. (2004); 3 - Lopez et al. (2005); 4 - Rao & Turnshek (2000); 5 - Kulkarni et al. (2005); 6 - Dessauges-Zavadsky et al. (2006); 7 - Churchill et al. (2003); 8 - Dessauges-Zavadsky et al. (2003); 9 - Lopez et al (1999); 10 - Ledoux, Bergeron & Petitjean (2002); 11 - Dessauges-Zavadsky, private communication; 12 - Pettini et al. (1999); 13 - Rao, Turnshek & Nestor (2006); 14 - This work; 15 - Pettini et al. (2002);
In addition to the referenced archival data, we present previously unpublished data for the sub-DLA towards Q1629+120 whose (H I) was determined by Rao et al. (2006). The echelle data were obtained as part of ESO program 69.A-0410(A) (PI, Athreya) on the UVES spectrograph on UT2 at the VLT. A total of 12,000 seconds of data were obtained in service mode between April and May 2002 using Dic1 346–580, yielding a wavelength coverage of 3100–3870, 4800–5750, 5850–6800 Å. Data reduction was executed using the MIDAS routines of the UVES pipeline as described in full by Ellison, Ryan & Prochaska (2001). We fitted the continuum using a 3rd order Chebyshev polynomial based on absorption-free regions 10 Å wide either side of the Mg II absorption. The final ‘archival’ sample used in this study therefore consists of 19 DLAs and 8 sub-DLAs which have all been observed with either UVES or HIRES and therefore have typical FWHM resolutions of 6 – 8 km s-1.
3 The -index
From the high resolution data, we measure the rest frame EWs and velocity spread of the Mg II 2796 absorption line. In calculating these quantities, we exclude ‘detached’ absorption components where the continuum is recovered and only include the complex with the largest EW. We set as the limits of absorption that are significant at the 3 level below the continuum, see Figure 1. In this study we restrict ourselves to the Mg II 2796 line since we are working with archival data with restricted wavelength access. Nonetheless, Mg II is a useful line since it has a high oscillator strength (and is therefore easy to detect) and is observable for most low-to-intermediate redshift DLAs.
In Figure 2 we demonstrate the well known scatter between (H I) and Mg II EW. In our sample, the highest EWs are exhibited by absorbers on the cusp of DLA classification. Similarly, moderate EWs 1 Å can be associated with absorbers whose (H I) column density ranges over two orders of magnitude. It has been previously noted (e.g. Nestor et al. 2003) that the EW of Mg II 2796 is more an indication of velocity spread than it is of (H I). This is the reason that a simple EW cut-off applied to low resolution spectra contains such a high fraction of sub-DLAs. An EW cut is unable to distinguish between a few highly saturated Mg II absorption components and many lower column density clouds; the distinction between these two is shown in Figure 1. Qualitatively, DLAs tend to be characterised by the former, with wide, saturated absorption troughs and sub-DLAs by the latter.


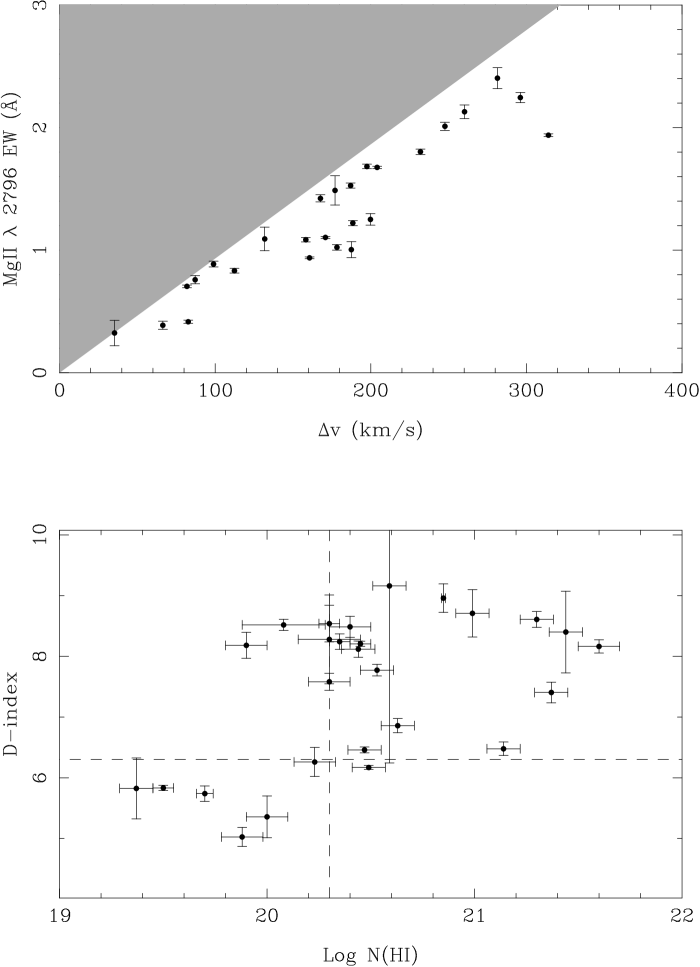
In the upper panel of Figure 3 we plot the EW (Å) of Mg II 2796 versus its velocity spread (, km/s). Within the bounds of and , which define the velocity spread, it is simple to show that there is a maximum EW. For this reason, there is a sharp cut-off in EW in the upper panel of Figure 3, where the shaded area shows the locus of forbidden values. In the lower panel of Figure 3 the data are plotted as a function of (H I) and we combine the velocity and EW information in a single parameter, , where
| (1) |
The error in the EW ( EW) is calculated from the 1 spectral error arrays on a pixel-by-pixel basis and propagated across the velocity width, , of the line. Since we have explicitly defined , the error in the -index ( D) is simply calculated from
| (2) |
The errors do not include systematic uncertainties associated with, for example, continuum fitting. The effect of continuum fitting should be negligible in the determination of the -index for several reasons. First, the Mg II transition usually lies well redwards of the Ly forest in a spectral region where the continuum is relatively flat and unabsorbed. Continuum fitting in these regions is usually straightforward. Second, since the majority of the Mg II lines are heavily saturated, they will be relatively insensitive to errors in the continuum fit. We experimented by re-fitting the continuum of Q1629+120 with 5 different combinations of polynomial and spectral region. Re-calculating the -index shows errors 1%, i.e. smaller than the random errors derived from Equation 2. We conclude that random errors in EW are likely to dominate over systematics such as the continuum fit.
In Table 1 we list the -indices for the archival sample. The high -index absorbers are those that are closest to the shaded area in the upper panel of Figure 3, whilst the low -index absorbers have lower EWs for their . Returning to the example absorbers shown in Figure 1 gives a visual impression of how the -index relates to spectral morphology.
There is a clear tendency for DLAs to have higher -indices than sub-DLAs (lower panel, Figure 3). Although there is not a clear dividing line between the populations, a -index cut-off of 6.3 includes all but 1 of the 19 DLAs (95%). We consider the fraction of DLAs above the -index cut-off to be the ‘success-rate’ of this pre-selection; for that rate is 90% in our archival sample of 27 absorbers. A Kolmogorov-Smirnov (KS) test applied to the -indices shows that the DLAs and sub-DLAs have only a 0.8% probability of being drawn from the same population. In the limited sample available to us, we also note that all DLAs with log (H I) 20.5 are included by a criterion. We experimented with including metallicity information into the -index, both the [Zn/H] abundance which is generally the preferred metallicity indicator, but also [Fe/H]. The abundance values used in our testing are given in Table 1. We found that including abundance (absolute or relative) information did not improve the observed distinction between DLAs and sub-DLAs. Although it is desirable to populate this parameter space with many more systems, the -index appears to be a promising method for pre-selecting DLAs if high resolution data are available.
4 Data Requirements
4.1 Resolution
We now consider the resolution requirements for the application of the -index. We test this by convolving each of the spectra used in this study with a Gaussian of steadily increasing FWHM (applicable at the wavelength of Mg II 2796) to simulate the effect of decreasing spectral resolution. We re-calculate the effective minimum and maximum wavelengths (which are used in the determination of the EW and ) taking into account the smoothing of the data on the S/N ratio. The -index of each convolved absorber and the KS probability of the two populations are then re-calculated.
We find that the DLA and sub-DLA populations are well separated for FWHM 1.5 Å (at the wavelength of redshifted Mg II 2796), as shown by the examples in Figure 4. However, the appropriate cut-off in -index decreases with decreasing resolution. This is expected given that the EW of the absorption line is conserved during the convolution, but the velocity spread increases. Lowering the resolution affects the -index of individual absorbers differently, depending on their kinematic profiles. For example, the success of the -index in our tests actually improves for FWHM = 0.4 Å, but this is just an artefact of the particular absorbers in our sample. The results of our convolution test highlight the need for a larger sample to statistically test the effect of resolution on the -index cut-off. Based on our current data, the recommended values of as a function of the resolution, as well as the KS probabilities, are given in Table 2. The fraction of absorbers above the recommended cut-off which are DLAs is given in the column labelled ‘Success rate’. The fraction of DLAs whose -index is below the recommended cut-off is given in the column labelled ‘Missed DLAs’. At resolutions below 1.5 Å it is still possible to set a -index that has a high success rate, but the fraction of missed DLAs exceeds 15% by FWHM 1.8Å and the KS probability indicates that the -indices of the DLAs and sub-DLAs are no longer significantly different. Nonetheless, a resolution of 1.5 Å is within the reach of many existing spectrographs, such as ISIS (William Herschel Telescope), EFOSC (ESO 3.6-m telescope), FORS (VLT) and ESI (Keck), as well as the very high resolution instruments used for this study. Unfortunately, however, based on the resolution tests and the current data, the SDSS data have slightly too low resolution for the -index to be successfully applied.
| Resolution | Recommended | Success | Missed | KS |
|---|---|---|---|---|
| (Å FWHM) | -index | Rate (%) | DLAs (%) | Prob. |
| 0.4 | 5.7 | 91 | 0 | 0.4 |
| 0.6 | 5.4 | 90 | 5 | 0.8 |
| 0.8 | 5.1 | 90 | 5 | 0.8 |
| 1.0 | 4.9 | 90 | 5 | 0.8 |
| 1.2 | 4.6 | 90 | 5 | 0.8 |
| 1.4 | 4.4 | 90 | 5 | 0.8 |
| 1.6 | 4.2 | 90 | 10 | 0.8 |
| 1.8 | 4.0 | 89 | 16 | 2 |
| 2.0 | 3.9 | 89 | 16 | 3 |
| 2.2 | 3.8 | 84 | 16 | 11 |


As a check of the convolution tests, we measured the -indices of five absorbers with known (H I) and existing ESI spectra provided by J. Prochaska. The absorbers are those towards SDSS1027+1405 ( 2.441, (H I) = 20.30), SDSS2036-0555 ( 2.280, (H I) = 21.20), SDSS1042+0117 ( 2.267, (H I) = 20.75), SDSS2059-0529 ( 2.210, (H I) = 20.90) and Q1337+11 ( 2.142, (H I) = 20.1). The data were obtained with a 0.5 arcsec slit and have a spectral resolution 1 Å, so we adopt a -index cut-off of 4.9 from Table 2. We plot the -indices versus (H I) in Figure 5, where we see that the DLAs (4/5 absorbers) all have values above the cut-off value whereas the one sub-DLA has . Although more extensive testing is required, these initial results from lower resolution spectra are encouraging.
Finally, since resolution has a significant impact on the measured -index, we have checked that the distribution of values in Figure 3 is not due to observing coincidence. We checked that both the distribution of absorber redshifts and spectral resolutions are random with respect to -index. Although the spectral resolutions listed in Table 1 do show some slight variation, there is no anti-correlation between -index and resolution. In fact, the handful of absorbers with FWHM 0.2 Å all have high -indices. The -index of DLAs is high for all resolutions represented by the archival sample, ranging from 0.11 – 0.23 Å. This is probably due to small numbers since a lower resolution will lead to a lower -index (see Figure 4).
4.2 Signal-to-Noise
We can do a similar test for the requisite signal-to-noise ratio (S/N). For two of the absorbers in our sample (one with a low -index, Q1247+267, and one with a high -index, Q0058+019) we produce a noiseless spectrum from a Voigt profile decomposition of the Mg II 2796 line. Many of the components are saturated, so this ‘fit’ does not yield accurate column densities and may be degenerate in the absence of a simultaneous fit with lower -value species. However, it does yield an accurate spectral profile to which noise can be added artificially. We add noise from a Gaussian distribution and simultaneously create the corresonding sigma error array which is used by the -index algorithm in determining the velocity spread of the line.
We find very little change in the -index as a function of S/N in the range S/N , variations are 2% for both the high and low -index absorbers that we test. Only at S/N 5 do we see a significant change in the -index, although the magnitude of the change, and its direction depend upon the structure of the absorber. Nonetheless, it is encouraging that the -index technique is applicable for spectra of relatively low quality.
5 Discussion and Conclusions
We have presented a new technique for discriminating between low and high (H I) absorbers based solely on high resolution spectroscopy of the Mg II 2796 line. Qualitatively, DLAs tend to be characterised by broad, heavily saturated Mg II, whereas sub-DLAs often have considerable residual flux over their extent. Quantitatively, we define the -index, the ratio of Mg II 2796 EW to velocity spread. DLAs tend to have high -indices, with a cut of yielding a success rate of 90%. Previously, identification of DLA candidates based on EW cuts from low resolution spectra had a DLA confirmation rate of only 35%. A larger sample of absorbers which is more representative of the column density distribution function (i.e. with a higher fraction of sub-DLAs than DLAs), may have a lower success rate depending on the performance of the -index at low (H I). This is difficult to judge from the current sample since only 8 of our absorbers have (H I) 20.3. Both of the sub-DLAs with high can be marked out as ‘unusual’ in some way; Q0058+019 is known to have a very small impact parameter to its parent galaxy and is rare in exhibiting solar metallicity (Pettini et al. 2000) and Q0957+561B is a lensed QSO. Whilst we do not suggest these factors as exemptions or explanations, it once again highlights the need for better sub-DLA statistics. In addition, all DLAs with (H I) 20.5 in our pilot sample have , so that pre-selection with the -index includes the systems which dominate the neutral gas content. Although the column density distribution function evolves as a function of redshift (e.g. Prochaska, Herbert-Fort & Wolfe 2005; Rao, Turnshek & Nestor 2006; Zwaan et al. 2005) it can be approximated to single power law . For an index , less than 10% of the HI gas is in systems with log (H I) 20.5. Therefore, although using the -index may miss some DLAs with lower column densities, for the purposes of pre-selecting DLAs to estimate the total neutral gas in DLAs, it is quite robust. Similarly, for any property that is weighted by (H I), such as is common practice with metallicity (e.g. Pettini et al. 1999; Kulkarni et al 2005), the DLAs missed by -index pre-selection will have a relatively minor effect.
In order for the -index to be a successful discriminant of DLAs from sub-DLAs, a spectral resolution of at least 1.5 Å FWHM (at the wavelength of Mg II 2796) is required. Based on simulations which degrade the spectral resolution of our archival data, we have tabulated the -index which yields the highest DLA return rate for a given instrumental FWHM.
The distinction between DLAs and sub-DLAs encapsulated by the -index is one of spectral morphology. The qualitative tendency for sub-DLAs to have more extended velocities for their EWs with a larger number of distinct components was previously noted by Churchill et al. (2000). Rao & Turnshek (2000) also discussed the difference in spectral morphology between high and low (H I) absorbers noting that ‘the DLA systems generally appear to exhibit somewhat greater saturation.’ The physical reason for this difference, which leads to the difference in -indices in the two populations, is still unclear, but we speculate that it may be driven by impact parameter (see also Rao & Turnshek 2000). In their study of a gravitationally lensed QSO, Ellison et al. (2004b) found that the coherence scale of weak (EW 0.3 Å) Mg II absorbers is 2 kpc ( = 0.7, = 0.3), whilst stronger absorbers have much larger sizes. Ellison et al. discussed a scenario in which galactic halos were composed of numerous Mg II absorbing ‘clouds’ whose filling factor was larger near the centres of galaxies. In this picture, a sightline intersecting at small impact parameters would show absorption from many Mg II regions, but within a relatively narrow velocity range. Conversely, sightlines at larger impact parameters would exhibit more disjointed absorption complexes and may have much wider velocity spreads (depending on the kinematics of the individual galaxy). This would lead to an anti-correlation between -index and impact parameter. We can test this prediction with the galaxy–Mg II absorber sample of Churchill et al. (2000) for which galaxies have been identified for 16 Mg II absorbers (albeit with EWs typically lower than those considered in this paper). Although Churchill et al. (2000) define velocity spread differently from us, the ratio with EW (the analog to our -index) does anti-correlate with impact parameter. If the HI column density also falls off with impact parameter, this would lead to a correlation between -index and (H I) and qualitatively explain the distribution of points in Figure 3.
We conclude that, based on these preliminary investigations, a combination of EW and velocity spread may be a powerful way to pre-select DLA candidates. Although more data are required to test the robustness and selection biases of this technique it could potentially increase the yield of pre-selected DLA candidates by a factor of 2–3 over current methods. With more data available, it will also be possible to extend the investigation of the -index to other transitions which may be suitable for DLA identification, such as Fe II transitions longwards of 2300 Å.
Acknowledgments
I am indebted to those people who generously shared segments of their reduced echelle spectra for the purposes of this study and my collaborators on previous projects for which these data were collected: Ramana Athreya, Chris Churchill, Mirka Dessauges-Zavadsky, Nissim Kanekar, Sebastian Lopez, Céline Péroux, Max Pettini, Jason X. Prochaska and Chuck Steidel.
References
- Churchill et al (2000) Churchill, C. W., Mellon, R. R., Charlton, J. C., Jannuzi, B. T., Kirhakos, S., Steidel, C. C., Schneider, D. P., 2000, ApJ, 543, 577
- Churchill et al (2003) Churchill, C. W., Mellon, R. R., Charlton, J. C., Vogt, S., 2003, ApJ, 593, 203
- Dessauges-Zavadsky et al (2004) Dessauges-Zavadsky, M., Calura, F., Prochaska, J. X., D’Odorico, S., Matteucci, F., 2004, A&A, 416, 79
- Dessauges-Zavadsky et al. (2003) Dessauges-Zavadsky, M., Péroux, C., Kim, T.-S., D’Odorico, S., McMahon, R. G., 2003, MNRAS, 345, 447
- Dessauges-Zavadsky et al (2006) Dessauges-Zavadsky, M., Prochaska, J. X., D’Odorico, S., Calura, F., Matteucci, F., 2006, A&A, accepted, astro-ph/0511031
- Ellison (2000) Ellison, S. L., 2000, PhD thesis, University of Cambridge.
- Ellison (2005) Ellison, S. L., 2005, Proceedings of IAUC199, Probing Galaxies through Quasar Absorption Lines, P. R. Williams, C. Shu, and B. Menard, eds, page 281
- Ellison et al. (2004a) Ellison, S. L., Churchill, C. W., Rix, S. A., Pettini, M., 2004a, ApJ, 615, 118
- Ellison et al. (2004b) Ellison, S. L., Ibata, R., Pettini, M., Lewis, G. F., Aracil, B., Petitjean, P., Srianand, R., 2004b, A&A, 414, 79
- Ellison, Ryan & Prochaska (2001) Ellison, S. L., Ryan, S. & Prochaska, J. X., 2001, MNRAS, 326, 628
- Ellison et al. (2001) Ellison, S. L., Yan, L., Hook, I., Pettini, M., Wall, J., Shaver, P., 2001, A&A, 379, 393
- Kulkarni et al. (2005) Kulkarni, V., Fall, S. M., Lauroesch, J. T., York, D. G., Welty, D. E., Khare, P., Truran, J., W., 2005, ApJ, 618, 68
- Ledoux, Bergeron & Petitjean (2002) Ledoux, C., Bergeron J., & Petitjean, P., 2002, A&A, 305, 802
- Lodders (2003) Lodders, K., 2003, ApJ, 591, 1220
- Lopez et al. (2005) Lopez, S., Reimers, D., Gregg, M. D., Wisotzki, L., Wucknitz, O., Guzman, A., 2005, ApJ, 626, 767
- Lopez et al (1999) Lopez, S., Reimers, D., Rauch, M., Sargent, W., Smette, A., 1999, ApJ, 513, 598
- Nestor et al. (2003) Nestor, D. B., Rao, S. M., Turnshek, D. A., Vanden Berk, D., 2003, ApJ, 595, L5
- Pettini et al. (1999) Pettini, M., Ellison, S. L., Steidel, C. C., Bowen, D. V. 1999, ApJ, 510, 576
- Pettini et al. (2000) Pettini, M., Ellison, S. L., Steidel, C. C., Shapley, A. E., & Bowen, D. V. 2000, ApJ, 532, 65
- Peroux et al. (2003) Péroux, C., Dessauges-Zavadsky, M., D’Odorico, S., Kim, T.-S., McMahon, R., 2003, MNRAS, 345, 480
- Peroux et al (2005) Peŕoux, C., Dessauges-Zavadsky, M., D’Odorico, S., Kim, T.-S., McMahon, R. G., 2005, 363, 479
- Prochaska, Herbert-Fort & Wolfe (2005) Prochaska, J. X., Herbert-Fort, S., & Wolfe, A. M., 2005, ApJ, 635, 123
- Rao and Turnshek (2000) Rao, S.M., & Turnshek, D.A. 2000, ApJS, 130, 1
- Rao, Turnshek & Nestor (2006) Rao, S.M., Turnshek, D.A., Nestor, D. B., 2006, ApJ, accepted astro-ph/0509469
- Rosenberg & Schneider (2003) Rosenberg, J., & Schneider, S., 2003, ApJ, 585, 256
- Ryan-Weber, Webster & Staveley-Smith (2003) Ryan-Weber, E. V., Webster, R. L., & Staveley-Smith, L., 2003, MNRAS, 343, 1195
- Zwaan et al. (2005) Zwaan, M. A., Meyer, M. J., Staveley-Smith, L., Webster, R. L., 2005, MNRAS, 359, 30