WEAK-LENSING DETECTION AT : MEASUREMENT OF THE TWO LYNX CLUSTERS WITH ADVANCED CAMERA FOR SURVEYS
Abstract
We present a Hubble Space Telescope Advanced Camera for Surveys (ACS) weak-lensing study of RX J0849+4452 and RX J0848+4453, the two most distant (at and , respectively) clusters yet measured with weak-lensing. The two clusters are separated by from each other and appear to form a supercluster in the Lynx field. Using our deep ACS and imaging, we detected weak-lensing signals around both clusters at levels. The mass distribution indicated by the reconstruction map is in good spatial agreement with the cluster galaxies. From the singular isothermal sphere (SIS) fitting, we determined that RX J0849+4452 and RX J0848+4453 have similar projected masses of and , respectively, within a 0.5 Mpc () aperture radius. In order to compare the weak-lensing measurements with the X-ray results calibrated by the most recent low-energy quantum efficiency determination and time-dependent gain correction, we also re-analyzed the archival data and obtained and keV for RX J0849+4452 and RX J0848+4453, respectively. Combined with the X-ray surface brightness profile measurement under the assumption of isothermal model, the temperature of RX J0849+4452 predicts that the projected mass of the cluster within Mpc is , consistent with the weak-lensing analysis. On the other hand, for RX J0848+4453 we find that the mass derived from this X-ray analysis is much smaller () than the weak-lensing measurement. One possibility for this observed discrepancy is that the intracluster medium (ICM) of RX J0848+4453 has not yet fully thermalized. Although this interpretation is rather simplistic, the relatively loose distribution of the cluster galaxies in part supports this possibility of low degree of virialization. We also discuss other scenarios that might give rise to the discrepancy.
1 INTRODUCTION
It has become clear that massive clusters are not extremely rare at high redshifts () and the presence of these large collapsed structures when the age of the Universe is less than half its present value is no longer in conflict with our current understanding of the structure formation, especially in a -dominated flat cosmology. Pursuit of galaxy clusters to higher and higher redshift is important in the extension of the evolutionary sequences to earlier epochs, when the effect of the different cosmological frameworks becomes more discriminating.
A great deal of observational efforts have been made in the last decade in enlarging the sample of high-redshift clusters. X-ray surveys have provided an efficient method of cluster identification and probe of cluster properties because a hot intracluster medium (ICM) within the cluster generates strong diffuse X-ray emission and is believed to be in quasi-equilibrium with gravity. However, it is questionable how well the clusters selected by their X-ray excess can provide the unbiased representation of the typical large scale structure at the cluster redshift. If the degree of the virialization decreases significantly with redshift and is strongly correlated with X-ray temperature, the cosmological dimming can bias our selection progressively towards higher and higher mass, relaxed structures.
Among other important approaches to detect high-redshift clusters is a red-cluster-sequence (RCS) survey using the distinctive spectral feature in cluster ellipticals. This so-called 4000Å break feature is well-captured by a careful combination of two passbands, and Gladders & Yee (2005) recently reported 67 candidate clusters at a photometric redshift of from the % subregion of the total RCS survey field. A related method but giving a higher contrast of cluster members with respect to the background sources is to use deep near-infrared (NIR) imaging (e.g., Stanford et al. 1997) for the selection of cluster candidates. High-redshift clusters identified in these color selection methods are expected to serve as less biased samples encompassing the lower mass regime at high redshifts.
In the current paper, we study two clusters, namely RX J0849+4452 and RX J0848+4453 (hereafter Lynx-E and Lynx-W for brevity), using the deep F775W and F850LP (hereafter and , respectively) images obtained with the Advanced Camera for Surveys (ACS) on the (). Interestingly, although these two clusters are separated by only from each other, they were discovered by different methods.
Standford et al. (1997) discovered Lynx-W in a NIR survey as an overdense region of the galaxies and spectroscopically confirmed 8 cluster members. They also analyzed the archival ROSAT-PSPC observation of the region and found diffuse X-ray emission near the confirmed cluster galaxies. However, they could not rule out the possibility that the X-ray flux might be coming from the foreground point sources because of the PSPC PSF is too broad to identify such objects. The subsequent study of the field using the observations showed that, although the previous ROSAT-PSPC observation is severely contaminated by the X-ray point sources adjacent to the cluster, the cluster is still responsible for some diffuse X-ray emission. Both the X-ray temperature and luminosity of the cluster appear to be low ( keV and ; Stanford et al. 2001).
Lynx-E was, on the other hand, first discovered in the ROSAT Deep Cluster Survey (RDCS) as a cluster candidate and follow-up near-infrared imaging showed an excess of red () galaxies around the peak of the X-ray emission (Rosati et al. 1999). They also showed that five galaxies around the X-ray centroid have redshifts that are consistent with the cluster redshift at using the Keck spectroscopic observations. From the data analysis, Stanford et al. (2001) determined the cluster temperature and luminosity to be keV and , respectively.
The rather large difference in the X-ray properties of these two clusters may be viewed as representing the characteristics of the sample obtained from different survey methods. Lynx-E, the X-ray selected cluster, has much higher X-ray temperature and luminosity than Lynx-W, the NIR-selected cluster. If the stronger X-ray emission means higher dynamical maturity, the more compact distribution of the Lynx-E galaxies provides an alternate support of this hypothesis. For dynamically relaxed systems the observed X-ray properties can be easily translated into the mass properties under the assumption of hydrostatic equilibrium. However, as we probe into the higher and higher-redshift regime, it is natural to expect that there will be more frequent occasions when the equilibrium assumption loses its validity in deriving the mass properties of the system. In addition, at we expect to have a growing list of low-mass clusters that are also X-ray dark because of the evasively low-temperature, as well as the substantial cosmological dimming. Therefore, it is plausible to suspect that these two clusters (especially Lynx-W, the poorer X-ray system) might lie on a border where the X-ray observations alone start to become insufficient to infer the mass properties.
Weak-lensing provides an alternative approach to deriving the mass of a gravitationally bound system without relying on assumptions about the dynamical state. This can help us to probe the properties of the high-redshift clusters in lower mass regimes, where the X-ray measurements alone may not provide useful physical quantities. In our particular case, weak-lensing is an important tool to test how the masses of the two Lynx clusters at compare with their X-ray measurements. Especially for Lynx-W, weak-lensing seems to be the unique route for probing the cluster mass, considering the poor and amorphous X-ray emission. Another interesting question is whether the low X-ray temperature of Lynx-W arises simply from a low mass or from a yet poor thermalization of the ICM.
However, the detection of weak-lensing signal at is difficult and much more so if the lens is not very massive. In our previous investigation of the two high-redshift clusters (Jee et al. 2005a, hereafter Paper I; Jee et al. 2005b, hereafter Paper II), we were able to detect clear lensing signals. They revealed the complicated dark matter substructure of the clusters in great detail. The effective source plane (defined by the effective mean redshift of the background galaxies) in Paper I and II is at , corresponding to the redshift of the lenses targeted in the current paper! Therefore, the number density of background galaxies decreases substantially compared to our studies and, in addition, the higher fraction of non-background population in our source sample inevitably dilutes the resulting lensing signal quite severely. Furthermore, the accurate removal of instrumental artifacts becomes more critical as stronger signals come from more distant, and thus fainter and smaller galaxies. They are more severely affected by the point-spread-function (PSF). Nevertheless, our analyses of RDCS 1252-2927 at (Lombardi et al. 2005; Jee et al. in preparation) demonstrate that weak-lensing can still be applied to clusters even at these redshifts and reveals the cluster mass distribution with high significance.
Returning to the X-ray properties, the low-energy quantum efficiency (QE) degradation of the instrument can cause noticeable biases in cluster temperature measurements. Although there have been many suggestions regarding this issue, it was not until recently that a convergent prescription to remedy the situation has become available from the X-ray Center111see http://cxc.harvard.edu/ciao3.0/threads/apply_acisabs/ or http://cxc.harvard.edu/ciao3.2/releasenotes/. Because we suspect that the previous X-ray analyses of the Lynx clusters suffered from the relatively insufficient understanding of this problem, we have also re-analyzed the archival data to enable a fairer comparison between the weak-lensing and X-ray measurements.
Throughout the paper, we assume a CDM cosmology favored by the Wilkinson Microwave Anisotropy Probe (WMAP), where , , and are 0.27, 0.73, and 71 , respectively. All the quoted uncertainties are at the 1 (%) level.
2 OBSERVATIONS
2.1 ACS Observation
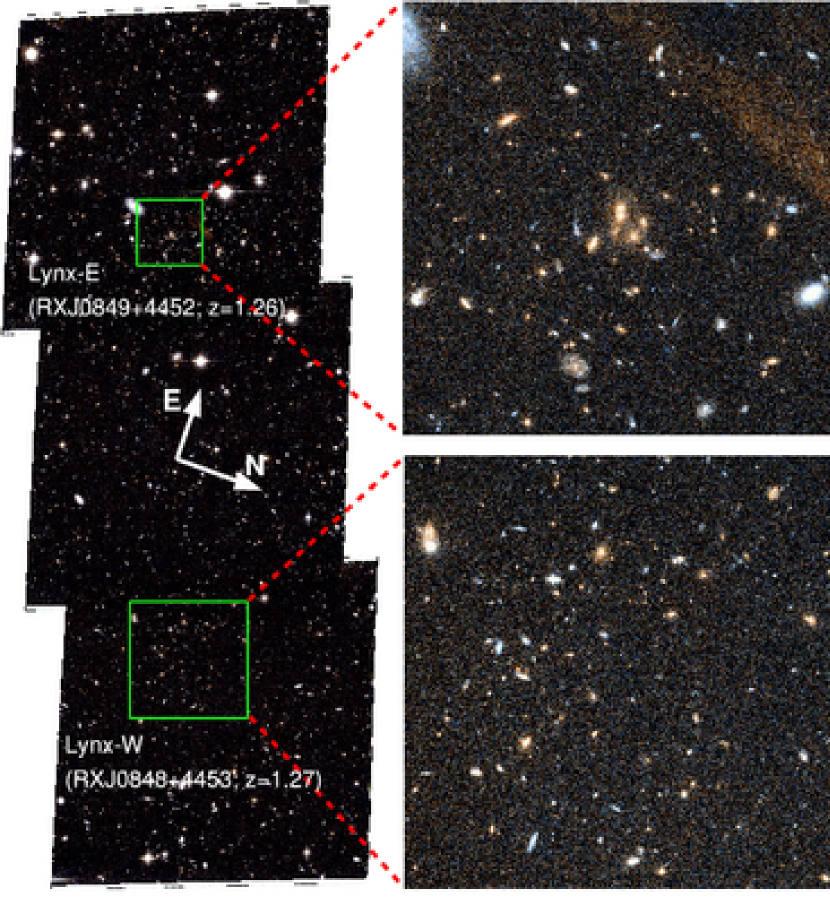
Deep ACS/WFC imaging of the Lynx clusters were carried out as part of ACS Guaranteed Time Observation (GTO) during 2004 March in three contiguous pointings, which cover a strip of region. A slight overlap () was made between the pointings and the strip is oriented in such a way that the two cluster centers are approximately located near the overlap region. Each pointing was observed in and passbands with 3 and 5 orbits of integration, respectively.
We used the ACS GTO pipeline (“APSIS”; Blakeslee et al. 2003) to remove cosmic rays, correct geometric distortion via drizzle algorithm (Fruchter and Hook 2002), and register different exposures. Apsis meets all the requirements of weak lensing analysis (Paper I and II), offering a precise ( pixels) image registration via the “match” program (Richmond 2002) after correcting for geometric distortion (Meurer et al. 2003).
In Figure 1 we present the pseudo-color image of the entire ACS field with the blow-ups of the two Lynx clusters. Lynx-E is well-portrayed by the somewhat compact distribution of the cluster red sequence around the brightest cluster galaxies (BCGs). It appears that the cluster has a strongly lensed blue giant arc south of the BCGs. The spectroscopic redshift of this arc candidate has not yet been determined. The red sequence of Lynx-W looks somewhat scattered and there seem to be no distinct BCGs characterizing the cluster center though the excess of the early-type galaxies in the region clearly defines the cluster locus.
The detection image was created by combining the two passband images using inverse variance weighting. Objects are detected through the SExtractor program (Bertin & Arnouts 1996) by searching for at least five connected pixels above 1.5 times the sky rms. The field contains several bright stars whose diffraction spikes not only induce a false detection, but also contaminate the neighboring objects. We manually selected and removed these objects. The catalog contains a total of 8737 galaxies.
2.2 Chandra Observation
We retrieved the observation of the Lynx field from the Chandra X-ray Center. The field was observed with the Advanced CCD Imaging Spectrometer I-array (ACIS-I) in the faint mode at a focal temperature of -120 K. The observation consists of two exposures: ks and ks integrations on 2000 May 3 and 4, respectively. The raw X-ray events were processed with the Interactive Analysis of Observations (CIAO) software version 3.2 and the Calibration Database (CALDB) version 3.1, which provide the correction for time-dependent gain variation and the low-energy quantum efficiency degradation without requiring any external guidance. We identified and flagged hot pixels and afterglow events using the , and scripts while selecting only the standard events (0,2,3,4, and 6).
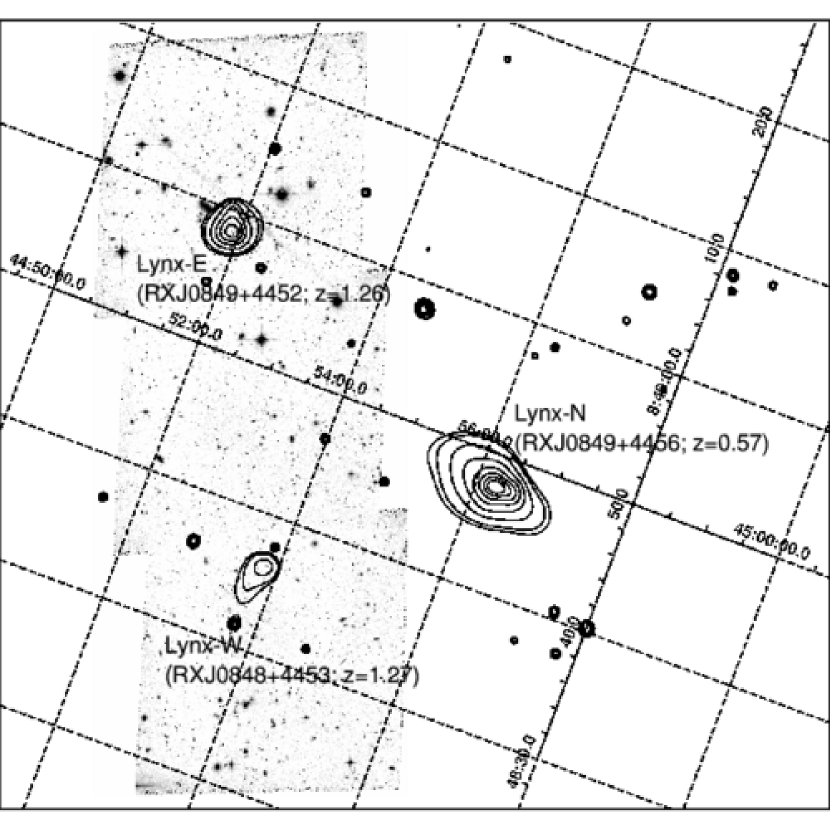
Figure 2 shows the adaptively smoothed X-ray contours of the Lynx field overlaid on the ACS image. This adaptive smoothing is performed using the CIAO CSMOOTH program with a minimum significance of 3 and the contours are spaced in square-root scale. Because of the low counts from the two high-redshift clusters, the 3 significance condition can only be met with rather large smoothing kernels. Therefore, the round appearance of the contours should not be misinterpreted as indicating the relaxed status of the systems. When the contours are reproduced with a smaller, constant kernel smoothing, Lynx-W looks much more irregular than Lynx-E. The X-ray centroids of Lynx-E and W are in good spatial agreement with those of cluster optical lights. The foreground cluster RXJ 0849+4456 (Holden et al. 2001) at z=0.57 appears to be also strong in X-ray emission, but is located outside the ACS pointings ( and apart from Lynx-E and W, respectively). The multi-wavelength analysis of this cluster is presented by Holden et al. (2001) and they found that the cluster can be further resolved into two groups at z=0.57 and 0.54. Our subsequent X-ray analyses are confined to the two high-redshift clusters at present within the current ACS pointings.
3 ACS DATA ANALYSIS
As in our previous investigations (Paper I and II), we measure galaxy shapes and model the point-spread-function of the observation using shapelets (Bernstein & Jarvis 2002; Refregier 2003). Readers are referred to Paper I and II for detailed description of the ellipticity measurements.
3.1 Cluster Luminosity
Our current spectroscopic catalog of the ACS Lynx field (B. Holden et al. in preparation) contains 150 objects and 32 of them belong to either of the two high-redshift clusters ();12 galaxies are at and the rest of them (106 objects) are foreground objects.
We supplemented the cluster member galaxy catalog with the cluster red sequence (Mei et al. 2005) using colors. In order to minimize the systematics from internal gradients and the different PSF sizes (the PSF of is % broader than that of ), the galaxies are deconvolved with the CLEAN (Högbom et al. 1974) algorithm. After an effective radius is determined for each galaxy, we measured the object colors within a circular aperture defined by . When the estimated was less than three pixels, we used a three pixel aperture instead (the median is pixels).
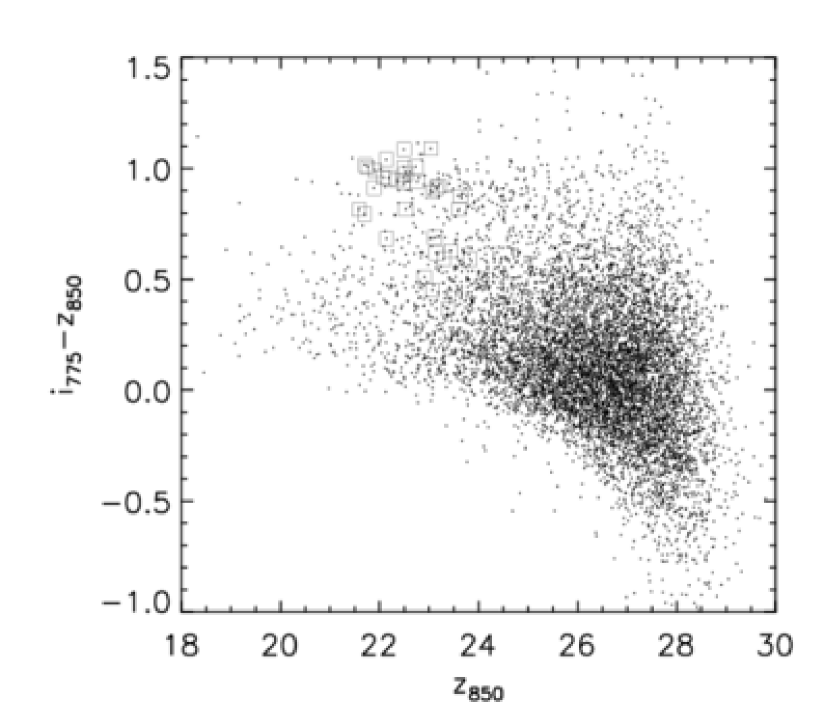
At , the 4000Å break is shifted slightly blue-ward of the effective wavelength of the filter. Therefore, this filter combination is less than ideal, but the red sequence is still visible down to in the versus plot (Figure 3). We visually examined each candidate and discarded the objects that do not seem to have early-type morphology, or whose redshifts (if known) are inconsistent with the cluster redshifts. The final cluster member catalog contains 68 objects.
The rest-frame band at the cluster redshift is approximately redshifted to the ACS band and we derive the following photometric transformation from the synthetic photometry with the Spectral Energy Distribution (SED) templates of Kinney et al. (1996).
| (1) |
where DM is the distance modulus of 44.75 at .
From the above selection of the cluster galaxies, we estimate that Lynx-E and W encloses and , respectively within 0.5 Mpc () radius. Of course, these values correspond to the lower limits because we neglected the contribution from the blue galaxies (except for the several spectroscopically confirmed ones), as well as the less luminous population (). However, we do not attempt to determine the correction factors in the current paper because the number of galaxies in both of our spectroscopic and red sequence samples is insufficient to support our statistical derivation.
3.2 PSF Correction
ACS/WFC has a time- and position-dependent PSF (Paper I) and the ability to properly model the PSF pattern in the observed cluster field is critical in subsequent galaxy ellipticity analysis. In paper I and II, we demonstrated that the PSF of WFC sampled from the 47 Tucanae field can be used to describe the PSF pattern of the cluster images where only a limited number of stars are available, but can be used as a diagnosis of the model accuracy.
We selected the stars in the Lynx field via a typical magnitude versus half-light radius plot (Figure 4). Figure 5a show the WFC PSF pattern in the image of the Lynx field, which is similar to the ones in our previous cluster weak lensing studies. The PSFs are elongated in the lower-left to upper-right direction. An analogous pattern is also observed in the band. However, the wings of the are stretched approximately parallel to the row of the CCD (telescope V2 axis) and the feature becomes observable when the wings of the PSFs are more heavily weighed (Heymans et al. 2005).
In our calibration of the ACS (Sirianni et al. 2005), we also observed an opposite pattern (i.e., with an ellipticity nearly perpendicular to Figure 5a), it seems that this PSF pattern is more frequently observed, at least in our GTO surveys of clusters. Because the focus offsets of different HST visits are likely to vary, one may desire to find the closest PSF template for every individual exposure and perform PSF corrections one by one. However, we find that in our GTO cluster observations the PSF patterns in different exposures do not vary considerably. Therefore, we chose a single PSF template for each filter and created a PSF map for the entire mosaic image by placing the template PSFs on each pointing. In order to minimize the model-data discrepancy due to the slight focus variation, we fine-tuned our model for each exposure by shearing the PSF by an amount , which can be expressed in shapelet notation as
| (2) |
where is the shapelet componet of the PSF and the evaluation of matrix elements of the shear operator can be found in Bernstein & Jarvis (2002).
Figure 5b displays the residual ellipticities of the same stars in the when the PSF is circularized with rounding kernels (Fischer & Tyson 1997; Kaiser 2000; Bernstein & Jarvis 2002). The dramatic reduction of the PSF anisotropy is also distinct when the ellipticity components ( and ) before and after the corrections are compared (Figure 6).
This rounding kernel test verifies that our PSF models describe the PSF pattern of the cluster observation very precisely. Although one can continue with this rounding kernel method and make a subsequent measurement of the galaxy shape in this “rounded” images (e.g., Fischer & Tyson 1997), we prefer to remove the PSF effect through straightforward deconvolution in because the latter gives more satisfactory results for very faint galaxies (Paper I; Hirata & Seljak 2003). Besides, the PSF is rather complicated because of the ellipticity variation between core and wing metioned above, and this PSF effect can be more efficiently corrected by the deconvolution.
3.3 Mass Reconstruction
In order to maximize the weak-lensing signal, it is important to select the source population in such a way that the source sample contains the minimal contamination from cluster and foreground galaxies. Because only two passband images of the Lynx field are available, direct determination of reliable photometric redshift for an individual galaxy is impossible. Therefore, we chose to select the background galaxies based on their () colors and magnitudes. The redshift distribution of this sample can be indirectly inferred when we apply the same selection criteria to other deep multi-band HST observations such as the Ultra Deep Field (UDF; Beckwidth et al. 2003) project, for which reliable photometric redshift information is obtainable down to the limiting magnitude of our cluster observation (D. Coe et al., in preparation).
We selected the galaxies whose colors are bluer than those of the cluster redsequence ( as “optimal” background population by examining the resulting tangential shears around the two clusters. This selection yields a total of 6742 galaxies (). Assuming that the cosmic variance between the Lynx and UDF is not large, we estimate that approximately 60 per cent of the selection is behind the Lynx clusters.
Our final ellipticity catalog was created by combining the and bandpass ellipticities. Of course, there is a subtlety in this procedure because an object can have intrinsically different shapes and thus ellipticities in different passbands. We adopted the methodology presented by Bernstein and Jarvis (2002) to optimally combine the galaxy ellipticities. In our previous weak-lensing analyses (Paper I and II), we found that this scheme indeed reduced the mass reconstruction scatters compared to the case when only single passband images were used; the improvement increases as fainter galaxies are included. As a consistency check, we compared the shapes and lensing signals from the two passband images, and confirmed that the results are statistically consistent.
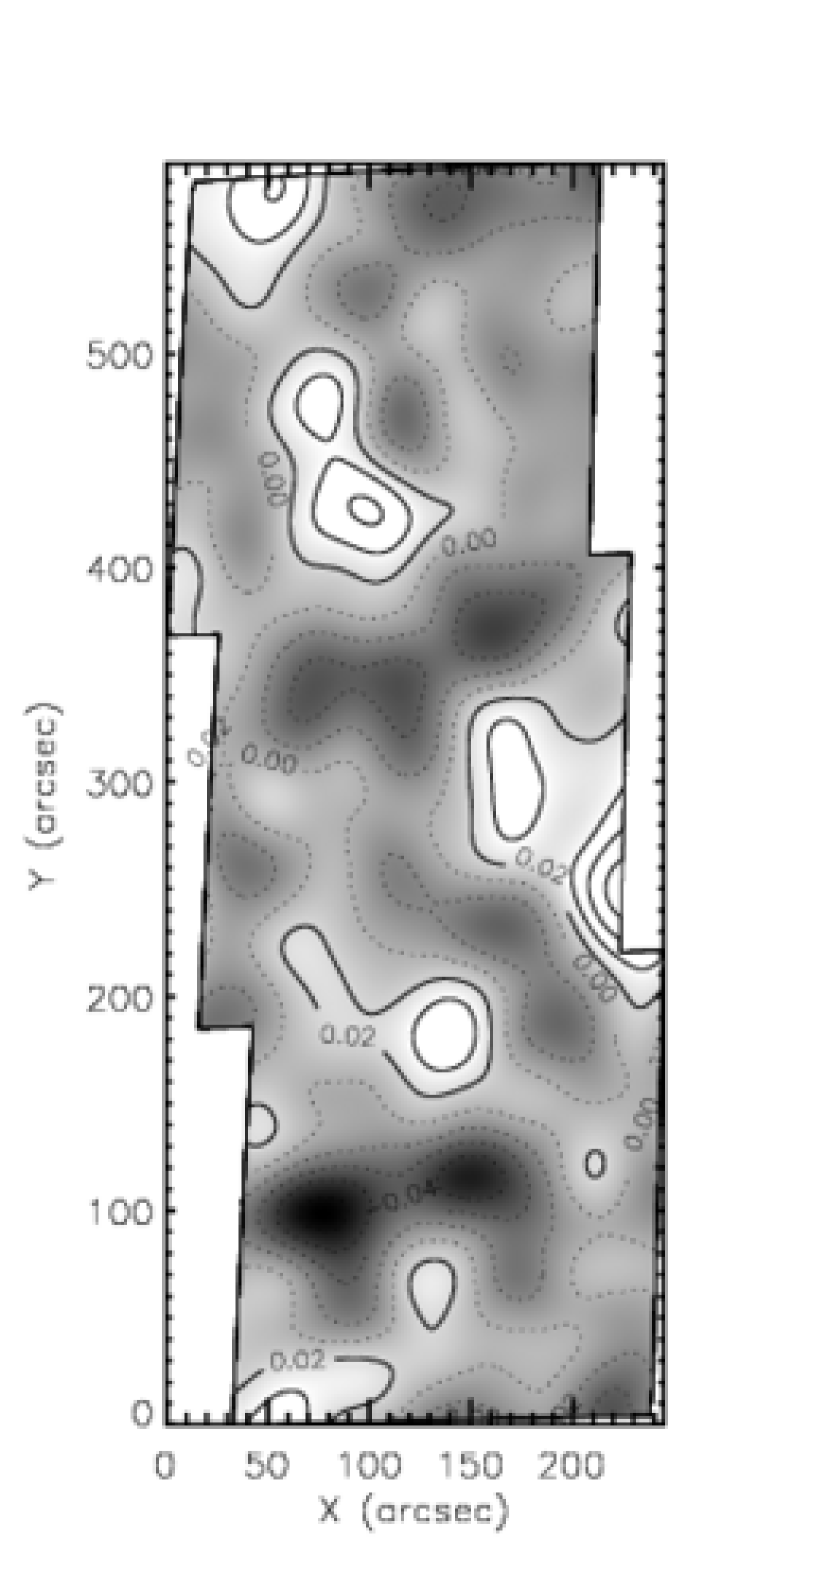
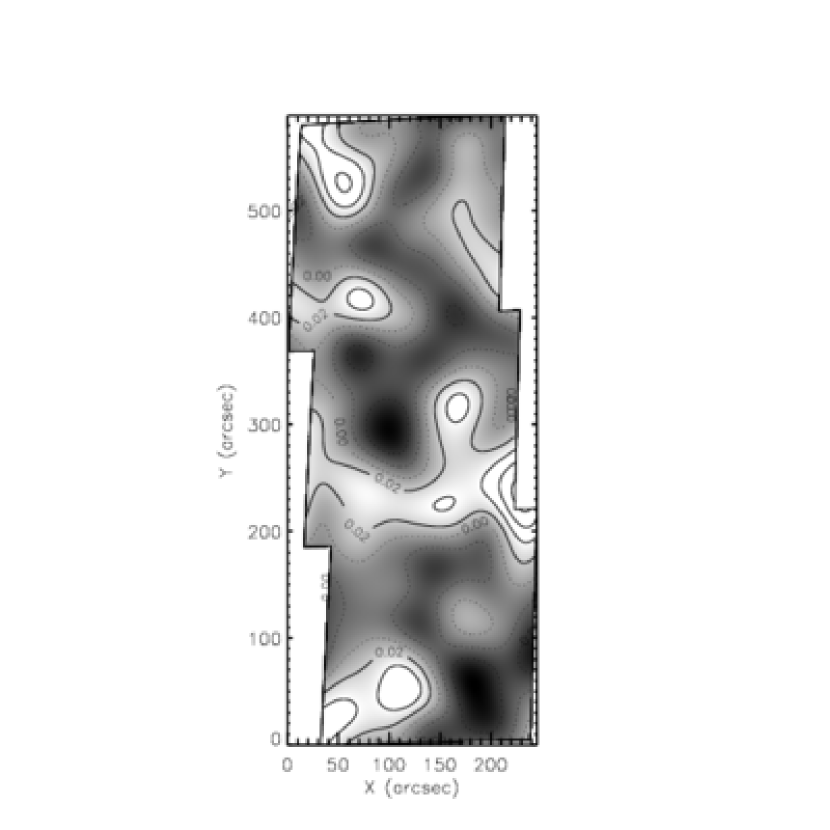
We show the distortion and mass reconstruction of the Lynx field from this combined shape catalog in Figure 7. Although the systematic alignments of source galaxies around the cluster centers are subtle in the whisker plot (left panel), the resulting mass reconstruction (right panel) clearly shows the dark matter concentration associated with the cluster galaxies. The mass map is generated using the maximum likelihood algorithm and is smoothed with a FWHM Gaussian kernel. We verify that other methods (e.g., Seitz & Schneider 1995; Lombardi & Bertin 1999) also produce virtually identical results.
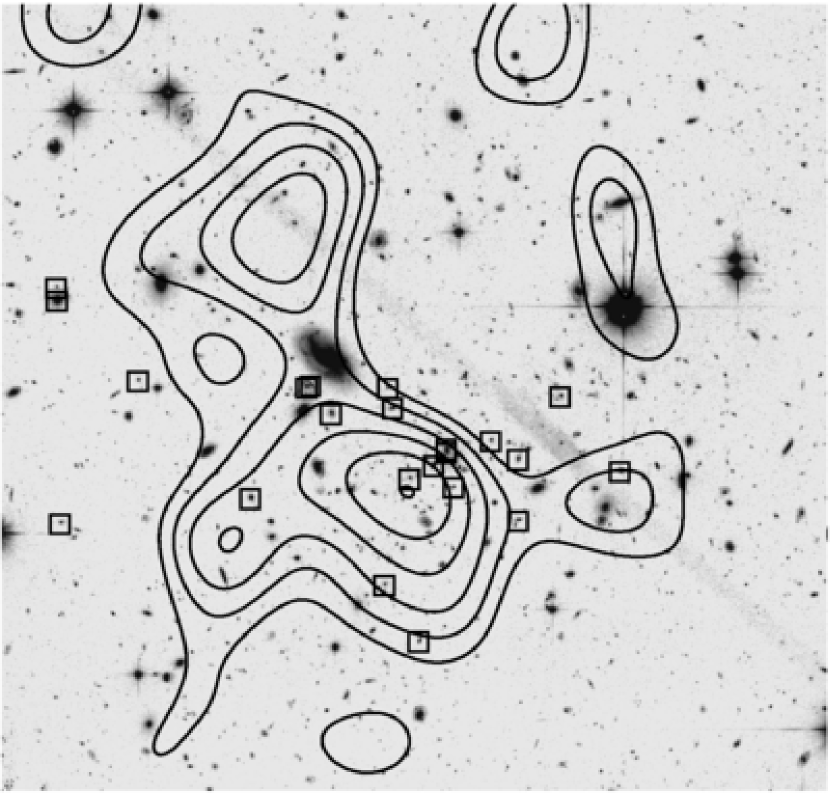
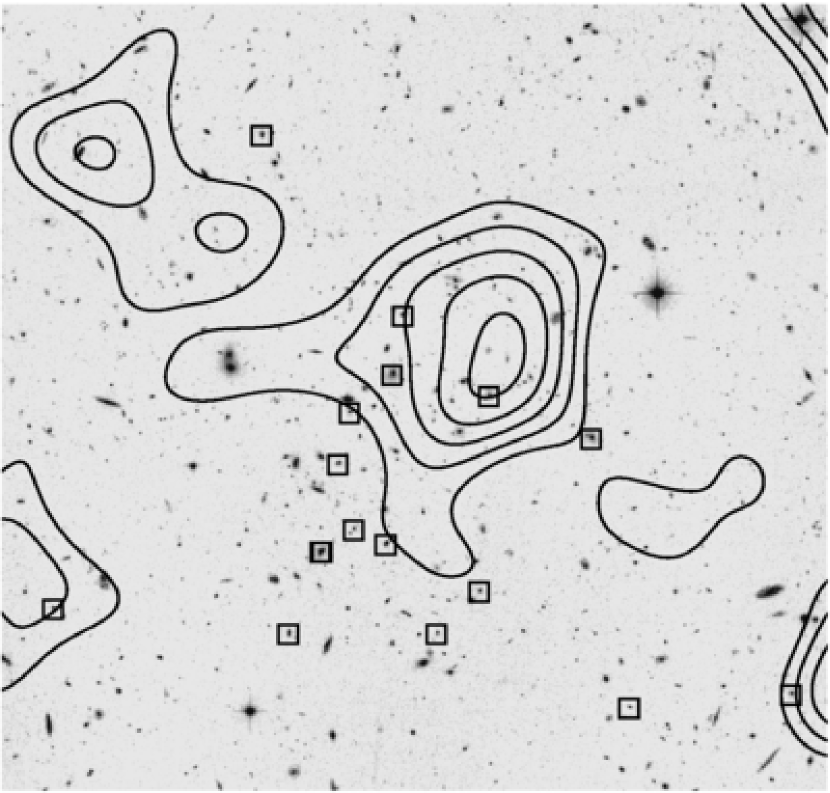
The two mass clumps are in good spatial agreement with both the cluster light and X-ray emission. Within a radius of , both clumps are found to be significant, above the level (determined from bootstrap resampling). Figure 8 shows the high-resolution (smoothed with a FWHM kernel) version of the mass maps overlaid on the ACS images. The clump associated with Lynx-E is offset from the BCGs and the Lynx-W clump seems to lie on the western edge of the cluster galaxy distribution. In Paper I and II, we have reported significant mass-galaxy offsets for two clusters at and discussed the possibility that those offsets may signal the merging substructures. Although it is tempting to interpret the mass-galaxy offsets in the current study as also implying the similar merging of the two Lynx clusters, our investigation of the mass centroid distribution using the bootstrap resampling shows that the significance is only marginal (i.e., the circle roughly encloses % of the centroid distribution).
It is encouraging to observe that the foreground cluster at affects the distortion of source galaxies and reveals itself in the weak lensing mass reconstruction (Figure 7) though most of its galaxies are outside our ACS field (see Figure 2 for the location of the X-ray emission from the foreground cluster). As shown by this foreground cluster and its manifestation in the mass map, light coming from background galaxies is perturbed by all the objects lying in their paths to the observer. Considering the high-redshifts () of the Lynx clusters, the likelihood of such interlopers is high. In addition, if the masses of the two high-redshift clusters are not very large, even a moderately massive foreground object can generate a similar lensing signal because it has higher lensing efficiency for a fixed source plane (unless the source plane is located at substantially higher than ).
In an attempt to separate this lower-redshift contribution from our weak lensing mass map presented in Figure 7b, we created an alternate source sample by selecting the brighter () galaxies. This time we did not exclude the galaxies whose colors correspond to that of the cluster red-sequence because they also serve as well-defined source plane at and their shapes should be perturbed by any lower-redshift mass clumps. We present this second version of the mass reconstruction in Figure 9. It is remarkable to observe that in this version the two high-redshift clusters disappear whereas many of the assumed foreground features (including the cluster at ) still remain.
The comparison of this second mass reconstruction with the previous result also indicates that some of the foreground mass clumps might affect the shape of the contours of the high-redshift clusters at large radii; the mass clump of Lynx-E seems to have a neighboring foreground clump at its southwestern edge, and the southern edge of the Lynx-W clump also slightly touches the foreground structure (Figure 8) (However, far fewer galaxies were used for this second version of mass reconstruction and thus the position of these structures have much less significance). This apparent substructure in projection may bias our measurements of the total mass. We discuss this issue in §3.5.
3.4 Redshift Distribution of Source Galaxies
As detailed in Paper I, the redshift distribution of the source galaxies of the Lynx field was inferred from the photometric redshift catalog of the UDF. We also used the two photometric catalogs created from the Great Observatories Origins Deep Survey (GOODS; Giavalisco et al. 2004) and the degraded UDF in order to estimate the contamination of the cluster members in the source sample for and , respectively.
Figure 10 shows the magnitude distribution of the source galaxies (top panel) with the estimated mean redshift (bottom panel) for each magnitude bin. It appears that the number density excess due to the cluster galaxy contamination is not significant throughout the entire magnitude range. However, we must remember that the sample contains substantial contamination of foreground galaxies, which dilute the lensing signal. We measure the mean redshift in terms of the following:
| (3) |
where , , and are the angular diameter distance from the observer to the source, from the observer to the lens and from the lens to the source, respectively.
We obtain for the entire source galaxies. The value corresponds to a single source plane at and the critical surface mass density () has the physical unit of at the redshift of the lens .
3.5 Weak-lensing Mass Estimation
A first guess of the mass can be obtained by fitting the SIS model to the observed tangential shears around the clusters. We chose the origin of the tangential shears as the centroids of the mass clumps in Figure 7. The neighboring foreground structures at as well as the proximity of the field boundary restrict us to the use of the tangential shears at radii no greater than . In addition, we discarded the measurements at in order to minimize the possible substructure artifact and the contamination of the lensing signal from the cluster members. Although this precaution leaves us with only a small fraction of the total measurements, the lensing signal is clearly detected for both clusters at the level in the tangential shear plots (Figure 11). It is plausible that the severly decreased shears at for Lynx-E might be in part caused by the aforementioned contamination from the cluster members. We verified that the lensing signal disappeared when the background galaxies were rotated by 45 (null test). Note that the uncertainties in Figure 11 reflect only the statistical errors set by the finite number of background galaxies. In Paper II, we demonstrated that the large scale structures lying in front of and behind the high-redshift cluster MS 1054-0321 () were dominant source of errors in the mass determination, responsible for approximately 15% of the total cluster mass. This fractional uncertainty increases substantially with cluster redshifts because the lensing by the foreground cosmic structures become more efficient than the lensing by clusters whose redshifts approach those of source galaxies. However, for the current clusters, we expect that the large statistical errors still overwhelm the cosmic shear effects. When we repeat the analysis of Paper II for the current clusters, we estimate that the uncertainties of the Einstein Radius for the SIS fit marginally increases from and to and for Lynx-E and W, respectively.
The Einstein radius of (with respect to the effective source plane at ) for Lynx-E corresponds to a mass of and a velocity dispersion of . Similar values of and are obtained for Lynx-W as implied by its comparable Einstein Radius .
As mentioned in §2.1, we note that there is a strongly lensed arc candidate at for Lynx-E, which can provide a useful consistency check. In general, Einstein radii depend on source redshifts, and the relation steepens if a lens is at a high redshift. If the Einstein radius of the arc is assumed to be , this implies that the redshift of the object should lie at in our adopted cosmology (the uncertainty reflects only the errors of the Einstein radius from the SIS fit result). Because we have only and band images, the photometric redshift estimation of this arc candidate is unstable. Nevertheless, if we use the HDFN prior and truncate it below , the color () of the object is consistent with the SED of the starburst galaxy at .
Alternatively, we can also estimate the cluster mass based on the two parameter-free methods, namely the aperture mass densitometry and the rescaled mass reconstruction. Although these two parameter-free approaches need some feedbacks from the above SIS fitting result to lift the mass-sheet degeneracy, in general they provide more robust methodology. They are less affected by the cluster substructure or the deviation from the assumed radial profile. However, one drawback of this approach is that the measurement is more severely influenced by the cosmic shear effect than in the case of the SIS fitting because the aperture mass densitometry uses less amount of information (i.e., decreased tangential shears in outer range). With the region as a control annulus for both clusters, we computed the cluster mass profiles from these two parameter-free methods (Figure 12); from the SIS fit results, we determine the mean mass density in the annulus to be and for Lynx-E and W, respectively. As observed in Paper I and II, the mass estimation obtained from the rescaled mass reconstruction (dotted) is in good agreement with the aperture mass densitometry (open circle). We also note that both methods gives masses consistent with the SIS fit results.
Because we used the SIS fit results above to lift the mass-sheet degeneracy, it is useful to examine how the result change when an NFW profile is assumed, instead. Unfortunately, the low lensing signal in the limited range does not allow us to constrain the two free parameters of the NFW profile simultaneously; the two parameters trade off with each other without significantly altering the quality of the fit. Freezing the concentration parameter to , nevertheless, yields () kpc for Lynx-E (W), predicting the mean mass density of () in the control annulus. Different choices for the concentration parameter do not change these results substantially (for instance, the choice of gives for Lynx-E).
In §3.3 we demonstrated that both clusters might have neighboring foreground mass clumps in projection. Therefore, it is worthwhile to assess how much these foreground structures affect our mass estimation. Because the redshift information of the foreground masses are not available, we cannot subtract their contribution directly from our mass map. Instead, we attempted to minimize their effects by replacing the mass density of the region that is occupied by the foreground mass clumps with the azimuthal average from the rest. Of course, we do not expect that this scheme yields cluster masses that are completely free from foreground contamination, since the azimuthal averages taken at other regions might be biased. However, this method is still an important test because a significant difference in resulting mass estimation must be detected if the foreground contamination is indeed severe.
The mass-sheet lifted mass map is convenient for this type of analysis. We replaced the southwestern region (; the angle is measured from the north axis counterclockwise) of the Lynx-E clump and the southern region () of the Lynx-W clump with the azimuthal averages taken at different angles. The solid lines in Figure 12 represent the mass profiles obtained from this measurement. For both clusters, this new measurements give slightly lower values, but the change is only marginal. We estimate that both Lynx-E and W have a similar mass of within 0.5 Mpc () aperture radius from this approach. The uncertainties here are estimated from 5000 bootstrap resampling of the source galaxies and we do not include the cosmic shear effects because it is non-trivial to estimate the effect for this rescaled mass map approach.
We adopt the conventional definition of the virial radius, where the enclosed mean density within the sphere becomes 200 times the critical density at the redshift of the cluster. Although the factor 200 above is most meaningful in the mass-dominated flat universe, we retain this definition so as to enable a consistent comparison with the values of other clusters found in the literature. The assumption of the spherical symmetry (SIS) allows us to estimate Mpc and for both Lynx clusters. These virial properties are much smaller than the clusters at studied in Paper I and II. We reported that CL 0152-1357 has a virial radius of Mpc and a virial mass of in Paper I. For MS 1054-0321, Paper II quoted Mpc and . If we assume that the two Lynx clusters are approaching each other perpendicular to the line of sight at a free-fall speed, our order-of-magnitude estimation predicts that the two Lynx cluster will merge into a single cluster whose virial mass exceeds in a time scale of Gyrs (or at ).
4 X-RAY ANALYSIS
4.1 Cluster Temperature and Luminosity
The X-ray spectra of Lynx-E and Lynx-W were extracted from the circular regions () positioned at their approximate X-ray centroids after the point sources (Stern et al. 2002) are removed. The redistribution matrix file (RMF) and the area response file (ARF) were created using the CIAO tool version 3.2 with the calibration database (CALDB) version 3.1, which properly accounts for the time-dependent low-energy QE degradation, as well as charge transfer inefficiency (CTI). The photon statistics is somewhat poor mainly because the clusters are at a high-redshift () and thus the differential surface brightness dimming is severe . Especially, as implied by its low temperature ( keV), the Poissonian scatter of the Lynx-W is worse. Therefore, we constructed the spectra for both clusters with a minimum count of 40 per spectral bin. We think that this choice makes the spectral fitting stable without diluting the overall shape of photon distribution too much. Because it is impossible to constrain the iron abundance given the statistics, we fixed the metallicity at 0.36 . This assumes that both Lynx clusters possess similar metallicity to RDCS 1252.9-2927 at (Rosati et al. 2004). However, as noted by Stanford et al. (2001), we observed only minor changes even when different values were tried. The Galactic hydrogen column density was also fixed at (Dickey & Lockman 1990). We used the minimization modified by Gehrels (1986;CHI-GEHRELS), who extended the conventional statistics so that it can handle the deviation of the Poissonian from the Gaussian at the low-count limit.
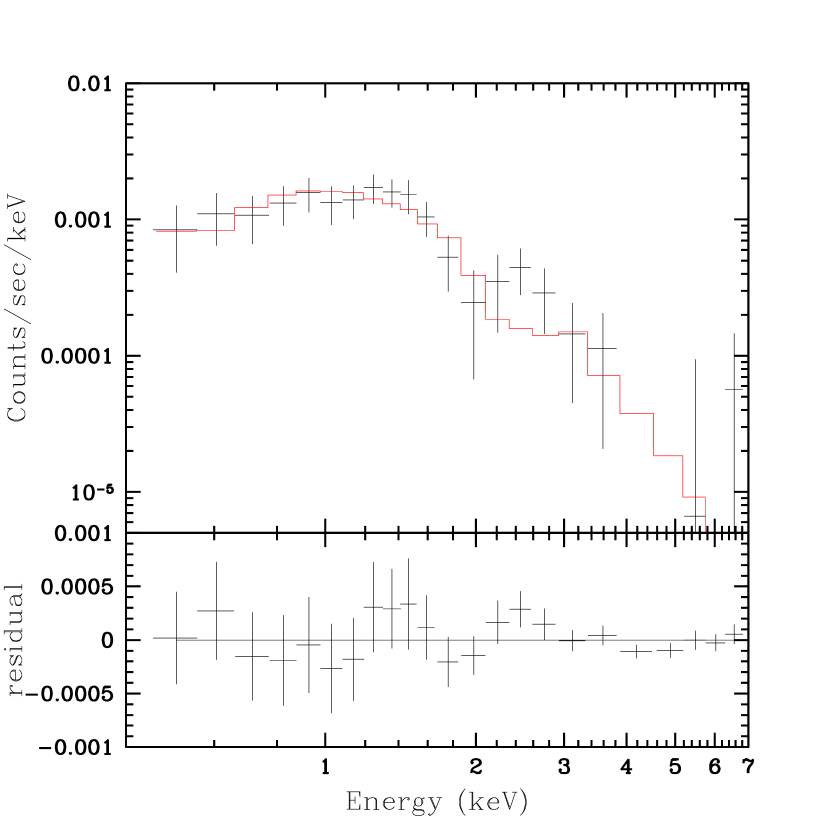
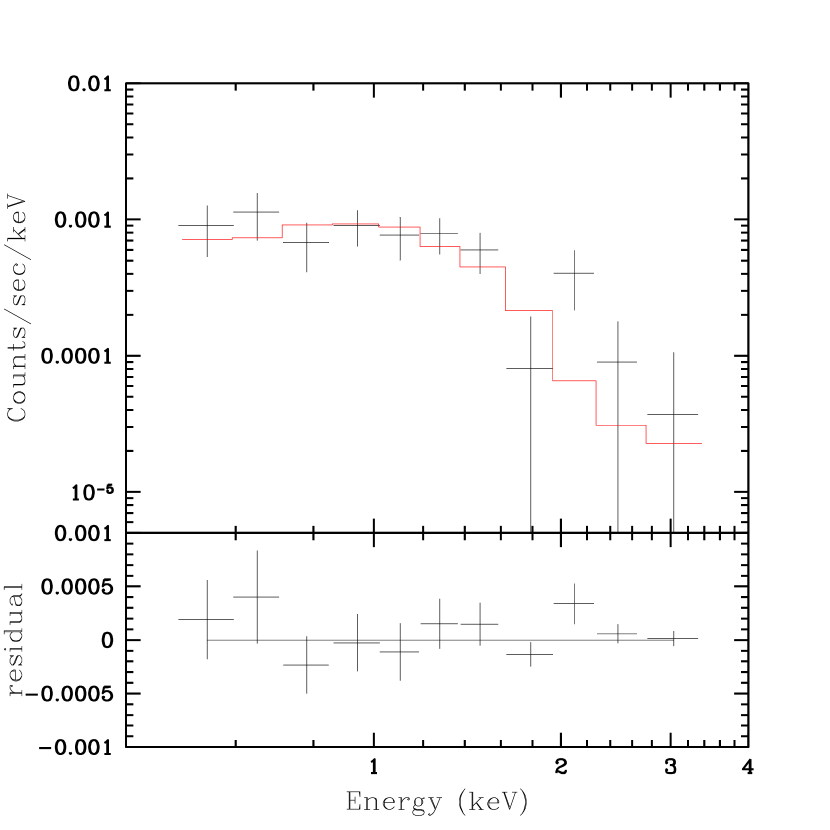
Figure 13 shows the best-fit MEKAL plasma spectra (Kaastra & Mewe 1993; Liedahl, Osterheld, & Goldstein 1995) for both clusters. We obtain keV for Lynx-E with a reduced of 0.79 (19 degrees of freedom). Lynx-W is determined to have keV with a reduced of 1.16 (7 degrees of freedom).
The observed fluxes are estimated to be and , which can be transformed into the rest-frame (also, apertured-corrected to Mpc) bolometric (0.01 - 40 keV) luminosity of and for Lynx-E and Lynx-W, respectively (note that the shallow surface brightness profile of Lynx-W requires a rather large aperture correction factor).
4.2 X-ray Surface Brightness Profile and Mass Determination
The azimuthally averaged radial profiles were created from the exposure-corrected image. In Figure 14 we display these radial profiles with the best-fit isothermal beta models for both clusters. As is indicated by their X-ray image and cluster galaxy distribution, Lynx-E has a higher concentration ( and ) of the ICM than Lynx-W ( and ).
Together with the cluster temperatures determined in §4.1, these structural parameters can be converted to the cluster mass under the assumption of hydrostatic equilibrium. In general, many authors report cluster masses within a spherical volume rather than a cylindrical volume spanning from the observer to the source plane, which however is the preferred and natural choice in weak-lensing measurements. This different geometry is often a source of confusion and subtlety in mass comparison between both approaches. Therefore, in this paper we present our X-ray mass estimates in a cylindrical volume in order to ensure more straightforward comparison with the weak-lensing result using the following equation (Paper II):
| (4) |
For Lynx-E we obtain , which is in good agreement with our weak-lensing measurement. On the other hand, the X-ray mass of Lynx-W () is much lower than the weak lensing estimation. We will discuss a few possible scenarios for this discrepancy in §6.
5 COMPARISON WITH OTHER STUDIES
The first attempt to estimate the mass of Lynx-W was made by Stanford et al. (1997) using the X-ray luminosity from the ROSAT-PSPC observation and the velocity dispersion obtained from the Keck spectroscopy of 8 galaxies. They converted the luminosity to assuming . A similar value of was estimated from the velocity dispersion of (note that they adopted and ). Although both masses are consistent with each other, their X-ray luminosity measurement seems to have suffered a severe contamination from the neighboring point sources, which are now identified in the observation.
In their presentation of the analysis, Stanford et al. (2001) did not attempt to estimate the mass of Lynx-W because of the large uncertainty of the temperature measurement, as well as the apparent asymmetry of the X-ray emission. Our predicted velocity dispersion of from the SIS fit result is consistent with their most recent determination of the velocity dispersion from the spectroscopic redshifts of the 9 member galaxies. Lynx-W was also selected as one of the 28 X-ray clusters for the study of the X-ray scaling relation at high redshifts by Ettori et al. (2004). From the re-analysis of the data, they obtained , kpc, and keV, which predicts a projected mass of (eqn. 4). This mass is consistent with our weak-lensing estimation (, but much higher than the value from our re-analysis of the same data (). In general, many detailed steps in the X-ray analysis such as the QE correction, background modeling, flare removal, spectral aperture, etc. affect the final result, and much more if the source is faint. Therefore, it is difficult, if not impossible, to trace the exact causes of the differences. Nevertheless, we note that there is an important difference in the calibration of the low-energy quantum efficiency correction between the results. Ettori et al. (2004) used the ACISABS correction method (Chartas and Getman 2002) to account for the low-energy QE degradation, which is however now officially disapproved by the . We also demonstrate in Paper II that the use of this ACISABS model causes a difference of keV in the temperature determination of MS1054-0321. We suspect that the effect should be more important in Lynx-W because of its low temperature and luminosity.
Stanford et al. (2001) obtained an X-ray temperature of keV for Lynx-E. Combined with their determination of and , this gives a projected mass of (eqn. 4), which is slightly higher than our X-ray re-analysis of the same data by % though the error bars from both results marginally overlap. Vihklinin et al. (2002) included Lynx-E in their sample of the 22 distant clusters to study the evolution the X-ray scaling relation. With the early understanding of the low-energy QE problem of the , they obtained keV, kpc, and . Using the ACISABS correction. Ettori et al. (2004) reported keV, kpc, and . The results from these two papers are statistically consistent with, but slightly higher than our values (keV, , and ), which predicts the lowest projected mass of . As already mentioned in the discussion of the Lynx-W temperature above, we suspect that the difference in temperatures mainly stems from the different correction methods of the low-energy QE degradation. Although our understanding of the instrument still evolves and this may neccesitate some updates to our results, it is encouraging to note that this X-ray mass is closest to our independent lensing determination of the cluster mass of from the SIS fit result. Our spectroscopic catalog currently provides the redshifts of 11 member galaxies within a radius (B. Holden in prep). Based on Tukey’s biweight estimator, we obtain a velocity dispersion of (without assuming a Gaussian distribution). This direct measurement agrees with the predicted velocity dispersion of from the lensing analysis (§3.5). In addition, the cluster temperature keV with is translated into (from ), in good agreement with both results.
6 DISCUSSION AND CONCLUSIONS
We have presented a weak-lensing analysis of the two Lynx clusters at using the deep ACS and images. Our mass reconstruction clearly detects the dark matter clumps associated with the two high-redshift clusters and other intervening objects within the ACS field, including the known foreground cluster at . In order to verify the significance of the cluster detection and to separate the high-redshift signal from the low-redshift contributions, we performed a weak-lensing tomography by selecting an alternate lower-redshift source plane. This second mass reconstruction does not show the mass clumps around the high-redshift clusters, while maintaining most of the other structures seen in the first mass map. This experiment strongly confirms that the weak-lensing signals observed in the first mass reconstruction are real and come from the high-redshift Lynx clusters.
Interestingly, both clusters are found to have similar weak-lensing masses of within 0.5 Mpc () aperture radius despite their discrepant X-ray properties. Our re-analysis of the Chandra archival data with the use of the latest calibration of the low-energy QE degradation shows that Lynx-E and W have temperatures of and keV, respectively. Combined with the X-ray surface brightness profile measurements, the X-ray temperature of Lynx-E gives a mass estimate in good agreement with the weak-lensing result. On the other hand, the X-ray mass of Lynx-W is much smaller than the weak-lensing estimation nearly by a factor of three. According to our experiment in §3.5, it is unlikely that any foreground contamination or cosmic shear effect in weak-lensing measurement causes this large discrepancy.
Apart from a simplistic, but valid possibility that Lynx-W might have a filamentary structure extended along the line of sight, yielding a substantial, projected mass but with yet only low-temperature thermal emission, we can also consider the self-similarity breaking (e.g., Ponman et al. 1999; Tozzi & Norman 2001; Rosati, Stefano, & Norman et al. 2002) typically observed for low-temperature X-ray systems. There have been quite a few suggestions that a non-gravitational heating (thus extra entropy) might prevent the ICM from further collapsing at the cluster core. The effect is supposed to be more pronounced in colder systems whose virial temperature is comparable to the temperature created by this non-gravitational heating, leading to shallower gas profiles than those of high-temperature systems (e.g., Balogh et al. 1999; Tozzi & Norman 2001). Interestingly, our determination of the surface brightness profile of Lynx-W is much shallower () than that of Lynx-E () (however, Ettori et al. (2004) obtained for Lynx-W).
The relatively loose distribution of the cluster galaxies in Lynx-W without any apparent BCG defining the cluster center leads us to consider another possibility that the system might be dynamically young and the ICM has not fully thermalized within the potential well. If we imagine that the ICM is not primordial, but has been ejected from the cluster galaxies at some recent epoch, it is plausible to expect that the X-ray temperature of the ICM might yet under-represent the depth of the cluster potential well. Tozzi et al. (2003) investigated the iron abundance in the ICM at and argued that the result was consistent with no evolution of the mean iron abundance out to . If we assume that, as they suggested, Type Ia SNe are the dominant sources of this iron enrichment and have already injected their metals into the ICM by , a significant fraction of clusters at may possess dynamically young ICM.
Recently, Nakata et al. (2005) reported with a photometric redshift technique the discovery of seven other cluster candidates around these two Lynx clusters possibly forming a supercluster. Although further evidence is needed that the individual clumps are dynamically bound, the clear enhancement of the red galaxies consistent with the color at the redshift of the two known Lynx clusters is worthy of our attention. If they are indeed found to be forming groups/clusters at , but missed by X-ray observations because of their low X-ray contrast, the detailed studies of these young high-redshift structures will provide a critical benchmark in testing our understanding of the structure formation as well as the individual galaxy evolution in the context of different environments.
Deep two band ( and /ACS imaging of the five out of the seven group/cluster candidates of Nakata el al. (2005) are scheduled in Cycle 14 (Prop. 10574, PI. Mei). Studies similar to the current investigation will not only test whether there exist dark matter clumps around the candidate galaxies, but also quantify the environments for the investigation of the cluster galaxy color/morphology evolution.
ACS was developed under NASA contract NAS5-32865, and this research was supported by NASA grant NAG5-7697. We are grateful for an equipment grant from Sun Microsystems, Inc.
Some of the data presented herein were obtained at the W.M. Keck Observatory, which is operated as a scientific partnership among the California Institute of Technology, the University of California and the National Aeronautics and Space Administration. The Observatory was made possible by the generous financial support of the W.M. Keck Foundation. The authors wish to recognize and acknowledge the very significant cultural role and reverence that the summit of Mauna Kea has always had within the indigenous Hawaiian community. We are most fortunate to have the opportunity to conduct observations from this mountain.
References
- Balogh et al. (1999) Balogh, M. L., Babul, A., & Patton, D. R. 1999, MNRAS, 307, 463
- Beckwith, Somerville, & Stiavelli (2003) Beckwidth, S., Somerville, R., Stiavelli M., 2003, STScI Newsletter vol 20 issue 04
- Bertin & Arnouts (1996) Bertin, E. & Arnouts, S. 1996, A&AS, 117, 393
- Bernstein & Jarvis (2002) Bernstein, G. M. & Jarvis, M. 2002, AJ, 123, 583
- Blakeslee et al. (2003) Blakeslee, J. P., Anderson, K. R., Meurer, G. R., Benítez, N., & Magee, D. 2003, ASP Conf. Ser. 295: Astronomical Data Analysis Software and Systems XII, 12, 257
- Chartas & Getman (2002) Chartas, G. & Getman, K. 2002, http://www.astro.psu.edu/users/chartas/xcontdir/xcont.html
- Dickey & Lockman (1990) Dickey, J. M. & Lockman, F. J. 1990, ARA&A, 28, 215
- Ettori et al. (2004) Ettori, S., Tozzi, P., Borgani, S., & Rosati, P. 2004, A&A, 417, 13
- Fischer & Tyson (1997) Fischer, P. & Tyson, J. A. 1997, AJ, 114, 14
- Fruchter & Hook (2002) Fruchter, A. S., & Hook, R. N. 2002, PASP, 114, 144
- Gehrels (1986) Gehrels, N. 1986, ApJ, 303, 336
- Giavalisco et al. (2004) Giavalisco, M., et al. 2004, ApJ, 600, L93
- Gladders & Yee (2005) Gladders, M. D., & Yee, H. K. C. 2005, ApJS, 157, 1
- Heymans et al. (2005) Heymans, C., et al. 2005, MNRAS, 361, 160
- Hirata & Seljak (2003) Hirata, C. & Seljak, U. 2003, MNRAS, 343, 459
- Högbom (1974) Högbom, J. A. 1974, A&AS, 15, 417
- Holden et al. (2001) Holden, B. P., et al. 2001, AJ, 122, 629
- Jee et al. (2005a) Jee, M. J., White, R. L., Benítez, N., Ford, H. C., Blakeslee, J. P., Rosati, P., Demarco, R., & Illingworth, G. D. 2005, ApJ, 618, 46 (Paper I)
- Jee et al. (2005b) Jee, M. J., White, R. L., Ford, H. C., Blakeslee, J. P., Illingworth, G. D., Coe, D., & Tran, K. H. 2005, ApJ, in press (Paper II)
- Kaastra & Mewe (1993) Kaastra, J. S. & Mewe, R. 1993, A&AS, 97, 443
- Kaiser (2000) Kaiser, N. 2000, ApJ, 537, 555
- Kinney et al. (1996) Kinney, A. L., Calzetti, D., Bohlin, R. C., McQuade, K., Storchi-Bergmann, T., & Schmitt, H. R. 1996, ApJ, 467, 38
- Liedahl, Osterheld, & Goldstein (1995) Liedahl, D. A., Osterheld, A. L., & Goldstein, W. H. 1995, ApJ, 438, L115
- Lombardi & Bertin (1999) Lombardi, M. & Bertin, G. 1999, A&A, 348, 38
- Lombardi et al. (2005) Lombardi, M., et al. 2005, ApJ, 623, 42
- Mei et al. (2005) Mei, S., Holden, B. P., Blakeslee3, J. P., Rosati, P., Postman, M., Jee, M. J., Rettura, A., Sirianni, M., Demarco, R., Ford, H. C., Franx, M., Homeier, N., & Illingworth, G. D. 2005, ApJ, submitted
- Meurer et al. (2003) Meurer, G. R., et al. 2003, Proc. SPIE, 4854, 507
- Nakata et al. (2005) Nakata, F., et al. 2005, MNRAS, 357, 1357
- Ponman et al. (1999) Ponman, T. J., Cannon, D. B., & Navarro, J. F. 1999, Nature, 397, 135
- Refregier (2003) Refregier, A. 2003, MNRAS, 338, 35 (R03)
- Richmond (2002) Richmond, M. 2002, Match, Version 0.8 (Rochester: Rochester Inst. Tech.), http://spiff.rit.edu/match/
- Rosati et al. (1999) Rosati, P., Stanford, S. A., Eisenhardt, P. R., Elston, R., Spinrad, H., Stern, D., & Dey, A. 1999, AJ, 118, 76
- Rosati et al. (2002) Rosati, P., Borgani, S., & Norman, C. 2002, ARA&A, 40, 539
- Rosati et al. (2004) Rosati, P., et al. 2004, AJ, 127, 230
- Schlegel, Finkbeiner, & Davis (1998) Schlegel, D. J., Finkbeiner, D. P., & Davis, M. 1998, ApJ, 500, 525
- Seitz & Schneider (1995) Seitz, C. & Schneider, P. 1995, A&A, 297, 287
- Stanford et al. (1997) Stanford, S. A., Elston, R., Eisenhardt, P. R., Spinrad, H., Stern, D., & Dey, A. 1997, AJ, 114, 2232
- Stanford et al. (2001) Stanford, S. A., Holden, B., Rosati, P., Tozzi, P., Borgani, S., Eisenhardt, P. R., & Spinrad, H. 2001, ApJ, 552, 504
- Stern et al. (2002) Stern, D., et al. 2002, AJ, 123, 2223
- Tozzi & Norman (2001) Tozzi, P., & Norman, C. 2001, ApJ, 546, 63
- Tozzi et al. (2003) Tozzi, P., Rosati, P., Ettori, S., Borgani, S., Mainieri, V., & Norman, C. 2003, ApJ, 593, 705
- Vikhlinin et al. (2002) Vikhlinin, A., VanSpeybroeck, L., Markevitch, M., Forman, W. R., & Grego, L. 2002, ApJ, 578, L107