Warm Water Vapor around Sagittarius B211affiliation: Based on observations with ISO, an ESA project with instruments funded by ESA Member States (especially the PI countries: France, Germany, the Netherlands and the United Kingdom) and with participation of ISAS and NASA.
Abstract
In the region of Sgr B2 there are several condensations heated externally by nearby hot stars. Therefore H2O far–IR lines are expected to probe only an external low–density and high temperature section of these condensations, whereas millimeter-wave lines can penetrate deeper into them where the density is higher and Tk lower. We have conducted a study combining H2O lines in both spectral regions. First, Infrared Space Observatory observations of several H2O thermal lines seen in absorption toward Sgr B2(M) at a spectral resolution of 35 km s-1 have been analyzed. Second, an IRAM–30m telescope map of the para–H2O line at 183.31 GHz, seen in emission, has also been obtained and analyzed. The H2O lines seen in absorption are optically thick and are formed in the outermost gas of the condensations in front of the far–IR continuum sources. They probe a maximum visual extinction of 5 to 10 mag. Radiative transfer models indicate that these lines are quite insensitive to temperature and gas density, and that IR photons from the dust play a dominant role in the excitation of the involved H2O rotational levels. In order to get the physical conditions of the absorbing gas we have also analyzed the CO emission toward Sgr B2(M). We conclude, based on the observed CO =7–6 line at 806.65 GHz with the Caltech Submillimeter Observatory, and the lack of emission from the far–IR CO lines, that the gas density has to be lower than 104 cm-3. Using the values obtained for the kinetic temperature and gas density from OH, CO, and other molecular species, we derive a water column density of (93)1016 cm-2 in the absorbing gas. Hence, the water vapor abundance in this region, (H2O), is (1-2)10-5. The relatively low H2O/OH abundance ratio in the region, 2-4, is a signature of UV photon dominated surface layers traced by far–IR observations. As a consequence the temperature of the absorbing gas is high, T300-500 K, which allows very efficient neutral–neutral reactions producing H2O and OH. On the other hand, the 183.31 GHz data provide a much better spatial and spectral resolution than the far-IR ISO data. This maser line allows to trace water deeper into the cloud, i.e., the inner, denser (105-6 cm-3) and colder (Tk40 K) gas. The emission is very strong toward the cores. The derived water vapor abundance for this component is a few10-7. There is also moderate extended emission around Sgr B2 main condensations, a fact that supports the water vapor abundance derived from far–IR H2O lines for the outer gas.
Subject headings:
infrared: ISM: lines and bands — ISM: individual (Sgr B2) — ISM: molecules1. Introduction
The determination of water abundance in space is a long standing problem in Astronomy. Theoretical models predict that water can be the most abundant species in warm molecular clouds after H2 and CO (Neufeld et al., 1995). Therefore, the determination of its spatial distribution and abundance contributes to a better knowledge of the chemical and physical processes that take place in the interstellar medium (ISM).
Unfortunately, water is an abundant molecule in our atmosphere making particularly difficult the observation of its rotational lines and vibrational bands from Earth. Even so, some observations of water lines have been performed from ground–based and airborne telescopes: the at 22 GHz (Cheung et al., 1969), the at 325 GHz (Menten et al., 1990), the at 321 GHz (Menten et al. 1990b, ) and the at 183.31 GHz (Watson et al. 1980; Cernicharo et al. 1990, 1994, 1996, 1999a; González-Alfonso et al., 1998). Due to the maser nature of these lines, the analysis and interpretation of the spectra is not obvious. Among these lines, only two have been used to map the extended emission of water vapor in Orion: the -hereafter the 183 GHz line- (Cernicharo et al., 1994) and the at 325 GHz (Cernicharo et al., 1999). However, although we know from ISO and SWAS observations that water is extended (25′25′) in Sgr B2 (Cernicharo et al. 1997, Neufeld et al. 2003, Goicoechea et al. 2004), little is known about its excitation conditions and its detailed spatial distribution. An alternative to indirectly estimate the water abundance in the Galactic Center (GC) is to use related species such as HDO (Jacq et al., 1990; Comito et al., 2003) or H3O+ (Phillips et al., 1992; Goicoechea & Cernicharo, 2001). In none of these cases, the determination of (H2O) is straightforward.
The ISO mission (Kessler et al., 1996), and specially, the Long Wavelength Spectrometer, LWS, (Clegg et al., 1996), and the Short Wavelength Spectrometer, SWS, (de Graauw et al., 1996), have provided a unique opportunity to observe several H2O lines in a great variety of astronomical environments. Nevertheless, the majority of these observations were performed at the low spectral resolution of the grating mode (1000 km s-1), which produces a critically strong dilution in the search for molecular features in most ISM sources. Nevertheless, the Sgr B2 cloud has been analyzed and studied in detail with the LWS/Fabry–Perot, which provided a velocity resolution of 35 km s-1 (Goicoechea et al. 2004, hereafter G04).
Opposite to what is found toward other star forming regions such as Orion (Cernicharo, 1999), the observations of the line at 179.5 m in Sgr B2 show that the line appears in absorption rather than in emission (Cernicharo et al., 1997). Afterward, the launch of the Submillimeter Wave Astronomy Satellite, SWAS, (Melnick et al., 2000), and ODIN (Nordh et al., 2003) allowed the observation of the fundamental transition of both HO at 557 and HO at 548 GHz, first detected by the Kuiper Airborne Observatory, KAO, (Zmuidzinas et al., 1995). Although the velocity resolution is 1 km s-1, the large beam of SWAS (4′) makes these observations more sensitive to the cold and less dense gas. SWAS observations have provided a reliable estimate of the water vapor abundance in the low excitation clouds located in the line of sight toward Sgr B2 (Neufeld et al., 2000; Neu03, 2002). However, the fact that only the ground-state absorption line is detected makes difficult a detailed study of water vapor excitation mechanisms in Sgr B2 itself. This is the most massive cloud in the Galaxy, with 107 M⊙, (Lis & Goldsmith, 1990), and a paradigmatic object in the GC region as its geometrical properties, physical conditions and chemical characteristics make it a miniature galactic nucleus with 15′ extent (G04 and references therein).
The main star-forming regions in Sgr B2 are located within three dust condensations, labeled as (N), (M) and (S). These condensations are embedded in a 10 pc moderate–density ( cm-3) cloud (Lis & Goldsmith, 1991; Hüttemeister et al., 1993). In addition, these structures are surrounded by lower density components of warm (Tk100 K) gas, hereafter the Sgr B2 warm envelope. These conditions have been derived mainly from absorption observations of NH3 metastable lines (Wilson et al., 1982; Hüttemeister et al., 1995), OH lines (Goicoechea & Cernicharo, 2001; 2002), and H2CO lines (Martín–Pintado et al., 1990) in the radio domain. Nevertheless, the warm and low density gas is poorly traced by radio observations of other molecular species (generally excited by collisions in the denser regions and thus observed in emission). However, the warm envelope represents the strongest contribution to the absorption features produced by many light hydrides in the far-IR spectrum of Sgr B2 (G, 04). The origins of the observed rich chemistry and the heating mechanisms in the Sgr B2 warm envelope are a subject of intense debate. The matter is complicated due to the different observational signatures to be integrated in the same picture: high temperatures derived from NH3 absorption lines (Hüttemeister et al., 1995; Ceccarelli et al., 2002), fine structure emission from the photo–ionized and photo–dissociated gas (G, 04), SiO and X–ray distribution (Martín–Pintado et al., 2000), etc.
In all possible scenarios, water plays a significant role. Several mechanisms allow its formation and survival in the warm envelope. Dissociative recombination of H3O+ leads to the production of H2O and OH. This processes depend on the specific branching ratio for the H2O formation channel. Unfortunately, the determination of with different experimental procedures has also yielded different values, from =0.05 (Williams et al., 1996) to =0.25 (see Jensen et al., 2000), while most chemical models have used 0.35. In addition, water could also be produced in the gas phase by the endothermic reaction:
| (1) |
However, the gas temperature must exceed 300 K to overcome the activation barrier (Neufeld et al., 1995). At these temperatures, the reaction:
| (2) |
also contributes to the formation of OH. Therefore, H2O and OH column densities can be used to determine the role of the neutral-neutral reactions in their formation/destruction routes. Still, the exact H2O/OH ratio will be determined by , the temperature and by photodissociation processes if UV radiation is present. As an example, Neufeld et al. (Neu03, 2002) studied a diffuse cloud (1, =100 cm-3) toward W51 and showed that the presence of a warm gas component (Tk400 K) could explain the observed variations of the H2O/OH ratio respect to other diffuse clouds.
Finally, high oxygen depletion onto water ice mantles in dust grains could have taken place during the evolution of the cool gas in Sgr B2. Photodesorption and/or evaporation for dust temperatures above 90 K, could release some water back into the gas phase enhancing the H2O abundance expected from pure gas–phase formation (Bergin et al., 2000). However, gas and dust are thermally decoupled in the outer layers of Sgr B2, where the dust temperatures are significantly lower, Td20–30 K (Gordon et al., 1993; G, 04), than gas temperatures, Tk300 K (Goicoechea & Cernicharo, 2002; Ceccarelli et al., 2002). Thus, Td seems too low to produce significant evaporation of water ice mantles. Therefore, a detailed study of the far–IR H2O lines and of the 183.31 GHz extended emission is needed to constrain the water abundance and the physical characteristics of the absorbing/emitting region.
In this work we present and analyze the far-IR observations of several thermal lines of water vapor toward Sgr B2(M) and the first map of the 183.31 GHz maser emission of para–H2O around Sgr B2 main condensations. The layout of the paper is as follows: In Section 2 we summarize the far–IR, submm and mm observations and data reduction. The spectra and maps are presented in Sec.3. Section 4 is devoted to the analysis of CO observations (4.1) and water vapor observations (4.2) with different radiative transfer methods. The main implications of our work are discussed in Sec. 5, where photochemistry models for H2O and OH are also presented. A summary is given in Sec. 6.
2. Observations and Data Reduction
2.1. Far-IR observations
Most pure rotational lines of water vapor that play a role in the radiative heating and cooling of the dense ISM appear in the Terahertz domain. Thus, airborne or satellite observations are needed to avoid the Earth’s atmosphere blocking. In particular, many pure rotational lines of H2O appear in the far–IR coverage of the LWS spectrometer (Clegg et al., 1996) on board ISO (Kessler et al., 1996). We have used the LWS Fabry-Perot (FP) instrument to search for H2O and HO lines toward Sgr B2(M). The LWS/FP spectral resolution is 7000-1000 and has a circular aperture of about 80′′ in diameter. The majority of detected lines have been observed in the time awarded to our ISO proposals. However, an extensive inspection of the public ISO data base33affiliationmark: has been carried out in order to examine and average all available water lines. Most of the water lines were present in the Astronomical Observation Template (AOT) LWS04 observations, which give a large spectral sampling, wavelength precision and S/N ratios. The number of scans in this mode was 12 depending on the expected absorption produced by the different species.
These LWS products have been processed and compared through Off-Line-Processing (OLP) pipeline 6.0 and 10.1 versions. There are no major differences except that recent pipelines produce 10% less absorption in some lines due to continuum level differences from one OLP to another. The data were analyzed using the ISO spectrometers data reduction package ISAP44affiliationmark: . The mean FP continuum flux of each line deviates by 20% and this can be taken as the flux calibration error (Swinyard et al., 1998; Gry et al., 2003). After checking the continuum level of the AOT LWS01 observations, a polynomial baseline was fitted to each spectra and adopted as FP continuum level.
2.2. Millimeter and submillimeter observations
The water line at 183.31 GHz can be observed from high mountain-top sites under very dry conditions (Cernicharo et al., 1990). The observations in the direction of Sgr B2 were achieved with the IRAM-30m telescope, with a half–power–beam–width (HPBW) of 13′′, in December 1999 and January 2004. The source transits at 24 degrees elevation at Pico Veleta, but even so the average atmospheric opacity over a bandwidth of 0.5 GHz centered at 183.3 GHz was 1.7, i.e. an atmospheric water column of 0.9 mm along the line of sight. We used and SIS receiver designed to cover the band 130-184 GHz. In its higher end, the receiver temperature is about 160 K and the sideband rejection is at least 18 dB. The backend used was a 512 two-pole filter with half-power widths and spacings equal to 1.0 MHz. With these conditions, and in this configuration, system temperatures were typically around 3000 K. The pointing was checked using the already known strong emission of W49N (Cernicharo et al., 1990). Once it was verified that the Sgr B2 emission was quite compact, the map was carried out in wobbler-switching mode in order to obtain very flat baselines. Observations were also tried in January 2001, 2002 and 2004. In the 2001 run the weather was poor while in the last run it was possible to have a 30 minutes window of observing time with good atmospheric transmission. These runs allowed us to check that the line profile in the position peak of Sgr B2(M) was the same of December 1999 and to confirm that the extent of the water emission toward this condensation was larger than the beam size. In the January 2004 observing run we also had very good atmospheric transmission to perform observations around Sgr B2(N). However, the measured line fluxes were lower than in previous observations by a constant factor. As the line profiles did not change, we scaled the 1999 observations to those the reference taken in the (0”,+5”) position in 2004 (see Fig. 2).
The CO 7-6 (806 GHz) observations were performed on March 10, 2002 with the 10.4 m Caltech Submillimeter Observatory (CSO) located at the summit of Mauna Kea (Hawaii). The receiver is a helium-cooled SIS mixer operating in double-sideband mode (DSB) providing an instantaneous bandwidth of 0.95 GHz and designed to fully cover the 780-910 GHz atmospheric window (see Kooi et al., 2000). The pointing was checked using a strong CO point-like source in the nearby W28 molecular cloud, and was kept within 3′′ accuracy for a HPBW of 10′′. Two different acousto-optic spectrometer (AOS) backends were used with 2048 and 1024 channels respectively for a total spectral coverage of 1.5 and 0.5 GHz in each case. The zenith atmospheric water vapor column was 0.5 mm during the observations, resulting on system temperatures ranging from 6000 to 10000 K depending on the receiver and the elevation. CO emission is very extended around Sgr B2, so we had to perform position switched scans setting the off position 1 degree away in azimuth. An additional 5% increase had to be applied to T in order to second-order correct the standard chopper-wheel” calibration method at high frequencies with large atmospheric opacities (Pardo et al. 2005).
3. Results
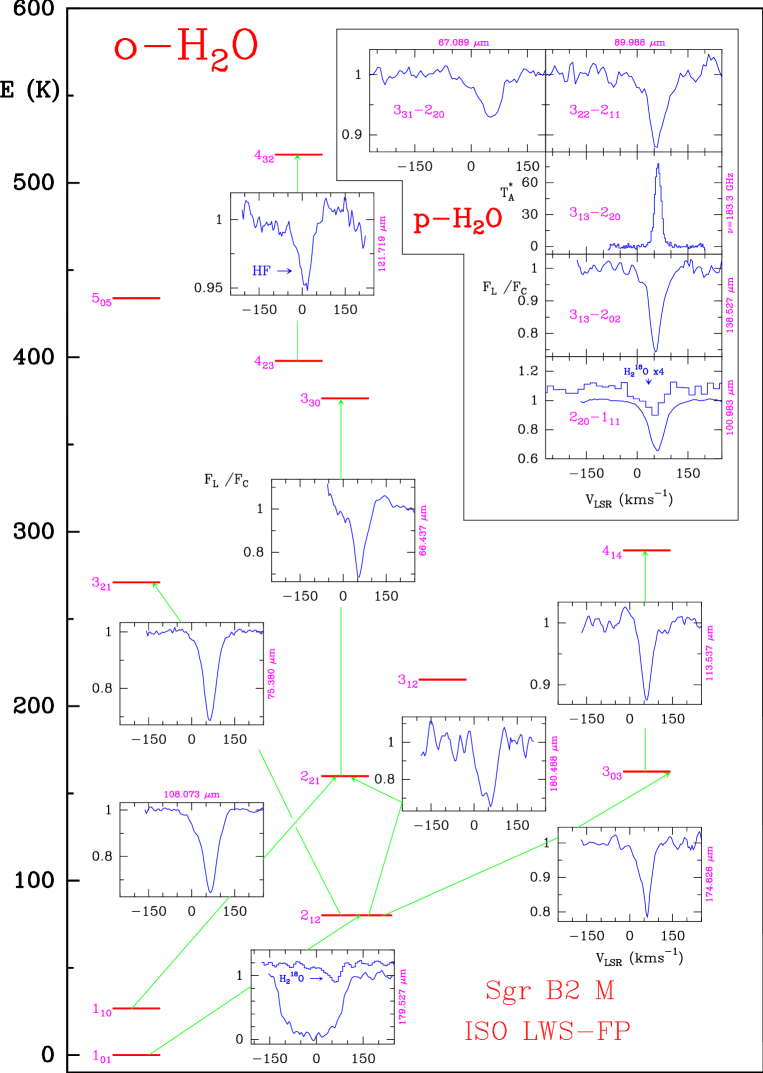
The far–IR spectrum of Sgr B2(M) is dominated by the absorption produced by NH3, OH and H2O rotational lines (G, 04). The detected far-IR lines of water vapor are shown in Fig. 1. H2O spectroscopical and observational data are tabulated in Table 1. Except the ground state line of -H2O at 179.5 m (1669.9 GHz), all water lines have a similar profile and are centered at Sgr B2(M) velocities. The 179.5 m line is saturated and absorbs from –150 to +100 km s-1, which therefore includes the water vapor located in the foreground gas toward the GC and the warm gas around Sgr B2(M). The widespread absorption produced by the line has been previously presented in Cernicharo et al. (1997) and enlarged in G04 (9′27′), while the absorption has been mapped (26′19′) by SWAS (Neufeld et al. 2003). These observations probe that low excitation H2O is present in the clouds intersecting the line of sight toward large areas of Sgr B2.
The average velocity of all H2O lines observed with the ISO/LWS–FP is 605 km s-1, in agreement with the velocity of other related oxygen species such as H3O+ or OH (Goicoechea & Cernicharo, 2001; 2002). Taking into account the wavelength calibration error of the LWS/FP instrument, this velocity is compatible with the expected 65 km s-1 cloud seen in radio observations (Hüttemeister et al., 1995). We note, however, that velocities close to 60 km s-1 are also associated with gas surrounding most Sgr B2 continuum sources, so that the bulk of the H2O absorption can arise from them.
Possible overlapping with other molecular species occurs at some wavelengths. In particular, the o–H2O 432–423 line is blended with HF =2–1 at 121.697 m (Neufeld et al., 1997) and the o–HO 212–101 line at 181.053 m has a small contribution from H3O+ Q(1,1) (Goicoechea & Cernicharo, 2001).
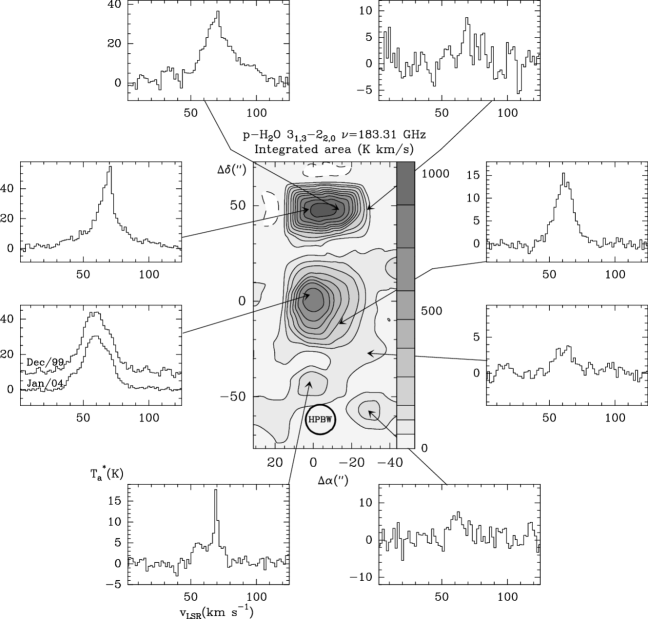
Observations of the 183.31 GHz H2O line (Eu205 K) toward Sgr B2 are presented in Fig. 2. The emission appears at the LSR velocities of Sgr B2 with no contribution from the line of sight clouds. The emission appears at least in the 50-75 km s-1 range. Note the different line shapes and intensities of the 183.31 GHz emission for positions in front and around the main condensations (here the line appears much wider).
Finally, Fig. 3 shows the CO =7–6 line (Eu150 K) observed toward Sgr B2(M). This CO line shows a strong self–absorption at 70 km s-1 (the velocity of the 183.31 GHz H2O line peak at his position) so that the profile peaks at 55 and 85 km s-1. Similar patterns are shown by lower-J CO lines.
4. Analysis and discussion
4.1. Carbon Monoxide
The warm gas present in the outer layers of Sgr B2(M) might be expected to radiate in high– CO lines. The CO =14–13 transition at 185.999 m is the one with the lowest energy level (Eu581 K) within the range of ISO/LWS detectors. However, we have not detected any emission/absorption from CO (3 limits are 210-18 W cm-2) in the ISO/LWS spectra toward the Sgr B2 region (G, 04), with both grating and FP. CO spectroscopical data and line flux upper limits are tabulated in Table 2. Nevertheless, recent studies of the large scale CO =7–6 emission toward the GC with the Antarctic Submillimeter Telescope and Remote Observatory (AST/RO) have shown that the emission is concentrated toward Sgr B and Sgr A complexes (Kim et al., 2002). Fig. 3 shows higher spectral/angular resolution observations of this line taken with the CSO telescope toward the Sgr B2(M) position. Hence, it seems that at a given level, the rotational CO line emission disappears from the Sgr B2 spectrum.

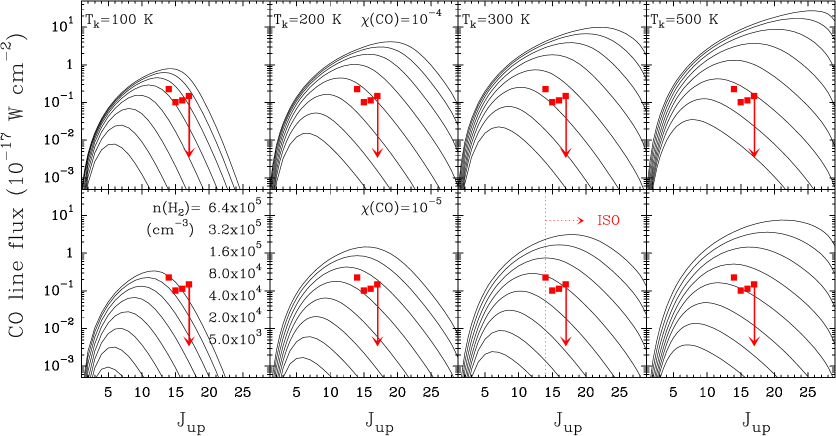
We have performed nonlocal radiative transfer calculations to try to reproduce the lack of high– CO lines in the far–IR spectrum of Sgr B2(M), and to help constraining the physical parameters needed to model the water vapor absorption. In Fig. 4 we show the predictions of a nonlocal model for several high– transitions of CO. The nonlocal model used here is an adaptation of the radiative transfer code developed by González–Alfonso & Cernicharo (Gon93, 1993) with the inclusion of dust in the transfer (Cernicharo et al., 2000). We have implemented it for high– levels of CO (see Sec. 4.2.2 for further details on the specific model developed for Sgr B2(M)). The collisional rates have been taken from Flower (2001). The dust continuum emission has been modeled following Goicoechea and Cernicharo (2002) and G04 (see section 4.2.1). We have run an array of models for CO abundances55affiliationmark: of 10-4 and 10-5 with Tk varied from 100 to 500 K and from 5.0103 to 6.4105 cm-3. From these results it is clear that in order to suppress the far–IR CO emission, and to match the CO =7–6 line emission, low H2 density is required. In particular, if the CO =7–6 line arises from a layer of gas at Tk100 K the model with =2104 cm-3 correctly reproduces the absence of far–IR lines. However, if it arises from the same outer layer of warm OH (Tk300 K) detected in the far–IR (Goicoechea & Cernicharo, 2002), the limit for the density will be 104 cm-3. In any case, the lack of high– CO lines is an evidence of the low density gas located in front of the far–IR continuum source. In the following section we will constrain the physical parameters of this layer by studying the available water vapor lines.
4.2. Water Vapor
The main observational result of this work is that the far–IR water lines toward Sgr B2(M) appear in absorption, while the 183.31 GHz line is seen in emission around and in the main condensations. The fact that the continuum emission in the far–IR is optically thick (G, 04) indicates that the H2O absorption lines arise from regions where the excitation temperatures (Tex) are smaller than the dust temperatures inferred from the continuum emission. However, the problem of the H2O line excitation toward Sgr B2 is not straightforward. Apart from self–absorption and the possible excitation by collisions with molecules (e.g. H2), atoms (e.g. He) and (if the ionization fraction is significant), the level population can be primarily determined by the thermal emission of dust, the role of which is essential in the excitation of molecules such as H2O or OH which have many rotational lines in the far– and mid–IR. This represents a major difference with respect to the excitation treatment of molecules observed in the radio domain where, generally, one can neglect the excitation by dust photons. If the excitation is dominated by IR photons, the two transitions arising from the ground levels of ortho-water, 212–101 and 110–101, will determine how the higher energy levels will be populated. Even if collisions are important, the presence of an optically thick far–IR continuum will strongly affect the Tex of water and, thus, it must be carefully taken into account in the models. In the case of Sgr B2, this means that the external dust layers of the cloud will absorb the possible water line emission from the inner regions. Knowledge of the geometry of the region to be modeled and the relative filling factors of the dust and gas in the beam of the LWS instrument, are also important for the models. For this reason, high angular resolution ground-based observations of the 183.31 GHz water line are particularly important to model the water vapor radiative transfer in Sgr B2.
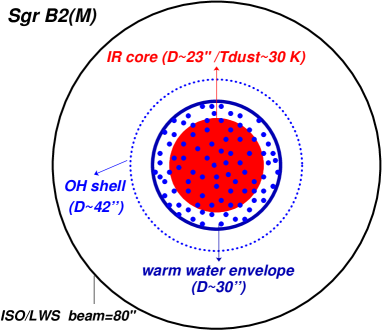
4.2.1 Large Velocity Gradient modeling
In this section we analyze the H2O observations with a multi-molecule Large Velocity Gradient (LVG) model. For Sgr B2(M) we have adopted a spherical geometry with two components (see Fig. 7): a uniform continuum core with a diameter of 23′′ (1 pc for a distance of 8.5 kpc) and a shell of variable thickness and distance to the core. The presence of an external shell of molecular gas (not resolved by the ISO/LWS beam) surrounding a central condensation is indicated by the analysis of the far–IR OH (Goicoechea & Cernicharo, 2002) and NH3 lines (Ceccarelli et al., 2002) and it is also supported by H2O 183.31 GHz line observations (Fig. 2). In particular Goicoechea & Cernicharo (2002) found an angular size of 42′′ for the OH envelope. The bulk of the H2O absorption lines must arise from the OH layers, or inside them. Following the OH model geometry and Figs. 2 and 3, a total size of 30′′ (1.2 pc) for the coreshell cloud has been adopted. The core is considered as a gray–body with an opacity at 80 m of 2.5, with a dust opacity law given by , and a dust temperature of 30 K. These values are consistent with the color temperatures and dust emissivities derived from the analysis of the ISO/LWS continuum observations at the same wavelengths of the detected far–IR H2O lines (G, 04). Although dust temperatures can be slightly larger (Td60–80 K) inside the cloud (from the analysis of the millimeter continuum emission) or slightly lower (Td20 K) in the outer and colder diffuse layers (from the analysis of extended IRAS continuum emission; Gordon et al. 1993), we judged Td30 K as the most representative value for the dust grains coexisting with the molecular species detected in the far–IR. The bulk of the continuum emission detected by ISO can be hardly fitted with dust temperatures below 30 K. The emission of higher temperature dust arising from the innermost regions of Sgr B2 is hidden in the FIR by the huge amount of foregroung gas and colder dust.
For these models we have considered an ortho–H2O column density of 1.81016 cm-2 and a para–H2O column density of 0.61016 cm-2. These are lower limits suggested by the nonlocal radiative transfer models (see below). The LVG model computes the statistical equilibrium population of the rotational levels for ortho–H2O and para–H2O independently. The collisional rates were scaled from those of H2O–He collisions (Green et al., 1993).

Several LVG computations for some selected ortho– and para–H2O transitions in the THz domain are shown in Fig. 5. The excitation temperature Tex of each transition is shown in each panel as a function of Tk and . The thick contour corresponds to the equivalent temperature of the continuum core. Therefore, to the left of this contour, water lines appear in absorption. From the LVG models it is clear that high density and temperature are required to observe the far–IR water lines in emission. For the range of densities implied by the CO observations (104 cm-3), the H2O lines observed by the ISO/LWS are correctly predicted in absorption. The temperature of the absorbing layer is, however, more difficult to estimate because the possible solutions for a given (low) density model are not very sensitive to temperature variations, as indicated by the smooth change of Tex for constant density as the kinetic temperature goes from 500 to 100 K. LVG models predict that, in addition to dust photons, collisions play a role in the excitation of the lowest H2O rotational levels. The higher energy levels are pumped from the lowest levels by absorption of far–IR photons. In the case of the ortho–H2O 110–101 line observed by SWAS (Neufeld et al. 2000), only moderate densities (5104 cm-3) are needed to observe the line in emission. This is the case of the extended emission in the 110–101 line observed in the 180 pc Molecular Ring around the GC between 80 and 120 km s-1 (Neufeld et al. 2003). For the density conditions derived for the Sgr B2 velocity range and for the line of sight clouds, the 557 GHz line is correctly predicted in absorption. A similar behavior is expected for the para–H2O 111–100 line at 269.3 m (1113 GHz) that will be observed by future heterodyne instruments such as HIFI/Herschel.
Among all the moderate excitation para–H2O lines (El450 K), only the 313–220 appears in the mm domain. Contrary to other H2O maser lines accessible from ground–based telescopes, relatively low Tk and density are required for the 313–220 line inversion. These conditions allowed the first detection of extended water emission in Orion (Cernicharo et al. 1994), and a strong dependence of the emission with Tk was revealed. Hence, the 183.31 GHz line could be an excellent tracer of the warm gas in molecular clouds.
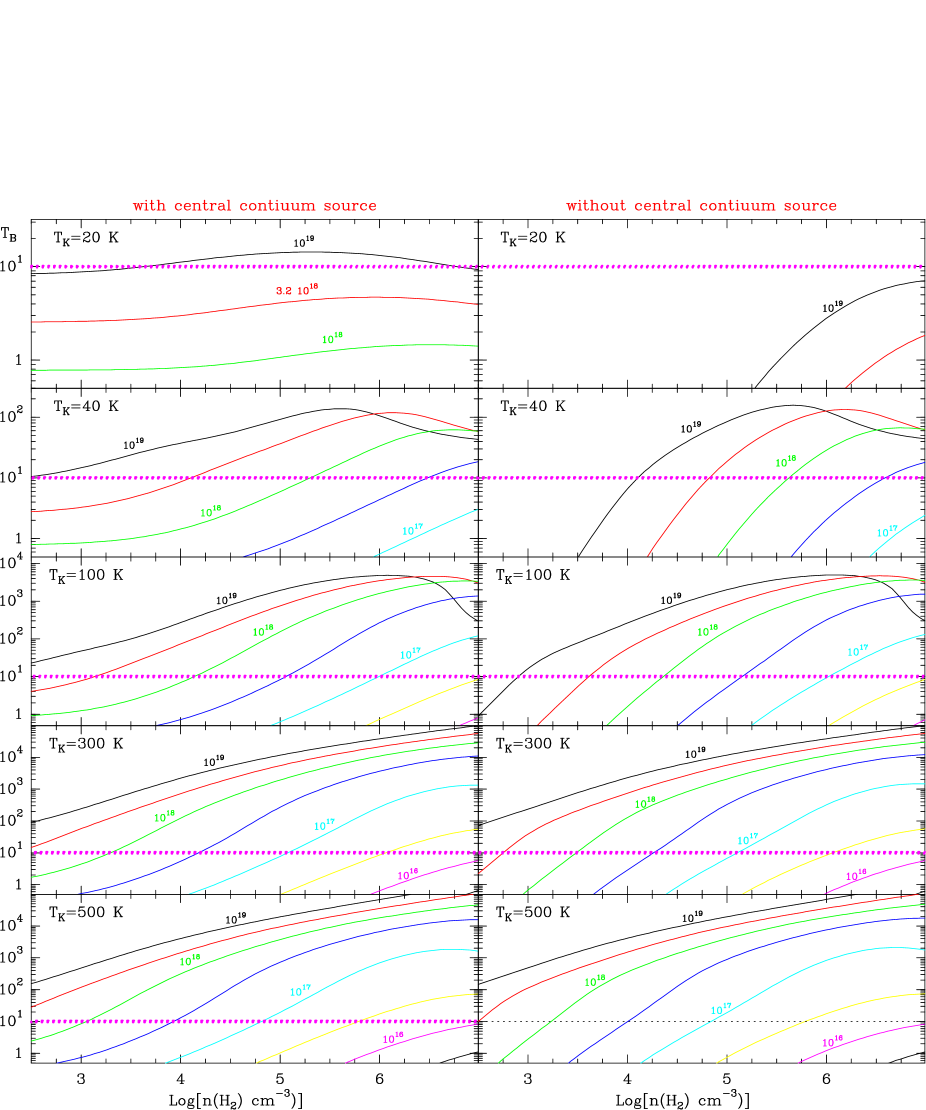
We have used the same LVG model to analyze the 183.31 GHz line inversion mechanism that produces extended emission in Sgr B2 (Fig. 2). Fig. 6 shows different excitation models for the 313–220 transition. Since a fraction of the 183.31 GHz line emission may arise from the warm envelope in front of the far–IR continuum source, models with and without a central continuum source (the same described at the beginning of the section) have been considered. For a given Tk (from 20 to 500 K), each panel shows computations of different para–H2O column densities as a function of TB (in K) and H2 volume density. For low temperatures (Tk40 K) and moderate densities (105 cm-3), the line will be observable for large (p–H2O) values only if a continuum source is present. Due to the minor role played by collisions in the pumping of the rotational levels at these temperatures, the line intensity is almost independent of the density. Nevertheless, as the temperature increases, collisions start to be significant, and the expected intensity of the 183.31 GHz line becomes less sensitive to the models with or without the continuum source.
The 183.31 GHz emission is produced by the population inversion of the 313 and 220 levels. This is due to the different rates (far from the thermalization densities) at which both levels can be populated. The 313 level is radiatively connected with the 220 and 202 lower energy levels. The Aij coefficient for the 313–202 at 138.5 m is 104 times larger than the Aij of the 313–220 transition. The 138.5 m line is seen in strong absorption in the ISO/LWS spectra (see Fig. 1). The 220 level is radiatively connected with the 211 and 111 lower energy levels. The 220–111 at 100.9 m produces the strongest absorption of para–H2O in the far–IR (see Fig. 1). On the other hand, the 313 level is radiatively connected with the 322, 422 and 404 higher energy levels, while the 220 level is connected with the 331 (see the 67.1 m line in Fig. 1) and with the 313 higher energy levels. The different radiative pathways and rates (for ) at which the 313 and 220 levels can be populated produce the inversion. LVG models (see Fig. 6) show that this mechanism can be efficient to produce 183.31 GHz line emission in regions of relatively low density.
The observed extended emission at 183.31 GHz has a brightness temperature of 10 K in average (see Fig. 2). Assuming that it arises from the low density regions in which the the far–IR continuum sources are embedded, with Tk300-500 K and 104 cm-3, we derive a value for (p–H2O) of 51017 cm-2. This value is higher than the one derived from the far-IR water lines (see sect. 4.2.2) possibly because the 183.31 GHz line penetrates deeper into this dusty environment. Toward the main condensation, the bulk of the emission seems to arise from the cold (T40 K) and dense gas. Under these conditions, a brightness temperature of the line of 100 K would translate into a p–H2O column density of 1019 cm-2. However, an important contribution could come from the embedded high temperature and high density core condensations where the column density should also be much larger.
4.2.2 Non-Local radiative transfer models
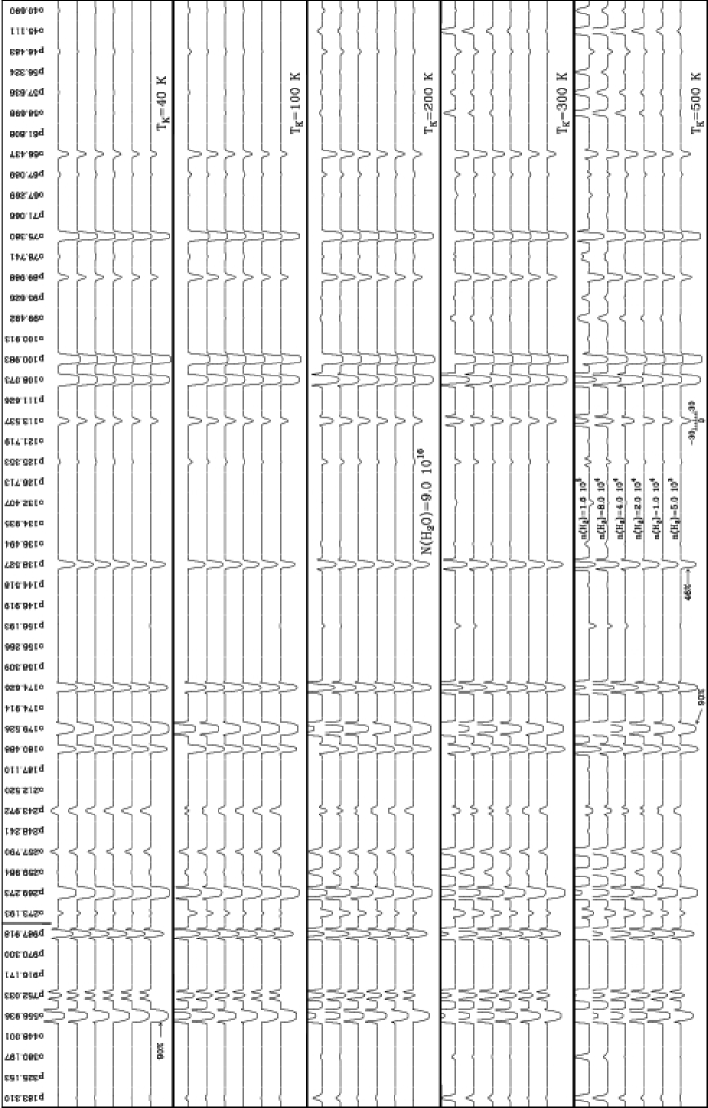
To take into account the radiative coupling between regions with different physical and/or excitation conditions, the radiative transfer has to be treated with nonlocal techniques, more sophisticated than the LVG approximation. We have adapted the radiative transfer used in Sec. 5.1 for CO, to the ground vibrational states of ortho– and para–H2O respectively. The model includes all the water rotational levels with transitions between 40 m and 183.31 GHz. The level population is computed in statistical equilibrium considering collisional excitation and radiative excitation by line and continuum photons. This is computed consistently assuming that the water molecules and the dust grains are coexistent. The geometry, coreshell dimensions, are the same of that considered in the LVG models. The shell was divided in 41 layers. The central dust condensation has been modeled with identical parameters than in section 4.2.1. We have considered 14 rotational levels (Eu 608 K) of ortho-water for model with Tk below 100 K , and up to 30 rotational levels (Eup 1290 K) for the higher temperature models. We have adopted a turbulence velocity of 8 km s-1. The continuum radiation field has been treated as in González-Alfonso & Cernicharo (Gon93, 1993) by considering a spectral range of 70 km s-1 centered on each water transition. Collisional rates have been taken from Green et al. (1993). Obviously all the water transitions in the continuum core are thermalized to the dust temperature due to the large opacity in the far–IR. The computed line profiles are a result of convolving the brightness temperature with the angular resolution of the LWS detectors (80′′). The resulting spectral resolution of the synthetic water lines is 1 km s-1, as no convolution with the spectral resolution has been performed. To test the sensitivity of the model to the physical parameters, models were computed with (H2O) and Tk of 1.81016, 91016 and 4.51017 cm -2, and 40, 100, 200, 300 and 500 K respectively, while densities were increased from 5103 to 6.4105 cm -3 multiplying by 2 in each step. The different nonlocal radiative transfer models for the first two H2O column densities are shown in Figs. 8 and 9. Models for other column densities have been also ran. However, the observed absorption depth is not reproduced for column densities below 1016 cm -2. In the (H2O)=1.81017 cm -2 case too many lines would be in emission, contrary to the observations.
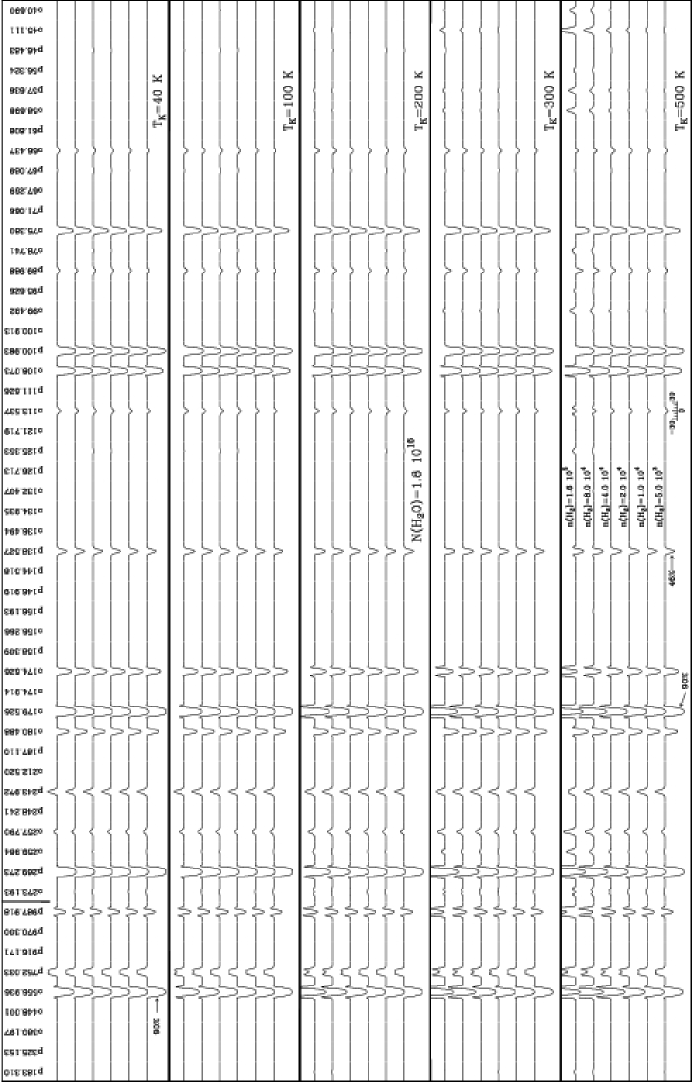
The main problem to interpret the H2O absorption toward Sgr B2 arises from the large opacities of the far–IR water lines, 103, and even 104 for the ortho–H2O 212–101 line at 179.5 m. Under these conditions, many weak water lines have to be detected to constrain the physical conditions and the column density. Therefore, we strength that it is difficult to obtain physical parameters from the observation of few far–IR water rotational lines. In addition, as the radiative excitation dominates the population of the far–IR levels, lines with a weak dependence on the dust excitation should be investigated. Taking into account the 14 water lines detected in the far–IR, the nonlocal results imply that models are not very sensitive to the temperature and that the only indication about the column density has to be searched in weak far–IR H2O lines or in the 183.31 GHz line (see Sec. 6.1.2). Even so, the far–IR absorption arises in the low density external layers of gas, while it is very likely that the 183.31 GHz line could have an important contribution from inner and denser regions. Another complication arises from the fact that for models of low (H2O) values and Tk200 K, it is also difficult to distinguish between different H2 densities (see Fig. 8). Limits to Tk and (H2) have to be searched in weak lines below 70 m.
The models for high water column densities (Fig. 9) predict absorption lines in the LWS range at 56.3, 57.6, 58.7, 78.7, 99.5, 125.4 and 136.5 m. At the spectral resolution and sensitivity of the LWS/FP, none of these lines has been detected. This implies that (H2O)4.51017 cm-2 toward the warm envelope of Sgr B2. The 136.5 m line (also predicted by the models with large column densities) is contaminated by the absorption produced by the C3 (8) rovibrational line, which is also predicted by the models of tri–atomic carbon Cernicharo et al. (2000). Some of these lines are predicted (even in emission) by the models with large (H2O). Models with (H2O)1.81016 cm-2 are consistent with ISO detections and upper limits to other ISO lines. Only the 67.1 m line is weaker than the observations. Therefore, models shown in Fig. 8 give a lower limit to the water vapor column density in the outer and warm (300-500 K) envelope. Taking into account the difficulties implied by the H2O modeling in the far–IR, we found that cm-2 is the best H2O column density to fit the ISO observations (see Figure 9). The CO analysis (Sec. 5), and the studies in the far–IR of OH (Goicoechea & Cernicharo, 2002) and the ammonia lines (Ceccarelli et al., 2002) and our CO data, also support that the water absorption lines arise in the warm and low density (104 cm-3) layer in front of Sgr B2(M). The H2O column density derived from ISO observations is below the lower limit of (H2O) estimated for the 183.31 GHz line for this component (see Sec. 4.2.1) as it is likely that an important fraction of the 183.31 GHz emission arises from the inner and denser regions closer to Sgr B2 main cores or even from them, as pointed out above. This component, with a mean H2 density of 105-6 cm-3, has been traced by the NH3 non–metastable emission lines, Tk100 K, (Hüttemeister et al., 1993) and by the emission of HC3N rotational lines, Tk20–40 K, (Lis & Goldsmith, 1991). The determination of the temperature from mm emission lines is also complicated in these regions completely obscured to ISO observations. Therefore, the observed differences in the 313–202 line–intensity and –shape can be a combination of (H2O) and/or Tk variations across the region.
The results presented in this section have been compared to those obtained from another radiative transfer based on a different approach (Asensio Ramos & Trujillo Bueno 2003; Asensio Ramos & Trujillo Bueno 2006). This code is a generalization to spherical geometry of the very fast iterative Multilevel Gauss-Seidel (MUGA) and Multilevel Successive Overrelaxation (MUSOR) methods developed by Trujillo Bueno & Fabiani Bendicho (1995) for the case of a two-level atom and generalized by Fabiani Bendicho, Trujillo Bueno & Auer (1997) to multilevel atoms in Cartesian geometries. The code also allows the application of the standard Multilevel Accelerated -iteration (MALI) (Olson, Auer & Buchler 1986). The angular information for the calculation of the mean intensity is obtained by solving the radiative transfer equation along its characteristic curves (straight trajectories with constant impact parameter) with the aid of the short-characteristics formal solver with parabolic precision (Kunasz & Auer 1988) . The statistical equilibrium equations are linearized with the aid of the preconditioning scheme developed by Rybicki & Hummer (1991, 1992) with the introduction of an approximate operator that can be efficiently obtained in the framework of the short-characteristics technique. The convergence rate of the MUGA and MUSOR schemes is equivalent to that obtained with the introduction of a nonlinear operator, with the advantage of not being necessary neither to calculate nor to invert such nonlinear operator. Interestingly, the time per iteration is similar to that obtained for the standard -iteration or the MALI method. The computing time for the MUGA scheme is reduced by a factor 4 with respect to MALI, while the MUSOR scheme leads to an order of magnitude of improvement in the total computing time with respect to MALI.
The calculations have been performed with the same geometry, the same molecular data (collisional and radiative transitions), and the same physical conditions of the previously described nonlocal code. The emerging line profiles from both codes are very similar, with differences below 2-3 %. Both codes predict lines in absorption/emission for the same physical conditions, with identical spectral shapes in the cases where re-emission is found in the line wings. This test of consistency allows us to be very confident in the results presented in Figs. 8 and 9 since they were obtained with numerical methods based on completely different approaches.
5. The warm envelope: Shocks, PDRs or XDRs ?
The H2O (OH) column densities derived from ISO observations in the warm envelope are within an order of magnitude of the shock model predictions for the same low density region (Flower et al., 1995). Nevertheless, –shocks have been invoked to explain the heating of large amounts of warm gas in the GC and also in the warm envelope (Wilson et al., 1982; Martín–Pintado et al., 1997). In addition, the shock models of (Flower et al., 1995) correctly reproduce the observed column densities of –bearing species such as NH2 and NH3 that could be ultimately related with the dust grain chemistry (G, 04).
A qualitative explanation came from the observation of large OH column densities
(H2O/OH2-4) in the warm envelope.
According to Goicoechea & Cernicharo (2002), if a far–UV radiation
field illuminates the outer regions of the cloud, water molecules could be
photodissociated producing an enhancement of the OH abundance expected only
from its formation through H3O+ dissociative recombination.
The presence of such an extended far–UV radiation field with
103-104 is inferred
from the [O iii], [N iii], [N ii], [C ii], and [O i] extended line emission
(G, 04). Therefore, an important contribution from H2O
photodissociation may explain the observed H2O/OH abundance
ratio in the external layers of the envelope.
To investigate in more detail the O–chemistry in the envelope, we have run several photochemistry calculations that include depth–dependent photodissociation, H3O+ dissociative recombination and neutral–neutral reactions. We have used the latest version of the public and available PDR model66affiliationmark: of Le Bourlot et al. (LBu93, 1993). 66footnotetext: http://aristote.obspm.fr/MIS/ The model does not include oxygen grain surface chemistry, but it is consistent with the low densities and high temperatures found in Sgr B2 envelope. Following (G, 04), we assume a =5103 radiation field and a =(H)+2(H2)=5103 cm-3 density. Assuming that the outer gas layers of Sgr B2 envelope are directly illuminated by such a radiation field, the model solves the UV transfer and the chemistry up to AV=20 mag. As a reference model we solve the thermal balance explicitly for an initial gas temperature of 500 K. The resulting H2O and OH column densities and the H2O/OH ratio are shown in Fig. 10 as a function of the visual extinction through the cloud. This PDR can only maintain the temperature above 100 K in the first 2 magnitudes of the cloud, where the UV radiation efficiently photodissociates H2O to form OH. This results in a low H2O/OH ratio. Inside the cloud, the H2O and OH production is rapidly dominated by H3O+ dissociative recombination and the H2O/OH ratio tends to a constant value that basically depends on the assumed branching ratio (we have taken =0.25).
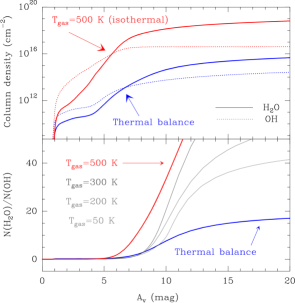
At least two different scenarios can produce large column densities of gas at high Tk. The first one is the presence of several clumpy PDRs within ISO’s beam. In this scenario, far–IR H2O and OH observations will only trace the PDR–clump surfaces. The second one is the presence of shocks. It is very likely that widespread low velocity shocks can locally heat the gas within the envelope and preserve a fraction of the molecular gas with temperatures up to 500 K (Flower et al., 1995), but the same is possible in the clumpy PDR scenario. With these temperatures neutral-neutral reactions play an important role in the chemistry. To simulate this situation, we have run several iso–thermal models with temperatures ranging from 500 to 50 K. Some selected results are also shown in Fig. 10. From these models it is clear that both (H2O) and (OH) are clearly enhanced by neutral-neutral reactions (Fig. 10, upper panel). If the temperature is high, these models reproduce the observational values much better. Hence, a significant fraction of warm gas seems to be needed to reproduce the large H2O and OH column densities observed toward Sgr B2. This conclusion agrees with the large temperatures derived from OH observations in the far–IR (Goicoechea & Cernicharo, 2002).
The gas temperature determines the contribution of neutral-neutral reactions (1) and (2). As the temperature of the gas increases, reaction (1) contributes to a enhancement of the H2O/OH ratio (Fig. 10, lower panel). Note that a moderate increase of the radiation field (to =104) shifts the H2O/OH curve to larger AV inside the cloud until photodissociation becomes less important. In the shielded regions of the cloud, the predicted column densities are similar to those with =5103.
The H2 column density (or AV) responsible of the warm gas observed from far–IR absorption lines (the location of the species in optical depth) has been traditionally difficult to establish. A comparison between the observational H2O/OH ratio and photochemistry models shows that the bulk of the H2O/OH absorption must arise from the surface of Sgr B2 (a maximum AV of 5 to 10 mag), in agreement with the large opacities derived from the radiative transfer models. Even assuming an homogeneous surface cloud, most of the water vapor will arise from AV10 mag if Tk500 K while 50 of water can be at AV10 mag if Tk300 K. Therefore, an accurate description of the thermal structure of the cloud (with far–IR diagnostics tracing the same gas) will be needed to establish more detailed conclusions. Still, in a inhomogeneous medium, several PDR-like clump surfaces locally heated to Tk300–500 K by low velocity shocks could be entirely responsible for the far–IR H2O/OH absorption.
Taking into account the uncertainties implied in the determination of
column densities in the envelope, we take
(H2O)(1-2)10-5 as a lower limit.
There is a determination of HD column density toward Sgr B2 of
1018 cm-2, which translates
into 1024 cm-2 (Polehampton et al. 2002).
However, taking into account the huge absorption by dust
at 112 m (4), it is unlikely that in this HD column density the
cold gas, where high column densities are expected, is accounted for. We derive,
see (Goicoechea & Cernicharo, 2002), that the H2 column density in the warm gas is
1022 cm-2.
Besides, the 183.31 GHz observations imply that the water abundance is
at least an order of magnitude lower in the core regions..
However, we underline the importance of further detection of weak H2O lines
and/or lines with a lesser dependence from the dust emission to
refine the models and better constrain the physical parameters of the region
(e.g. the temperature), that also determine much of the chemistry.
Specially important will be the input of the Herschel/HIFI observations
for water lines below 2 THz.
Another difficult problem is to place the origin of the FUV radiation field revealed by the fine structure line observations in the region (G, 04). In principle, FUV photons could arise from the massive stars near the Sgr B2(M) core and/or from another stellar population within the envelope itself (not resolved yet by observations). The permeating effect of the radiation field will be determined by the clumpyness and inhomogeneity of the medium surrounding the stars, and by the energy of the stellar photons. In addition, X–rays observations could complement this scenario of widespread low velocity shocks and UV radiation. Energetic EUV– and/or X–ray photons can penetrate deeper in the neutral cloud than FUV–photons, and thus, could also play a role in the chemistry, as they can also induce many photo–ionization and photo–dissociation processes. The correlation found in the Sgr B complex between the 6.4 keV Fe0 line and the SiO emission could also indicate that the X–ray sources also drive the shocks in the region (Martín–Pintado et al., 2000).
Gas temperatures in XDRs can easily reach Tk300–500 K because of the more efficient gas heating by X–ray–induced photoelectrons from the gas (and not from dust grains as in PDRs). Under these conditions, neutral–neutral reactions dominate the chemistry and especially OH reaches large abundances. However, XDR models predict low H2O/OH0.1 abundance ratios (Maloney et al., 1996), and thus, they can not be the dominant scenario explaining the far–IR water and OH lines toward Sgr B2 (Goicoechea & Cernicharo, 2002).
Sgr B2 shows diffuse emission in the K line of Fe0 at 6.4 keV (Murakami et al., 2001). A dozen of compact X–ray sources have been detected within Sgr B2 cloud, and they may explain the whole X–ray emission found in the region. Many of the detected X–ray sources are not associated with radio (H ii regions created by massive stars) nor with IR sources. According to these observations, the intrinsic X–ray luminosity toward Sgr B2(M) is 1035 erg s-1, which translates into a X–ray flux incident on molecular gas of 0.1–0.001 erg cm-2 s-1 (assuming 0.1–1 pc from the X–ray source). Hence, the X–ray field within Sgr B2(M) is in the low tail, or even weaker, than those studied by Maloney et al. (1996). As noted by G04, the low [O i]63 m/[C ii]158 m and ([O i]63+[C ii]158)/FIR intensity ratios observed in the region favor a dominant PDR origin for these lines. Both shock (Draine et al., 1983) and XDR (Maloney et al., 1996) models predict larger ratios.
6. Summary
We have carried out far–IR observations of several thermal absorption lines of water vapor toward Sgr B2(M) and have mapped the 183.31 GHz water line around the main dust condensations of the complex. The main conclusions of this work are the following:
-
1.
The detected water absorption lines are very opaque and arise from the warm envelope around Sgr B2(M). The observation of the CO =7–6 line and the lack of far–IR CO lines at ISO’s sensitivities (3 limits below 210-18 W cm-2) imply that the density of such layer is (H2)104 cm-3. The para–H2O 313–202 line at 183.31 GHz shows 40′′40′′ extended emission around Sgr B2(M) and 40′′20′′ around Sgr B2(N). This is the first observation of that line in a GC source and represents further evidence that water vapor is extended in warm molecular clouds.
-
2.
LVG and nonlocal radiative transfer calculations have been carried out to extract the water vapor abundance and to constrain the physical parameters of the absorbing/emitting regions. Because of the radiative excitation by dust photons, the far–IR water lines are not very sensitive to Tk. Taking into account the analysis of the related species OH (Goicoechea & Cernicharo, 2002), the water absorption must arise from warm gas at similar temperatures, i.e., from 300 to 500 K. For this warm envelope, we found (H2O)= cm-2. An important fraction of the 183.31 GHz emission arises from the inner, denser and colder gas located closer to the main cores. We estimate a water abundance of a few10-7 in the denser regions.
-
3.
Photochemistry models show that a component of warm gas, 300-500 K, is needed to activate the neutral-neutral reactions and reproduce the large H2O and OH column densities observed in the envelope. We show that OH and H2O far–IR observations toward Sgr B2 are surface tracers of the cloud (a maximum AV of 5 to 10 mag). We found (H2O)(1-2)10-5 in these regions. Although irradiated by FUV, and possibly more energetic photons, affecting the H2O/OH ratio in the outermost layers, a clumpy structure for the PDR is needed. Alternatively, low velocity shocks could maintain the gas heating through the envelope.
Due to the complexity of Sgr B2 (and also of the GC ISM as a whole) a multiple scenario is needed to explain the modest angular resolution far–IR observations. The input of chemical models, and higher sensitivity and larger spatial resolution far–IR observations will lead to a better understanding of the GC environment.
References
- Asensio Ramos & Trujillo Bueno (2003) Asensio Ramos, A. & Trujillo Bueno, J. 2003, in Stellar Atmosphere Modeling, ed. I. Hubeny, D. Mihalas, & K. Werner, ASP Conf. Ser. 288 (San Francisco: ASP), 335
- Asensio Ramos & Trujillo Bueno (2006) Asensio Ramos, A. & Trujillo Bueno, J. 2006, EAS Publications Series, ed. Ph. Stee. EDP Sciences, in press.
- Bergin et al. (2000) Bergin, E. A. et al. 2000, ApJ, 539, L129
- Ceccarelli et al. (2002) Ceccarelli, C. et al. 2002 A&A, 383, 603
- Cernicharo et al. (1990) Cernicharo, J., Thum, C., Hein, H., John, D., Garcia, P., & Mattioco, F. 1990, A&A, 231, L15
- Cernicharo et al. (1994) Cernicharo, J., Gonzalez-Alfonso, E., Alcolea, J., Bachiller, R., & John, D. 1994, ApJ, 432, L59
- (7) Cernicharo, J., Bachiller, R. & González–Alfonso, E. 1996, A&A, 305, L5
- Cernicharo et al. (1997) Cernicharo, J. et al. 1997, A&A, 323, L25
- Cernicharo et al. (1999) Cernicharo, J., Pardo, J.R., González–Alfonso, E., Serabyn, E., Phillips, T.G., Benford, D.J., & Mehringer, D. 1999, ApJ, 520, L131
- Cernicharo (1999) Cernicharo, J., 1999, Astrophysics and Space Science, 263, 175
- Cernicharo et al. (2000) Cernicharo, J., Goicoechea, J.R., & Caux, E. 2000, ApJ, 534, L199
- Clegg et al. (1996) Clegg, P. E. et al. 1996, A&A, 315, L38
- Comito et al. (2003) Comito, C., Schilke, P., Gerin, M., Phillips, T. G., Zmuidzinas, J., & Lis, D. C. 2003, A&A, 402, 635
- Cheung et al. (1969) Cheung, A. C., Rank, D. M., Townes, C. H., Thornton, D. D., & Welch, W. J. 1969, Nature, 221, 626
- de Graauw et al. (1996) de Graauw, T. et al., 1996, A&A, 315, 49
- Draine et al. (1983) Draine, B.T., Roberge, W.G., & Dalgarno, A. 1983, A&A, 264, 485
- Fabiani Bendicho, Trujillo Bueno & Auer (1997) Fabiani Bendicho, P., Trujillo Bueno, J. & Auer L. H. 1997, A&A, 324, 161
- Flower et al. (1995) Flower, D. R., Pineau des Forets, G., & Walmsley, C. M. 1995, A&A, 294, 815
- Flower (2001) Flower, D. R. 2001, J.Phys.B, 34, 2731
- Goicoechea & Cernicharo (2001) Goicoechea, J.R. & Cernicharo, J. 2001, ApJ, 554, L213
- Goicoechea & Cernicharo (2002) Goicoechea, J.R. & Cernicharo, J. 2002, ApJ, 576, L77
- G (04) Goicoechea, J.R., Rodriguez-Fernandez, N.J., Cernicharo, J. 2004, ApJ, 600, 214
- (23) González–Alfonso, E. & Cernicharo, J. 1993, A&A, 279, 506
- (24) González–Alfonso, E., Cernicharo, J., Alcolea, J., & Orlandi, M. A. 1998, A&A, 334, 1016.
- Gordon et al. (1993) Gordon, M. A., Berkermann, U., Mezger, P. G., Zylka, R., Haslam, C. G. T., Kreysa, E., Sievers, A. & Lemke, R. 1993, A&A, 280, 208
- Green et al. (1993) Green, S., Maluendes, S., & McLean, A. D. 1993, ApJS, 85, 181
- Gry et al. (2003) Gry, C. et al. 2003, The ISO Handbook’, Volume III - LWS - The Long Wavelength Spectrometer Version ESA SP-1262, 2003.
- Hüttemeister et al. (1993) Hüttemeister, S., Wilson, T. L., Henkel, C.; Mauersberger, R. 1993, A&A, 276, 445
- Hüttemeister et al. (1995) Hüttemeister, S., Wilson, T. L., Mauersberger, R., Lemme, C., Dahmen, G., Henkel, C. 1995, A&A, 294, 667
- Jacq et al. (1990) Jacq, T., Walmsley, C. M., Henkel, C., Baudry, A., Mauersberger, R., Jewell, P. R. 1990, A&A, 228, 447
- Kooi et al. (2000) Kooi, J.W., Kawamura, J., Chen, J., Chattopadhayay, G., Pardo, J.R., Zmuidzinas, J., Phillips, T.G., Bumble, B., Stern, J., LeDuc, H.G., 2000, J. Infrared and Millimeter Waves, 21, 1357.
- see Jensen et al. (2000) Jensen, M. J., Bilodeau, R. C., Safvan, C. P., Seiersen, K., Andersen, L. H., Pedersen, H. B., & Heber, O. 2000, ApJ, 543, 764
- Kessler et al. (1996) Kessler, M.F., et al. 1996, A&A, 315, L27
- Kim et al. (2002) Kim, S., Martin, C.L., Stark, A.A., & Lane, A.P. 2002, ApJ, 580, 896
- Kunasz & Auer (1988) Kunasz, P. B., & Auer, L. H. 1988, J. Quant. Spec. Radiat. Transf., 39, 67
- Langer & Penzias (1990) Langer, W.D. & Penzias, Arno A. 1990, ApJ, 357, 477
- (37) Le Bourlot, J., Pineau Des Forets, G., Roueff, E. & Flower, D. R. 1993, A&A, 267, 233
- (38) Lis, D.C. & Goldsmith, P.F. 1989, ApJ, 337, 704
- Lis & Goldsmith (1990) Lis, D.C. & Goldsmith, P.F. 1990, ApJ, 356, 195
- Lis & Goldsmith (1991) Lis, D.C. & Goldsmith, P.F, 1991, ApJ, 369, 157
- Maloney et al. (1996) Maloney, P.R., Hollenbach, D.J. & Tielens, A.G.G.M 1996, A&A, 446, 561
- Martín–Pintado et al. (1990) Martín–Pintado, J., de Vicente, P., Wilson, T. L., & Johnston, K. J. 1990, A&A, 236, 193
- Martín–Pintado et al. (1997) Martín–Pintado, J., de Vicente, P., & Fuente, A., & Planesas, P. 1997, ApJ, 482, L45
- Martín–Pintado et al. (2000) Martín–Pintado, J., de Vicente, P., Rodriguez–Fernandez, N. J., Fuente, A., Planesas, P. 2000, ApJ, 356, L5
- Melnick et al. (2000) Melnick, Gary J., et al. 2000, ApJ, 539, L77
- Nordh et al. (2003) Nordh, H.L., von Schéele, F., Frisk, U. et al. 2003, A&A, 402, L21
- Menten et al. (1990) Menten, K.M., Melnick, G.J., Phillips, T.G., Neufeld, D.A. 1990, ApJ, 363, L27
- (48) Menten, K.M., Melnick, G.J., Phillips, T.G. 1990b, ApJ, 350, L41
- Murakami et al. (2001) Murakami, H., Koyama, K. & Maeda, Y. 2001 ApJ, 558, 687
- Neufeld et al. (1995) Neufeld, D.A.; Lepp, S., & Melnick, G.J. 1995, ApJ, 100, 132
- Neufeld et al. (1997) Neufeld, D.A., Zmuidzinas, J., Schilke, P., & Phillips, T.G. 1997, ApJ, 488, L141
- Neufeld et al. (2000) Neufeld, D.A., Ashby, M.L.N., Bergin, E.A., et al. 2000, ApJ, 539, L111
- (53) Neufeld, D.A., Bergin, E.A., Melnick, G.J., & Goldsmith, P.F. 2003, ApJ, 590, 882
- (54) Olson, G. L., Auer, L. H., & Buchler, J. R. 1986, J. Quant. Spec. Radiat. Transf., 35, 431
- (55) Olson, G. L., & Kunasz, P. B. 1987, J. Quant. Spec. Radiat. Transf., 38, 325
- Pardo et al. (2005) Pardo, J.R., Serabyn, E., & Wiedner, 2005, Icarus, 178, 19
- Phillips et al. (1992) Phillips, T. G., van Dishoeck, E.F., & Keene, J. 1992, ApJ, 399, 533
- Polehampton et al. (2002) 2002, Polehampton, E. T., Baluteau, J.-P., Ceccarelli, C., Swinyard, B. M., & Caux, E. A&A, 388, L44
- (59) Rybicki, G. B., & Hummer, D. G. 1991, A&A, 249, 720
- (60) Rybicki, G. B., & Hummer, D. G. 1992, A&A, 262, 209
- Swinyard et al. (1998) Swinyard, B.M., et al. 1998, SPIE, 3354, 888
- Trujillo Bueno & Fabiani Bendicho (1995) Trujillo Bueno, J. & Fabiani Bendicho P. 1995, ApJ, 455, 646
- Waters et al. (1980) Waters, J. W. et al. 1980, ApJ, 235, 57
- Williams et al. (1996) Williams, T.L., Adams, N.G., Babcock, L.M., Herd, C.R., & Geoghegan, M. 1996, MNRAS, 282, 413
- Wilson et al. (1982) Wilson, T. L., Ruf, K., Walmsley, C. M., Martin, R. N., Batrla, W., Pauls, T. A. 1982, A&A, 115, 185
- Zmuidzinas et al. (1995) Zmuidzinas, J., Blake, G. A., Carlstrom, J., Keene, J., Miller, D., Schilke, P. & Ugras, N. G. 1995, In Astronomical Society of the Pacific, Airborne Astronomy Symposium on the Galactic Ecosystem: From Gas to Stars to Dust, Volume 73, 33-40.
| species | transition | (m) | (GHz) | (K) | (s-1) | Fl (W cm-2) | F/Fc | v (km s-1) |
|---|---|---|---|---|---|---|---|---|
| p–H2O | 1635.439 | 183.3 | 205 | 3.53e06 | 112060 K km s-1 | 303 | ||
| o–HO | 181.053 | 1655.8 | 79 | 5.45e02 | (2.680.26)e18 | 0.730.02 | 522 | |
| o–H2O | 180.488 | 1661.0 | 160 | 2.99e02 | (3.440.46)e18 | 0.740.01 | 643 | |
| o–H2O | 179.527 | 1669.9 | 80 | 5.47e02 | (6.760.29)e14 | 0.060.03 | 20423 | |
| o–H2O | 174.626 | 1716.7 | 163 | 4.94e02 | (1.860.46)e18 | 0.820.02 | 442 | |
| p–H2O | 138.527 | 2164.1 | 205 | 1.22e01 | (1.270.03)e18 | 0.890.02 | 412 | |
| o–H2O | 121.719 | 2462.9 | 516 | 1.20e01 | (5.400.29)e18 | 0.960.01 | 629 | |
| o–H2O | 108.073 | 2773.9 | 160 | 2.52e01 | (6.070.05)e18 | 0.640.02 | 532 | |
| p–HO | 102.008 | 2938.9 | 194 | 2.52e01 | (9.382.62)e19 | 0.960.01 | 728 | |
| p–H2O | 100.983 | 2968.7 | 196 | 2.55e01 | (6.020.11)e18 | 0.660.01 | 559 | |
| p–H2O | 89.988 | 3331.4 | 297 | 3.45e01 | (1.990.14)e18 | 0.900.01 | 672 | |
| o–H2O | 75.380 | 3977.0 | 271 | 3.25e01 | (4.320.07)e18 | 0.690.02 | 512 | |
| p–H2O | 67.089 | 4468.6 | 410 | 1.20e00 | (1.360.08)e18 | 0.930.03 | 768 | |
| o–H2O | 66.437 | 4512.4 | 376 | 1.22e00 | (8.390.14)e19 | 0.920.02 | 463 |
| species | transition | (m) | (GHz) | (K) | (s-1) | Fl (W cm-2) | F/Fc |
|---|---|---|---|---|---|---|---|
| CO | 185.9 | 1611.8 | 581 | 2.95e04 | 2.28e18 | 1.007 | |
| CO | 173.6 | 1726.6 | 663 | 3.64e04 | 1.02e18 | 1.003 | |
| CO | 162.8 | 1841.3 | 752 | 4.42e04 | 1.14e18 | 1.003 | |
| CO | 153.3 | 1956.0 | 846 | 5.31e04 | 1.49e18 | 1.003 |