A rotating disk around the very young massive star AFGL 490
Abstract
We observed the embedded, young 8–10 M⊙ star AFGL 490 at subarcsecond resolution with the Plateau de Bure Interferometer in the C17O (2–1) transition and found convincing evidence that AFGL 490 is surrounded by a rotating disk. Using two-dimensional modeling of the physical and chemical disk structure coupled to line radiative transfer, we constrain its basic parameters. We obtain a relatively high disk mass of 1 M⊙ and a radius of 1 500 AU. A plausible explanation for the apparent asymmetry of the disk morphology is given.
Subject headings:
circumstellar matter — line: profiles — radiative transfer — planetary systems: protoplanetary disks — stars: formation — stars: individual: AFGL 490 (catalog )1. Introduction
The study of very young massive stars is of particular importance for star formation since it is not yet firmly established by what process, disk accretion or stellar merging, such stars form (e.g., Yorke & Sonnhalter, 2002; Dobbs, Bonnell, & Clark, 2005). Previous authors have demonstrated that massive stars can be formed via accretion, leading to the formation of large ( AU) and massive ( M⊙) circumstellar disks. However, most of these stars are located more than 2 kpc away, which makes it challenging to confirm unambiguously the presence of accretion disks around single objects with radio interferometry due to the lack of spatial resolution.
We focus on AFGL 490 – one of the best-studied young stars that are in a transition stage to Herbig Be stars. This very young star is located nearby ( kpc, Snell et al., 1984), has a mass of 8–10 M⊙, a bolometric luminosity of L⊙ (B2–3 star, Panagia, 1973), is still embedded in its parent molecular cloud (A mag, Alonso-Costa & Kwan, 1989), and drives a high-velocity outflow (Mitchell et al., 1995). Interferometric measurements by e.g. Schreyer et al. (2002, hereafter Paper I) as well as IR observations of Campbell, Persson, & McGregor (1986) and Bunn, Hoare, & Drew (1995) have revealed that the star is located inside an ionized AU cavity cleared up by a fast stellar wind and surrounded by a AU disk-like structure, which is enshrouded in a 22 000 AU 6 000 AU envelope. All these structures are further embedded in an even more extended envelope.
In this Letter, we present subarcsecond-resolution PdBI observations of AFGL 490 that prove the existence of a rotating disk around AFGL 490 and determine its orientation, size, and mass by using comprehensive physical, chemical, and line radiative transfer modeling.
2. Observations with the Plateau de Bure interferometer
We observed AFGL 490 in C17O (2–1) at 224.714389 GHz using the PdBI in its B configuration in December 2003 (baselines 61.5m–330.5m). The phase reference center of our measurements was = 03h 27m 3855, = 46 598, and the source velocity was set to km s-1. For the line measurements, we used one correlator unit with a total bandwidth of 20 MHz and 512 channels (velocity resolution of 0.052 km s-1). Two other correlator units with a bandwidth of 320 MHz each were utilized to measure the continuum.
The bandpass and phase calibration were performed on the objects 3C454.3 and 2145+067. The additional calibrations of the phase and amplitude were obtained by observing the objects 0355+508 and 0224+671 every 20 minutes. For the final phase calibration and data reduction the Grenoble Software environment GILDAS was applied. The maps of square pixels with pixel size were produced by the Fourier transform of the calibrated visibilities using natural weighting. The synthesized beam size is ( AU at 1 kpc) with a positional angle of 73. For reduction of the continuum, we excluded the line emission from the data. Finally, the continuum was subtracted from the original data in the -plane, as it was detected only at the source position.
3. Results
3.1. Continuum measurements
Within the primary PdBI beam at 1.3mm, AFGL 490 was detected point source with a total flux of 1.41 Jy (peak value is 0.68 Jy beam-1). The continuum is dominated by the thermal dust emission because at 1.3mm the free-free radiation contributes less than 5% to the total flux ( mJy, see Campbell et al., 1986).
3.2. C17O (2–1) line measurements
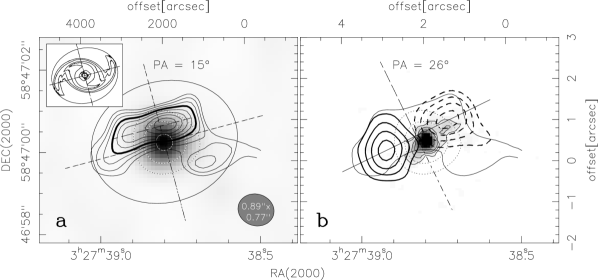
The integrated C17O (2–1) line intensity map overlaid with the 1.3mm continuum is shown in Fig. 1a. The continuum is barely resolved at the level within the AU area around the star, and has a beam-like circular shape. In contrast, the line intensity map reveals a AU arc of emission that is centered on the continuum peak and has a PA of . Furthermore, the C17O emission above the 50% intensity level appears as a 700 AU 2 000 AU bar-like structure with the main axis shifted by 400 AU to the northeast from the center.
The red- and blue-shifted parts of the integrated C17O (2–1) line intensity overlaid with an -band speckle image (Alvarez et al., 2004) and the 1.3mm continuum is presented in Fig. 1b. Both lobes have their maximum 700 AU away from the 1.3mm continuum point source, and the line connecting them is shifted 260 AU to the northeast (PA of the axis perpendicular to the connecting line is ). Due to the simultaneous measurement of both line and continuum in the same bandpass, the positional offset is certainly real. Remarkably, the position of the red- and blue-shifted C17O (2–1) peaks perfectly coincides with the position of the CS (2–1) peaks reported in Paper I. The PA of the C17O emission is smaller than the positional angle of the AU bar-like structure (see Paper I), but the emission structure is orthogonal to the large-scale CO outflow (Mitchell et al., 1995) and coincides with the PA obtained from the infrared polarized map and the 2cm radio emission (Campbell et al., 1986; Haas et al., 1992). Note that the C17O emission pattern (Fig. 1b) is characteristic of outflows or rotating disk-like configurations. To distinguish between these two possibilities, we analyze the corresponding position-velocity diagram below.
3.2.1 Disk mass
We estimate the mass of the AFGL 490 “inner disk” from the 1.3mm continuum emission, using Eq. 2 from Henning et al. (2000). We assume the standard gas-to-dust mass ratio of 100, a mean disk temperature of K, and a dust mass absorption coefficient at 1.3mm between 1.99 and 5.86 cm2 g-1 (grains without icy mantles, gas densities 106 and 108 cm-3, respectively, see Ossenkopf & Henning, 1994). The resulting H2 gas mass is between 0.8 and 2.3 M⊙ and, thus, the source-averaged H2 column density is cm-2.
The gas mass can be also derived from the C17O data. Due to missing flux of 30 % in the vicinity of AFGL 490, even in the reverse map side of the red- and the blue-shifted line emission, the total integrated flux value is smaller than the sum of individual contributions from the red- and blue-shifted emission. The sidelobes of the synthesized beam are not contributing to the low integrated fluxes due to their low intensities (20 %). Thus, we focus on the sum of the red- and the blue-shifted emission.
Assuming optically thin C17O line emission, the gas mass can be derived by
where is the optical depth of the C17O (2–1) line, K is the excitation temperature, is the H2 abundance relative to the amount of C17O molecules (H2/CO=, 16O/17O), and kpc is the distance to the source. The masses of the red- and blue-shifted gas are 1.0 and 0.6 M⊙, respectively, giving a total value of M⊙ which matches the estimate obtained above.
3.2.2 Disk velocity field
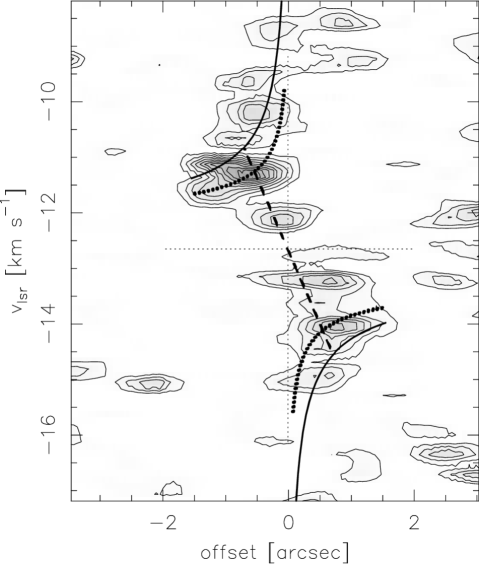
The gas velocity distribution across the red- and blue-shifted C17O emission (solid line in Fig. 1b) is presented in the position-velocity (PV) diagram in Fig. 2. The PV map shows a number of single gas clumps, indicating an inhomogeneous disk structure. This distribution is not caused by optical depth effects as demonstrated by radiative transfer calculations (see Sect. 3.3). To fit the PV diagram, we adopt a simple model of a Keplerian disk with a mass that linearly increases with radius (Vogel et al., 1985) and a stellar mass of M⊙. We assume a disk radius of 1 600 AU based on the spatial extent of the C17O emission and a disk mass between 0.5 and 2 M⊙. With this model, we fit the inner clumps () of the the PV map and obtain the best-fit inclination angle of (Fig. 2, solid curve). The fit to the most intense clumps in the PV map at is not as good. It gives and super-Keplerian gas velocities in the inner disk. In contrast to massive disks around active galactic nuclei that show a modified Keplerian law with an exponent of (e.g., Kondratko et al., 2005), the corresponding curve for AFGL 490 (Fig. 2, dotted curve) would only fit to the outer disk part. However, it does not fit the inner clumps. Furthermore, the four most intense clumps in the PV map around km s-1 can be best fitted by a rotating gas ring with a radius of 700 AU and similar (dashed line). Such a small inclination angle is in contrast to the apparent C17O morphology implying an inclination angle larger than 60 for any circularly-symmetric configuration, e.g. a disk (see ellipse in Fig. 1a). However rotation curves for any disk or ring model with larger inclination angles, , can only be well fitted assuming a low-mass central star, 2 M⊙ which is definitely not the case for AFGL 490. Thus, we propose that there is a massive, clumpy disk around AFGL 490 with nearly face-on orientation () and Keplerian rotation.
3.3. Disk modeling
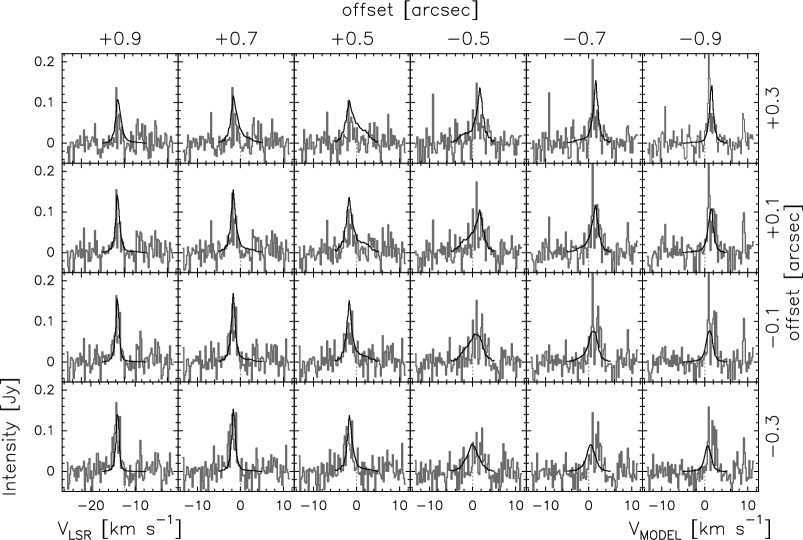
The PdBI C17O (2–1) spectral map of the AFGL 490 disk is presented in Fig. 3. We fit these spectra using the “step-by-step” modeling approach (Semenov et al., 2005, for details see Semenov et al. 2006, in preparation). Briefly, we apply the 2D flared-disk model of Dullemond & Dominik (2004) to simulate the disk physical structure, a gas-grain chemical network to calculate time-dependent abundances, and a 2D line radiative transfer code of Pavlyuchenkov & Shustov (2004) to synthesize the C17O spectra. We assume that the disk has the power-law surface density and the velocity profile . The dust grains have MRN-like size distribution and the gas-to-dust mass ratio is 100. Moreover, we assume an age of 0.1 Myr due to the lack of reliable estimates. Churchwell (1999) reported the dynamical outflow time of 1.8 104 yr which is an lower limit (see Henning et al., 2000). The best fit to the observed C17O (2–1) lines is obtained with the following disk parameters: (1) inclination and positional angles of , (2) inner and outer radii of AU and AU, respectively, (3) a surface density gradient , and (4) a Keplerian-like velocity profile, . The best-fit disk mass ranges between and 1 M⊙. Note that the modeled line profiles are indeed optically thin, . All these values are in a good agreement with the observational results, and the values derived from the PV diagram.
4. Discussion and Conclusions
Why do we see such a clumpy disk structure? This object seems to be relatively young and could still be in a perturbed state that remains from an earlier, non-steady accretion phase. The viscous dissipation timescale for the AFGL 490 disk is estimated to be 1 Myr (Pringle, 1981), which far exceeds its age. This hypothesis is further supported by the fact that the years old, large-scale CO outflow consists of single moving gas clumps, and thus accretion is indeed non-steady (Mitchell et al., 1995). Another explanation could be that the C17O (2–1) emission traces the densest parts of the spiral arms that are easily excited in massive disks by gravitational instabilities. Indeed, the morphology of the C17O emission resembles the density structure of a self-gravitating disk with double arms (upper corner in Fig. 1a) calculated by Fromang et al. (2004a). Moreover, the numerical simulations by Fromang, Balbus, & De Villiers (2004b) imply that such disks should also develop a dual structure composed of an inner thin Keplerian disk fed by a thicker self-gravitating torus with nearly uniform rotation. Finally, a clumpy disk structure could be a result of a recent encounter with a nearby star or due to the gravitational interaction with a wide low-mass companion. The complex multiple outflow systems seen in the close vicinity of AFGL 490 strongly support this idea (see Fig. 4b in Paper I).
In this Letter, we present clear evidence that M⊙ stars can be surrounded by Keplerian disks in their earliest evolutionally phase (see also Shepherd, Claussen & Kurtz, 2001). In contrast to the previously reported huge disks around such stars with radii of AU (e.g., Chini et al. 2004, but see Sako et al. 2005) the AFGL 490 disk is much smaller, AU. Using advanced theoretical modeling, we constrain basic disk parameters: (1) the inclination and positional angles are , (2) the surface density profile is , (3) the mass is 1.5 M⊙ ( uncertainty), and (4) the disk rotation is close to Kepler’s law.
References
- Alonso-Costa & Kwan (1989) Alonso-Costa, J.L., & Kwan, J. 1989, ApJ, 338, 403
- Alvarez et al. (2004) Alvarez, C., Hoare, M., Glindemann, A., & Richichi, A., 2004, A&A, 427, 505
- Bunn et al. (1995) Bunn, J.C., Hoare, M.G., & Drew, J.E., 1995, MNRAS 272, 346
- Campbell et al. (1986) Campbell, B., Persson, S.E., & McGregor, P.J., 1986, ApJ 305, 336
- Chini et al. (2004) Chini, R., Hoffmeister, V., Kimeswenger, S., Nielbock, M., Nürnberger, D., Schmidtobreick, L., & Sterzik, M. 2004, Nature, 429, 155
- Churchwell (1999) Churchwell, E., 1999, Massive Star Formation, in The Origin of Stars and Planetary Systems, eds. C.J. Lada, & N.D. Kylafis (Kluwer Academic Publishers), 515
- Dobbs et al. (2005) Dobbs, C.L., Bonnell, I.A., & Clark, P.C. 2005, MNRAS, 360, 2
- Dullemond & Dominik (2004) Dullemond, C., & Dominik, C. 2004, A&A, 417, 159
- Fromang et al. (2004b) Fromang, S., Balbus, S.A., & De Villiers, J.-P. 2004, ApJ, 616, 357
- Fromang et al. (2004a) Fromang, S., Balbus, S.A., Terquem, C., & De Villiers, J.-P. 2004, ApJ, 616, 364
- Gear et al. (1986) Gear, W.K., Robsons, E.I., Gee, G., Ade, P.A.R., & Duncan, W.D. 1986, MNRAS, 219, 835
- Greenhill et al. (1996) Greenhill, L.J., Gwinn, C.R., Antonucci, R., & Barvainis, R. 1996, ApJ, 472, L21
- Haas et al. (1992) Haas, M., Leinert, Ch., & Lenzen, R. 1992, å, 261, 130
- Henning et al. (2000) Henning, Th., Schreyer, K., Launhardt, L., & Burkert, A. 2000, A&A, 353, 211
- Kondratko et al. (2005) Kondratko, P.T., Greenhill, L.J., & Moran, J.M. 2005, ApJ, 618, 618
- Mitchell et al. (1995) Mitchell, G.F., Lee, S.W., Maillard, J., Matthews, H., Hasegawa, T.I., & Harris, A.I. 1995, ApJ, 438, 794
- Mundy & Adelman (1988) Mundy, L.G., & Adelman, G.A. 1988, ApJ, 329, 907
- Nakamura et al. (1991) Nakamura, A., Kawabe, R., Kitamura, Y., Ishiguro, M., Murata, Y., & Ohashi, N. 1991, ApJ 383, L81
- Ossenkopf & Henning (1994) Ossenkopf, V., & Henning, Th. 1994, A&A, 291, 943
- Panagia (1973) Panagia, N. 1973, AJ, 78, 929
- Pavlyuchenkov & Shustov (2004) Pavlyuchenkov, Ya.N., & Shustov, B.M. 2004, Astron. Rep., 48, 315
- Pringle (1981) Pringle, J.E. 1981, ARA&A, 19, 137
- Sako et al. (2005) Sako, S., Yamashita, T., Kataza, H., Miyata, T., Okamoto, Y.K., Honda, M., Fujiyoshi, T., Terada, H., Kamazaki, T., Jiang, Z., Hanawa, T., Onaka, T. 2005, Nature, 434, 995
- Schreyer et al. (2002) Schreyer, K., Helmich, F.P., van Dishoeck, E.F., & Henning, Th. 1997, A&A, 326, 347 (Paper I)
- Semenov et al. (2005) Semenov, D., Pavlyuchenkov, Y., Schreyer, K., Henning, Th., Dullemond, C., & Bacmann, A. 2005, ApJ, 621, 853
- Shepherd, Claussen & Kurtz (2001) Shepherd, D. S., Claussen, M. J., & Kurtz, S. E. 2001, Science, 292, 1513
- Snell et al. (1984) Snell, R.L., Scoville, N.Z., Sanders, D.B., & Erickson, N.R. 1984, ApJ, 284, 176
- Vogel et al. (1985) Vogel, S.N., Bieging, J.H., Plambeck, R.L., Welch, W.J., & Wright, M.C.H. 1985, ApJ, 296, 600
- Yorke & Sonnhalter (2002) Yorke, H.W., & Sonnhalter, C. 2002, ApJ, 569, 846